Abstract
Background
Blood gas analysis plays a crucial role in critical care settings, and immediate and precise analysis improves clinical outcomes through prompt treatment. We evaluated the performance of a cartridge-type blood gas analyzer, i-Smart 300 (i-SENS, Korea), according to the Clinical and Laboratory Standard Institute (CLSI) guidelines and compared it to a conventional blood gas analyzer.
Methods
The precision was evaluated according to CLSI EP5-A3. The i-Smart 300 was compared to the Stat Profile Critical Care Xpress (STP CCX) (Nova CCX; Nova Biomedical, USA) according to CLSI EP9-A3 using the following eight parameters: pH, partial carbon dioxide pressure, partial oxygen pressure, sodium, potassium, chloride, ionized calcium, and hematocrit. Linearity was determined using five levels of control materials according to CLSI EP6-A.
Results
Within-run precision and total precision, demonstrated as coefficients of variation, ranged from 0.02 to 2.50% and from 0.05 to 3.46%, respectively. Correlation analysis yielded a correlation coefficient from 0.966 to 0.996 between the i-Smart 300 and the conventional analyzer (Nova CCX). The i-Smart 300 showed excellent linearity at eight parameters with acceptable percent recovery.
Go to : 
REFERENCES
1. Uyanik M, Sertoglu E, Kayadibi H, Tapan S, Serdar MA, Bilgi C, et al. Comparison of blood gas, electrolyte and metabolite results measured with two different blood gas analyzers and a core laboratory analyzer. Scand J Clin Lab Invest. 2015; 75:97–105.

2. De Koninck AS, De Decker K, Van Bocxlaer J, Meeus P, Van Hoovels L. Analytical performance evaluation of four cartridge-type blood gas analyzers. Clin Chem Lab Med. 2012; 50:1083–91.

3. Einstein MH, Smith KM, Davis TE, Schmeler KM, Ferris DG, Savage AH, et al. Clinical evaluation of the cartridge-based GeneXpert human papillomavirus assay in women referred for colposcopy. J Clin Microbiol. 2014; 52:2089–95.

4. Leino A, Kurvinen K. Interchangeability of blood gas, electrolyte and metabolite results measured with point-of-care, blood gas and core laboratory analyzers. Clin Chem Lab Med. 2011; 49:1187–91.

5. CLSI. Blood Gas and pH Analysis and Related Measurements; Approved Guideline—Second Edition. CLSI document C46-A2. Wayne, PA: Clinical and Laboratory Standards Institute. 2009.
6. CLSI. Evaluation of Precision of Quantitative Measurement Procedures; Approved Guideline—Third Edition. CLSI document EP05-A3. Wayne, PA: Clinical and Laboratory Standards Institute. 2014.
7. CLSI. Preliminary evaluation of quantitative clinical laboratory measurement procedures; Approved Guideline—Third Edition. CLSI document EP10-A3. Wayne, PA: Clinical and Laboratory Standards Institute. 2006.
8. CLSI. Evaluation of the Linearity of Quantitative Measurement Procedures: A Statistical Approach; Approved Guideline. CLSI document EP06-A. Wayne, PA: Clinical and Laboratory Standards Institute. 2003.
9. CLSI. Measurement Procedure Comparison and Bias Estimation Using Patient Samples; Approved Guideline—Third Edition. CLSI document EP09-A3. Wayne, PA: Clinical and Laboratory Standards Institute. 2013.
10. Ricós C, Alvarez V, Cava F, García-Lario JV, Hernández A, Jiménez CV, et al. Current databases on biological variation: pros, cons and progress. Scand J Clin Lab Invest. 1999; 59:491–500.
11. Ricós C, Alvarez V, Cava F, García-Lario JV, Hernández A, Jiménez CV, et al. Desirable specifcation for total error, imprecision, and bias, derived from intra-and inter-individual biologic variation. http://www.westgard.com/biodatabase1.htm. (updated for 2014).
12. Nichols JH, Christenson RH, Clarke W, Gronowski A, Hammett-Stabler CA, Jacobs E, et al. Executive summary. The National Academy of Clinical Biochemistry Laboratory Medicine Practice Guideline: evidence-based practice for point-of-care testing. Clin Chim Acta. 2007; 379:14–28.

13. Fraser CG, Harris EK. Generation and application of data on biological variation in clinical chemistry. Crit Rev Clin Lab Sci. 1989; 27:409–37.

14. Cotlove E, Harris EK, Williams GZ. Biological and analytic components of variation in longterm studies of serum constituents in normal subjects. 3. Physiological and medical implications. Clin Chem. 1970; 16:1028–32.
15. Harris EK. Statistical principles underlying analytic goal-setting in clinical chemistry. Am J Clin Pathol. 1979; 72(2 Suppl):374–82.
16. Fraser CG. General strategies to set quality specifcations for reliability performance characteristics. Scand J Clin Lab Invest. 1999; 59:487–90.
17. Seok YM, Lee WH, Yoon SY, Won YC, Kwon OH. Evaluation of the i-Smart 30 Point-of-care analyzer for use in clinical laboratory settings. J Lab Med Qual Assur. 2011; 33:25–30.
Go to : 
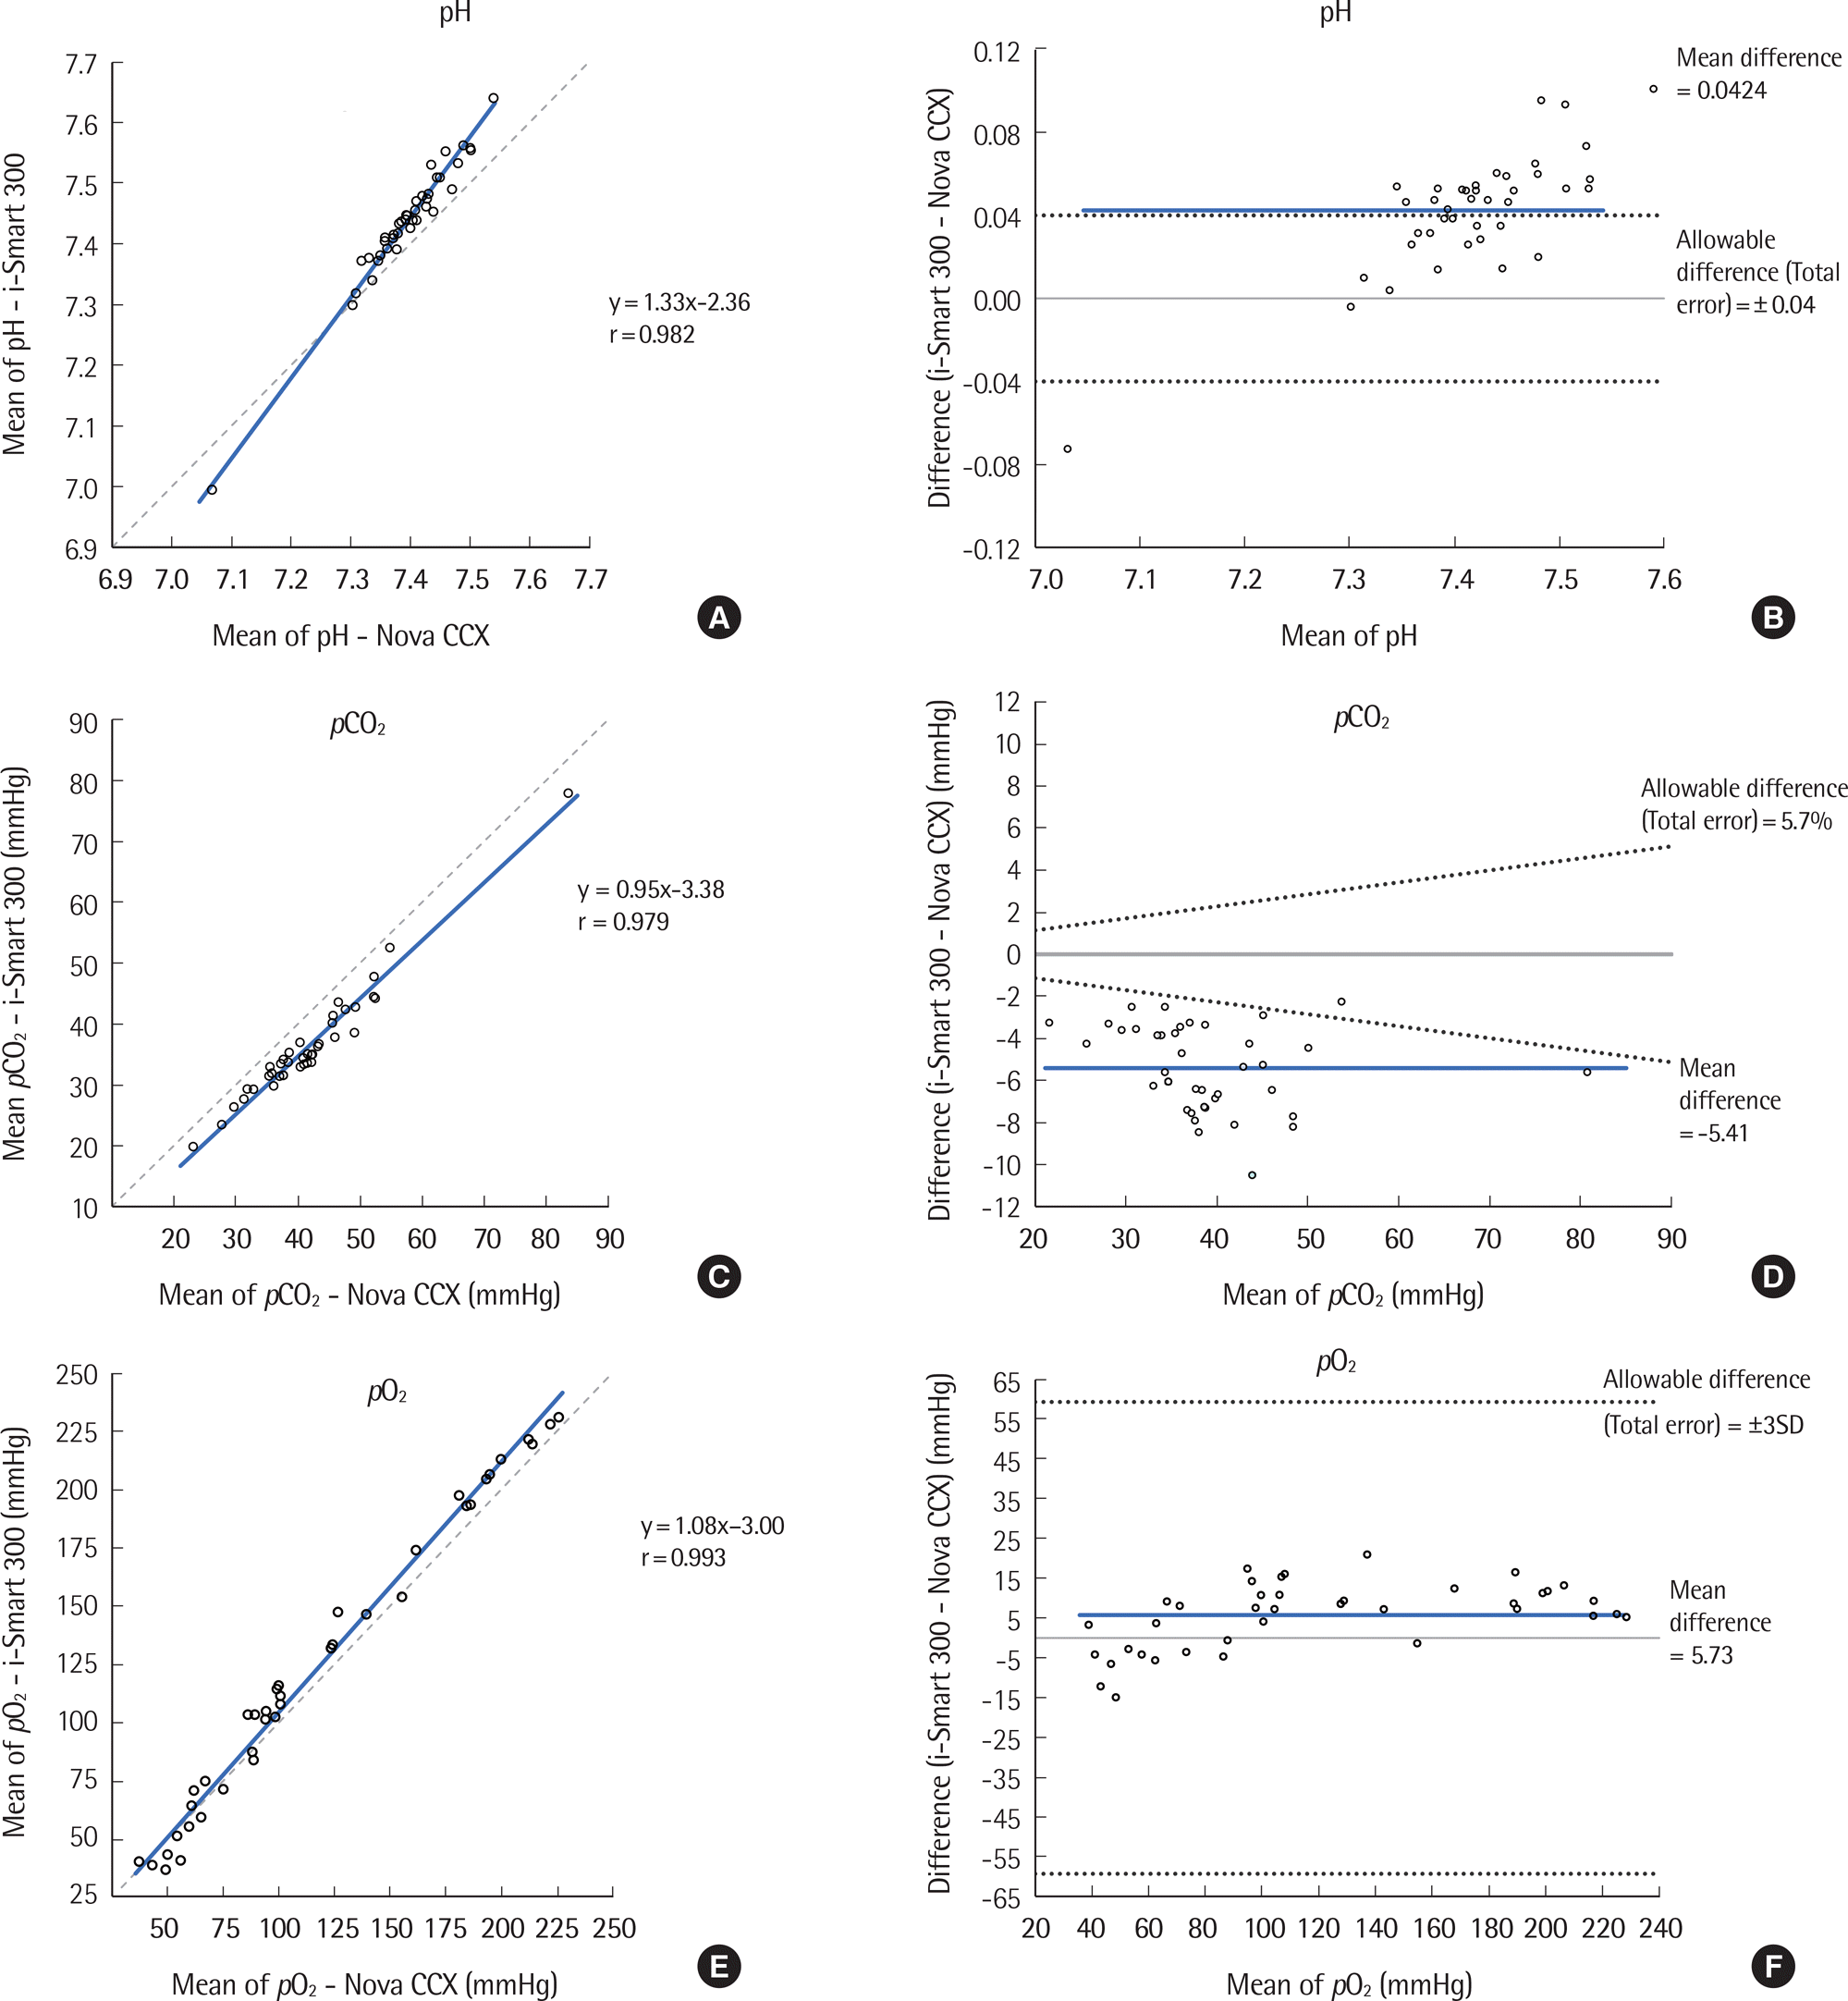
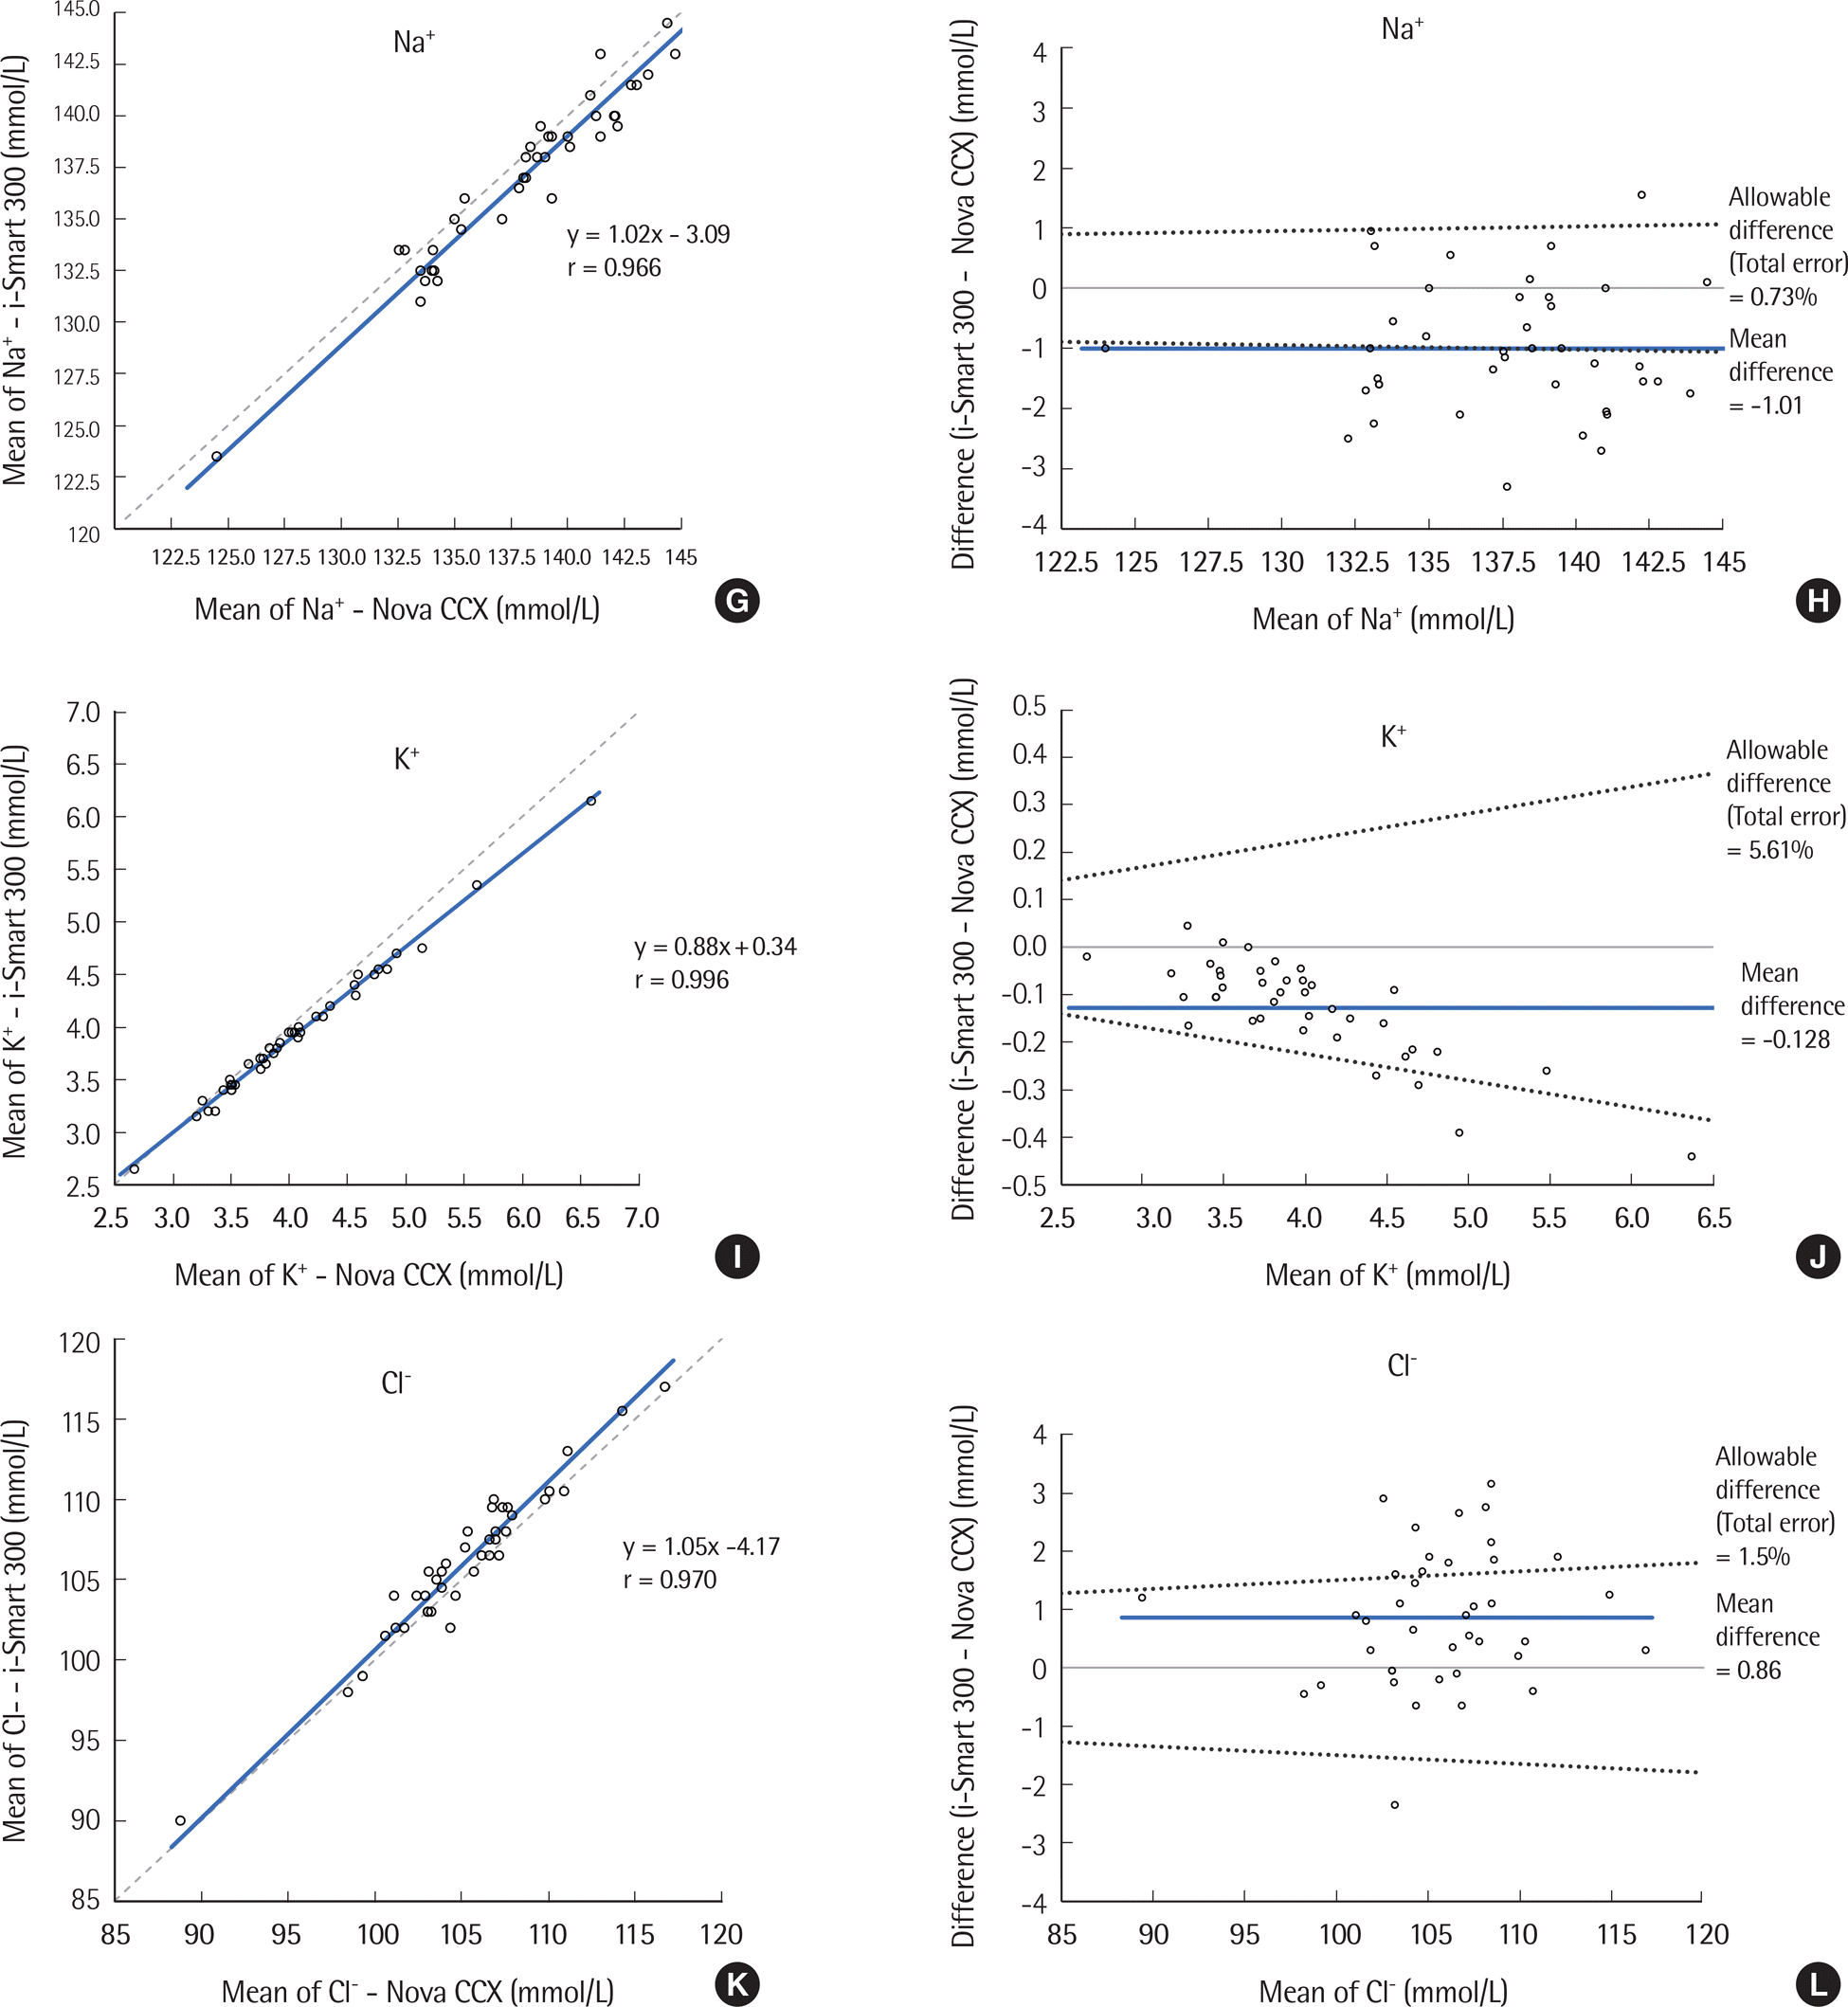
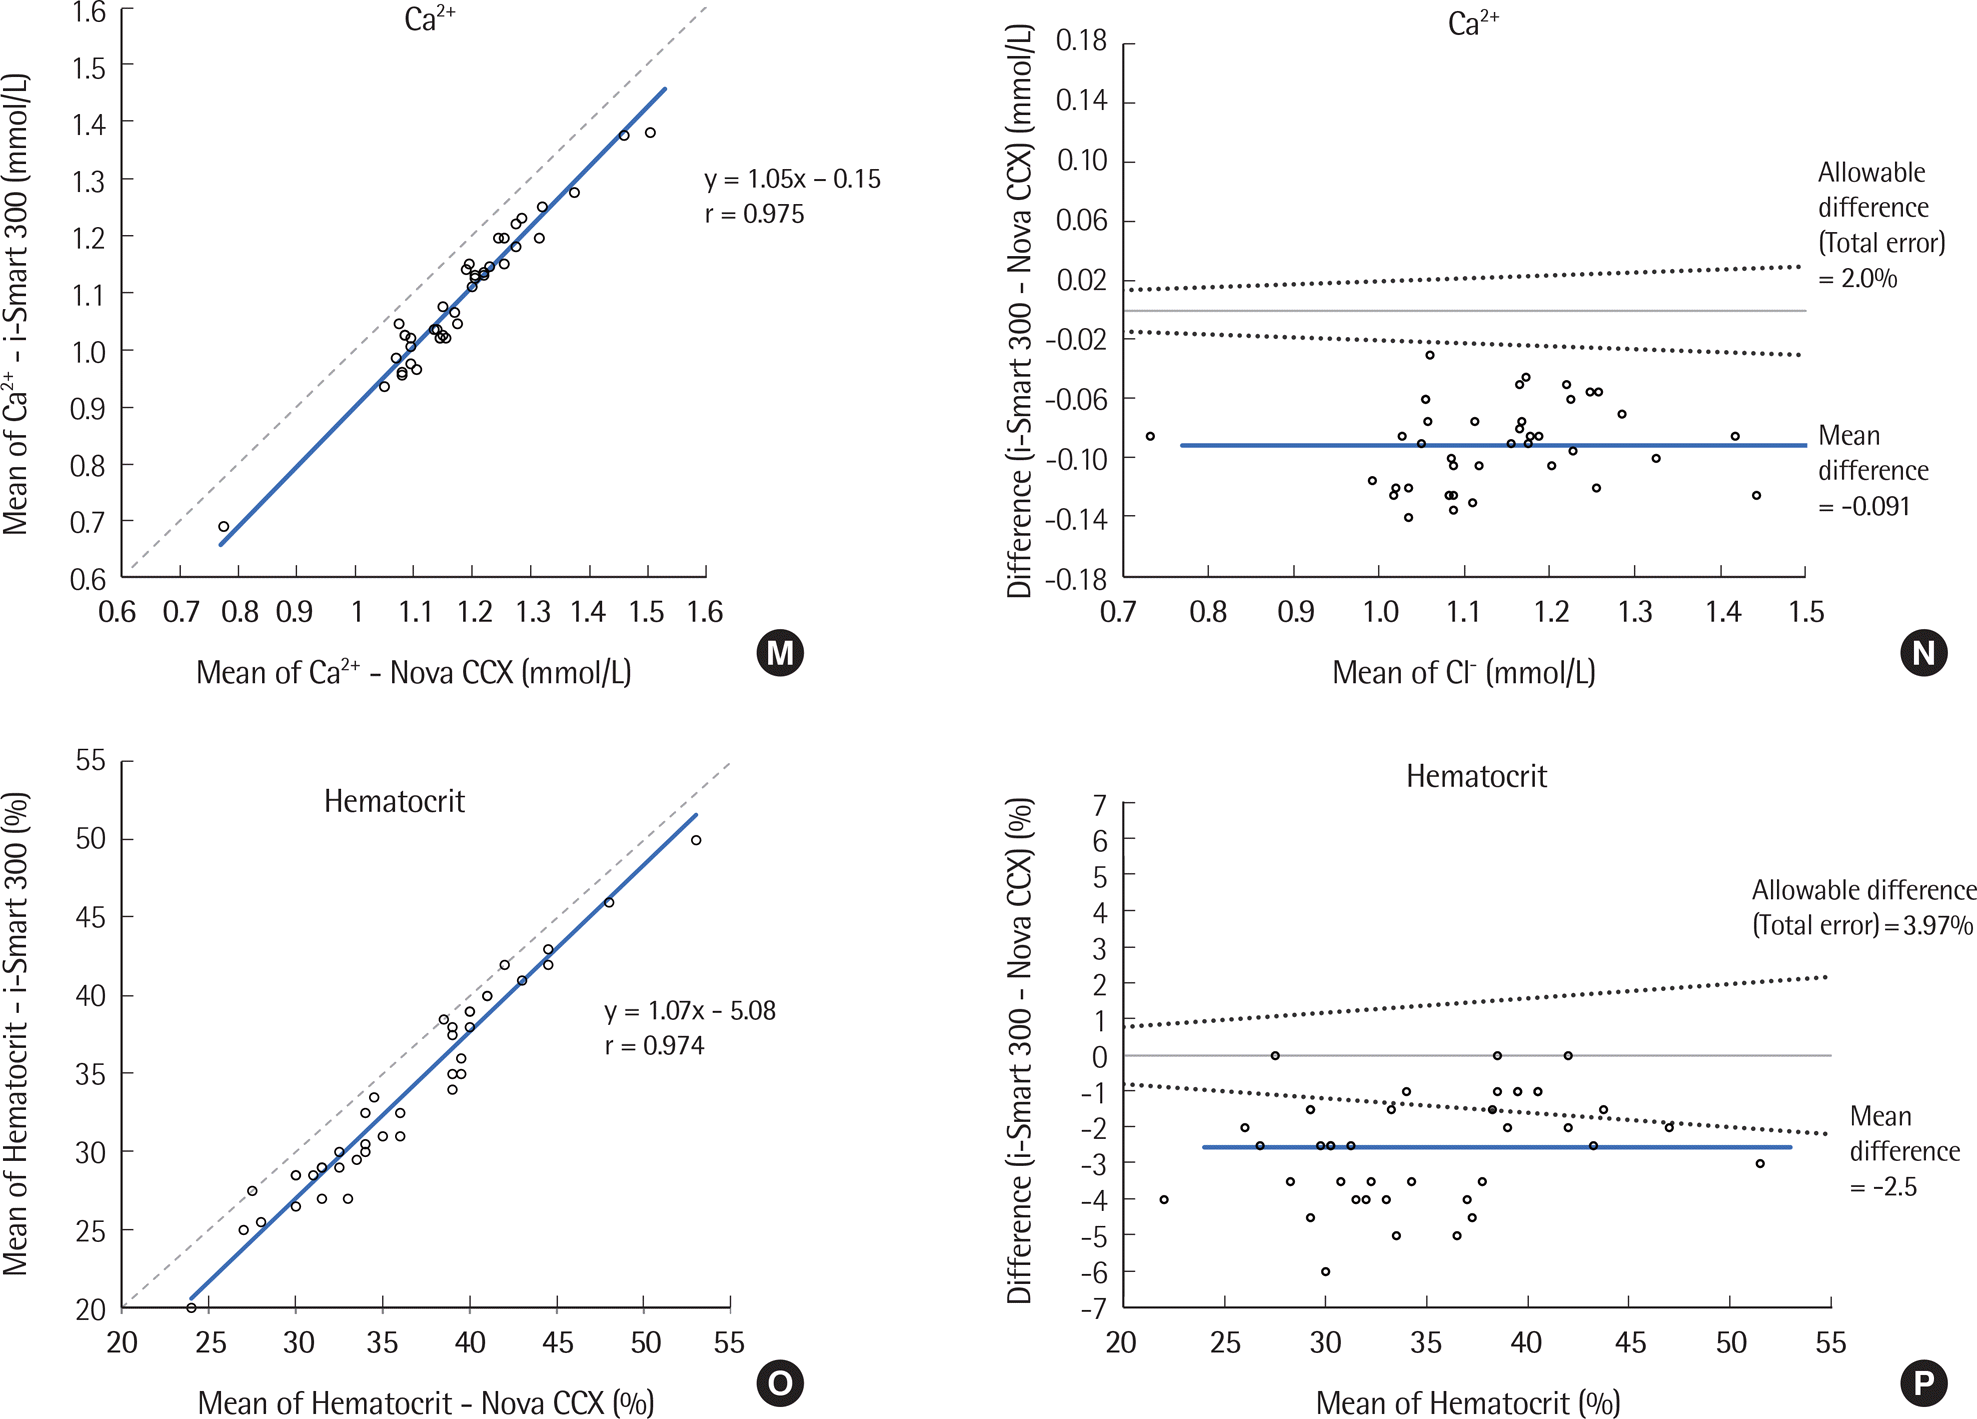
 | Fig. 1.Comparison of pH, pCO2, pO2, Na+, K+, Cl-, Ca2+, and Hematocrit results tested by the i-Smart 300 and STP CCX for 40 samples. (A, C, E, G, I, K, M, O) Correlation between the i-Smart 300 and Nova CCX. Solid line, Passing-Bablok regression; dashed line, identity line. (B, D, F, H, J, L, N, P) Difference between the i-Smart 300 and Nova CCX. Bold line, mean difference between values; dotted lines, desirable specification for allowable total error. |
Table 1.
Evaluation of total precision for blood gas and electrolytes using three levels of control materials on the i-Smart 300 blood gas analyzer, with allowable precision, difference, and total error
| Parameter | Level | Mean | Between-run | Between-day | Within-run | Total-run | CVw∗ | Desirable precision criteria (%)∗ | ||||
|---|---|---|---|---|---|---|---|---|---|---|---|---|
| SD | CV (%) | SD | CV (%) | SD | CV (%) | SD | CV (%) | |||||
| pH | Low | 7.1604 | 0.0020 | 0.03 | 0.0033 | 0.05 | 0.0027 | 0.04 | 0.0047 | 0.07 | 0.2 | 0.1 |
| Medium | 7.4094 | 0.0036 | 0.005 | 0.0000 | 0.00 | 0.0014 | 0.02 | 0.0039 | 0.05 | |||
| High | 7.6433 | 0.0040 | 0.05 | 0.0042 | 0.05 | 0.0020 | 0.03 | 0.0061 | 0.08 | |||
| pCO2 (mmHg) | Low | 18.77 | 0.23 | 1.24 | 0.05 | 0.25 | 0.12 | 0.61 | 0.26 | 1.40 | 4.0 | 2.0 |
| Medium | 39.23 | 0.45 | 1.14 | 0.00 | 0.00 | 0.16 | 0.40 | 0.47 | 1.20 | |||
| High | 66.21 | 0.50 | 0.76 | 0.24 | 0.36 | 0.45 | 0.67 | 0.71 | 1.08 | |||
| pO2 (mmHg) | Low | 70.6 | 1.49 | 2.11 | 0.80 | 1.13 | 1.77 | 2.50 | 2.45 | 3.46 | N/A | N/A |
| Medium | 90.5 | 2.13 | 2.24 | 0.70 | 0.73 | 1.02 | 1.08 | 2.46 | 2.60 | |||
| High | 126.5 | 2.40 | 1.90 | 0.00 | 0.00 | 1.20 | 0.95 | 2.68 | 2.12 | |||
| Na+ (mmol/L) | Low | 113.7 | 0.00 | 0.00 | 0.36 | 0.32 | 0.46 | 0.41 | 0.59 | 0.52 | 0.6 | 0.3 |
| Medium | 132.4 | 0.40 | 0.30 | 0.00 | 0.00 | 0.46 | 0.35 | 0.61 | 0.46 | |||
| High | 154.8 | 0.37 | 0.24 | 0.41 | 0.26 | 0.46 | 0.30 | 0.72 | 0.46 | |||
| K+ (mmol/L) | Low | 2.02 | 0.02 | 0.78 | 0.03 | 1.61 | 0.02 | 1.11 | 0.04 | 2.10 | 4.6 | 2.3 |
| Medium | 4.28 | 0.02 | 0.37 | 0.04 | 0.83 | 0.02 | 0.45 | 0.04 | 1.02 | |||
| High | 5.98 | 0.02 | 0.26 | 0.05 | 0.78 | 0.04 | 0.67 | 0.06 | 1.07 | |||
| Cl- (mmol/L) | Low | 74.9 | 0.32 | 0.42 | 0.14 | 0.19 | 0.35 | 0.47 | 0.50 | 0.66 | 1.2 | 0.6 |
| Medium | 94.4 | 0.37 | 0.39 | 0.14 | 0.15 | 0.46 | 0.49 | 0.61 | 0.64 | |||
| High | 126.0 | 0.58 | 0.46 | 0.58 | 0.46 | 0.40 | 0.32 | 0.92 | 0.73 | |||
| Ca2+ (mmol/L) | Low | 0.577 | 0.004 | 0.07 | 0.007 | 1.26 | 0.004 | 0.73 | 0.009 | 1.61 | 1.7 | 0.9 |
| Medium | 1.163 | 0.009 | 0.79 | 0.004 | 0.35 | 0.006 | 0.48 | 0.011 | 0.99 | |||
| High | 1.474 | 0.006 | 0.39 | 0.014 | 0.97 | 0.008 | 0.53 | 0.017 | 1.17 | |||
| Hematocrit (%) | Low | 27.0 | 0.32 | 1.17 | 0.23 | 0.87 | 0.30 | 1.10 | 0.49 | 1.83 | 2.7 | 1.35 |
| High | 51.6 | 0.39 | 0.75 | 0.23 | 0.44 | 0.37 | 0.72 | 0.58 | 1.13 | |||
It uses a design with 20 testing days, two runs per testing day, and two replicate measurements per run (n=20×2×2=80) for each sample using a single reagent and single calibrator lot, according to the CLSI EP5-A3. Three levels of aqueous quality control (QC) material were used, RNA QC 623 Blood Gas-Electrolyte Control (RNA Medical, Devens, MA, USA), and two levels of RNA QC 900 Hematocrit Control (RNA Medical, Devens, MA, USA) were used.
Table 2.
Evaluation of linearity from eight parameters using five levels of control materials with the i-Smart 300 blood gas analyzer
| Parameter (unit) | Test range | Observed linear range | Manufacturer claimed AMR | Correlation (r) | Regression | % Recovery | P value | |
|---|---|---|---|---|---|---|---|---|
| i-Smart 300 | Nova CCX | |||||||
| pH (pH unit) | 6.867-7.802 | 6.867-7.802 | 6.500-8.000 | 6.500-8.000 | 0.9994 | y=0.9992x+0.0175 | 100.0–100.4 | <0.0001 |
| pCO2 (mmHg) | 12.7-83.7 | 12.7-83.7 | 5.0-150.0 | 3.0-200 | 0.9994 | y=0.9726x+0.3973 | 96.1–99.8 | <0.0001 |
| pO2 (mmHg) | 41.0-462.5 | 69.0-462.5 | 5-700 | 0-800 | 0.9998 | y=0.9959x+2.8820 | 98.6–120.6∗ | <0.0001 |
| Na+ (mmol/L) | 86.0-160.5 | 86.0-160.5 | 80-200 | 80-200 | 0.9998 | y=0.9879x+0.1835 | 98.5–99.4 | <0.0001 |
| K+ (mmol/L) | 1.60-11.30 | 1.60-11.30 | 1.0-20.0 | 1.0-20.0 | 0.9998 | y=1.0150x-0.1078 | 95.0–100.9 | <0.0001 |
| Cl- (mmol/L) | 67.5-130.0 | 67.5-130.0 | 50-150 | 50-200 | 0.9998 | y=1.0200x-1.0100 | 94.3–101.9 | <0.0001 |
| Ca2+ (mmol/L) | 0.265-3.345 | 0.265-3.345 | 0.25-5.00 | 0.1-2.7 | 0.9998 | y=1.0190x-0.0292 | 100.0–101.6 | <0.0001 |
| Hematocrit (%) | 21.5-69.0 | 21.5-69.0 | 10-70 | 12-70 | 0.9998 | y=0.9934x+0.3701 | 100.0–102.4 | <0.0001 |
Table 3.
Comparison of results obtained using the i-Smart 300 and Nova CCX (n=40)
| Parameter | Test range | Correlation (r) (95% CI) | Slope∗ (95% CI) | Intercept∗ (95% CI) | Mean difference† (95% CI) |
|---|---|---|---|---|---|
| pH (pH unit) | 7.067-7.540 | 0.982 (0.967-0.991) | 1.33 (1.25 to 1.40) | -2.36 (-2.94 to -1.79) | 0.0424 (0.0330 to 0.0518) |
| pCO2 (mmHg) | 19.9-77.9 | 0.979 (0.958-0.988) | 0.95 (0.85 to 1.05) | -3.38 (-7.44 to 0.68) | -5.41 (-6.053 to -4.762) |
| pO2 (mmHg) | 37.2-225.8 | 0.993 (0.987-0.996) | 1.08 (1.03 to 1.12) | -3.00 (-8.97 to 2.97) | 5.73 (3.10 to 8.36) |
| Na+ (mmol/L) | 124.5-144.8 | 0.966 (0.936-0.982) | 1.02 (0.93 to 1.10) | -3.09 (-14.24 to 8.06) | -1.01 (-1.36 to 0.66) |
| K+ (mmol/L) | 2.67-6.59 | 0.996 (0.993-0.998) | 0.88 (0.86 to 0.91) | 0.34 (0.23 to 0.45) | -0.128 (-0.161 to -0.095) |
| Cl- (mmol/L) | 88.8-116.7 | 0.970 (0.943-0.984) | 1.05 (0.95 to 1.14) | -4.17 (-14.22 to 5.88) | 0.86 (0.49 to 1.23) |
| Ca2+ (mmol/L) | 0.78-1.51 | 0.975 (0.952-0.987) | 1.05 (0.95 to 1.15) | -0.15 (-0.27 to -0.03) | -0.091 (-0.100 to -0.082) |
| Hematocrit (%) | 24-53 | 0.974 (0.951-0.986) | 1.07 (0.99 to 1.15) | -5.08 (-8.08 to -2.08) | -2.6 (-3.0 to -2.1) |


 PDF
PDF ePub
ePub Citation
 Print
Print


 XML Download