

 PDF
PDF ePub
ePub Citation
 Print
Print


INTRODUCTION
The HbA1c level indicates a patient's average glucose levels for the past 3 months and facilitates the long-term management of blood glucose levels by clinicians [1]. HbA1c levels are highly standardized worldwide owing to the development of reference measurement procedures and primary reference materials. In addition, test results are standardized according to the International Federation of Clinical Chemistry (IFCC) Working Group on HbA1c Standardization and the National Glycohemoglobin Standardization Program (NGSP) HbA1c Harmonization Program [23]. Various studies have reported that immediate feedback on HbA1c levels improves glycemic control in patients with diabetes mellitus (DM) [456]. Furthermore, studies have shown that HbA1c levels and intensive care based on HbA1c monitoring are correlated with the risk of developing DM-associated complications [789].
Among laboratory examination methods, point-of-care (POC) testing is the quickest and most convenient method used by doctors to make clinical decisions [10]. Recently, various HbA1c testing devices for capillary blood or EDTA whole blood have shown positive results [1011121314]. Furthermore, several studies have established the effectiveness of HbA1c monitoring by POC testing for glycemic control and the prevention of complications in patients with DM [1516].
In this study, we evaluated the analytical performance of the cobas b 101 (Roche Diagnostics, Mannheim, Germany) analyzer for estimating HbA1c levels. The cobas b 101 analyzer was compared with the standard central laboratory method, which uses the Variant II Turbo instrument.
MATERIALS AND METHODS
1. Study design
This study was performed from July to November 2015 in the Department of Laboratory Medicine at our institute. All analyses were reviewed and approved by the Institutional Review Board (IRB) at our institute (KBSMC 2015-01-049). Patient samples were obtained from residual EDTA samples or from EDTA and capillary samples collected immediately before the test. All participants provided written informed consent prior to blood collection. EDTA whole blood specimens were taken from the antecubital vein after at least 8 hours of fasting and analyzed promptly within 1 hour. Simultaneously, capillary blood collection was performed by finger pricking to obtain 2 µL of whole blood. Participant data were subjected to a de-identification process and coded with serial numbers for the test.
2. Precision and linearity
Repeatability and within-laboratory precision were determined using two quality control (QC) materials with different HbA1c levels, supplied by the manufacturer of the cobas HbA1c control. Both QC materials were assayed in duplicate twice daily at 9 am and 3 pm for a total of 20 days according to the 2014 Clinical and Laboratory Standards Institute (CLSI) guideline EP05-A3 [17]. The linearity of the assay was evaluated for specimens with five different HbA1c levels with duplication by mixing venous EDTA blood samples from two patients according to the CLSI guideline EP06-A [18].
3. Lot-to-lot reproducibility
The lot-to-lot reproducibility was evaluated using two different HbA1c disk lots (#434022-01 and #435021-01), and 20 residual venous EDTA blood samples treated in the same manner by the same user were evaluated for 5 days, with 4 samples evaluated in duplicate each day. The test results for 20 samples using the first lot were in the range of 5.2–8.9% HbA1c.
4. Comparative analysis
Linear regression and %differences in estimated HbA1c levels between the cobas b 101 and Variant II Turbo were determined according to the 2013 CLSI guideline EP09-A3 protocol [19]. Two types of blood specimens were obtained immediately before the tests from the 40 enrolled participants: capillary blood and EDTA whole blood. The capillary finger prick samples and EDTA whole blood samples were analyzed using the cobas b 101 POC system in the phlebotomy room and the EDTA whole blood samples were analyzed using the Variant II Turbo in the central laboratory. The HbA1c levels of samples spanned the clinically relevant range of 4.8% to 8.6%.
5. Laboratory method
HbA1c was measured at the central laboratory of our hospital using the Variant II Turbo (Bio-Rad Laboratories, Hercules, CA, USA), which is based on high-performance liquid chromatography (HPLC). The HbA1c program of the reference device was certified by the NGSP with documented traceability to the Diabetes Control and Complications Trial (DCCT) reference method. This test participated in the quality assurance survey from the College of American Pathologists (CAP), and all five of the challenges were within the acceptable range, with a mean bias of 0.06% for HbA1c levels. QC materials with low (5.10±0.2%) and high (9.80±0.2%) levels were used. The coefficient of variation was 0.96–3.03% for the low-HbA1c QC materials and 1.18–2.90% for the high-HbA1c QC materials during the study period.
6. POC analyzer methods
The cobas b 101 POC analyzer (Roche Diagnostics) is based on a photometric transmission measurement method using a latex agglutination inhibition immunoassay. The test uses 2 µL of EDTA venous whole blood or 2 µL of capillary whole blood. The POC devices were designed to operate with ready-to-use HbA1c disks and provide results in 340 seconds. This device can measure HbA1c levels in the 4–14% range. The test method was certified by the NGSP and standardized or traceable to the DCCT reference assay. HbA1c values obtained using both devices are expressed in NGSP units as % HbA1c.
7. Statistical analysis
Test imprecision was analyzed based on repeatability and within-laboratory precision. Each formula was obtained from EP05-A3 [17]. The lot-to-lot reproducibility and comparative results were evaluated based on Pearson's correlation coefficients (r). The results are displayed in scatter plots. %Differences between each POC test result and the reference method were analyzed by calculating the percentage of HbA1c reporting unit differences and a Bland-Altman plot was generated. The acceptable standard was a difference of ±6% according to the HbA1c acceptable limit established by NGSP, which was applied in the CAP GH2 survey [20]. All statistical analyses were implemented in Microsoft Excel 2010 and IBM SPSS version 18.0 (IBM, New York, NY, USA) and statistical significance was defined as P<0.05.
RESULTS
1. Precision and linearity
Imprecision was analyzed using QC materials with two levels of HbA1c for 20 days; the mean levels were 5.1% (normal) and 9.5% (pathological). The standard deviation (SD) and coefficient of variation (CV) were 0.25% and 4.83% for repeatability and 0.27% and 5.22% for within-laboratory precision tests for the normal level, and 0.21% and 2.22% for repeatability and 0.24% and 2.56% for within-laboratory precision for the pathological level, respectively (Table 1). This method showed good linearity between HbA1c levels of 4.6% and 13.3%. The estimated slope and intercept of the regression were 1.014 and 0.392, respectively, with a coefficient of correlation of 0.990.
2. Lot-to-lot reproducibility
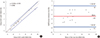
The lot-to-lot reproducibility for cobas b 101 HbA1c test results using two different lots is shown in Fig. 1A (r=0.986, P<0.001). The mean %difference was −2.9% (range −8.7% to 0.0%) (Fig. 1B). For the first lot, there was a strong correlation between the results obtained using the cobas b 101 and Variant II Turbo; the estimated coefficient of correlation and %difference were 0.983 (P<0.001) and −1.5% (range −8.6% to 2.6%), respectively. For the second lot, there was also a strong correlation between the results obtained using the cobas b 101 and the Variant II Turbo, with a correlation coefficient of 0.985 (P<0.001) and a %difference of 1.7% (range −5.0% to 5.8%). The slope and the intercept of the regression for the two lots using the central laboratory method were 0.905 and 0.525 for the first lot and 0.834 and 0.539 for the second lot.
3. Comparative analysis
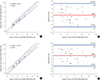
The regression of the estimates obtained using the cobas b 101 HbA1c and Variant II Turbo using EDTA whole blood showed a slope of 0.946 and an intercept of 0.374. On the scatter plot, the graph showed a strong correlation, with a correlation coefficient of 0.958 (P<0.001; Fig. 2A). The mean %difference was 0.8% (range −5.4% to 5.9%) and tended to be more highly dispersed at the higher HbA1c level (Fig. 2B). No specimen exceeded a 6% %difference.
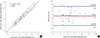
When comparing the cobas b 101 analyzer results using capillary blood and the Variant II Turbo results using EDTA whole blood, a regression line with a slope of 0.991 and intercept of 0.179 was obtained. On the scatter plot, the graph showed a strong correlation, with a correlation coefficient of 0.976 (P<0.001; Fig. 2C). The mean %difference was 2.0% (range −4.8% to 6.8%) (Fig. 2D). Moreover, a strong correlation was observed between EDTA whole blood and capillary HbA1c levels, with a correlation coefficient of 0.985, using the cobas b 101 system (P<0.001; Fig. 3A). The mean %difference was 1.3% (range −5.5% to 7.7%) (Fig. 3B). Table 2 contains all results for the reproducibility and comparative analyses, indicating the expected device or lot value (Y) when the other device or lot (X) had a 6.5% HbA1c level.
DISCUSSION
Venous blood sampling is currently the gold standard for the assessment of blood glucose levels. However, this sampling method cannot be applied to home-based glucose self-monitoring. Capillary blood glucose testing using portable POC devices has been hailed as an alternative method to venous blood sampling owing to its better compliance, rapid reporting of test results, low cost, and potential for self-monitoring [21]. Nonetheless, there are some doubts regarding its diagnostic accuracy compared to that of venous blood sampling, and a recent study has shown that many current POC HbA1c devices do not meet the analytical requirements stipulated by the NGSP [222].
Current HbA1c POC devices have shown good performance in some recent studies designed to compare the validity of capillary blood glucose and venous blood glucose testing [1011121314]. In our study, we not only evaluated POC device performance for EDTA whole blood glucose, but also compared HbA1c levels using EDTA whole blood and capillary blood as samples determined by the cobas b 101 assay to evaluate its clinical efficiency.
The NGSP has tightened the criteria several times for the certification of manufacturer methods, with the goal of improving the quality of HbA1c testing. The performance threshold for manufacturers is ±6% with respect to the relative bias of the Secondary Reference Laboratory measurements [23]. Similarly, the CAP replaced peer-group grading of the HbA1c level for the GH-2 HbA1c survey with accuracy-based grading, and has since tightened the acceptable performance limits from ±15% to ±7% in 2011–2012 and ±6% in 2013–2016 [2425]. The performance of POC tests for the determination of HbA1c levels is generally assessed based on precision; it is recommended that an imprecision of less than 3% is a desirable analytical goal for laboratory HbA1c methods based on clinical requirements, and an optimal imprecision of 2% NGSP units is now recommended by leading professional groups [226]. In this study, the cobas b 101 analyzer showed good precision at the pathological level according to the desired analytical goal, but did not meet the optimal imprecision goal. At the normal level, the within-laboratory precision did not meet the goal. Therefore, this test was considered acceptable for follow-up monitoring of HbA1c at the 7.0% HbA1c treatment goal recommended by the American Diabetes Association Standards of Medical Care in Diabetes 2017 [27]. Overall comparative analyses showed a strong correlation and all of the mean %differences were within 6%.
In a previous study, the cobas b 101 showed an acceptable imprecision result in an evaluation of seven HbA1c POC devices using patient venous blood samples [14]. Two different reagent lot numbers for the cobas b 101 met the NGSP criteria, with an intra-laboratory precision of 2.4% and 1.2% (CVs) and −0.05%–0.23% bias with three certified secondary reference measurement procedures, indicating good performance compared to that of the other six POC instruments.
Although the cobas b 101 showed promising results, this study had a few limitations. We could not evaluate a broad range of HbA1c levels owing to a lack of patient samples with extremely low or high levels. In the repeatability and within-laboratory precision studies for the cobas b 101 POC device, the 5.1% level for QC materials did not fully represent the diagnostic performance for a diabetes cutoff HbA1c level of 6.5%. We did not exclude interference from hemoglobin variants because we could not obtain fresh specimens with hemoglobinopathies, which have the potential to impact the HbA1c results.
In conclusion, comparative analyses with the reference method using the Variant II Turbo and the POC test using the cobas b 101 showed strong correlations using EDTA whole blood samples in our study. Moreover, our findings demonstrated a strong correlation between HbA1c levels obtained using EDTA whole blood and capillary samples in the cobas b 101 assay. However, exhaustive precision analyses are necessary before clinical use. Therefore, the cobas b 101 analyzer is a convenient assay for HbA1c levels and may be useful for diabetes management.


 XML Download