Abstract
Background
Methods
Results
REFERENCES
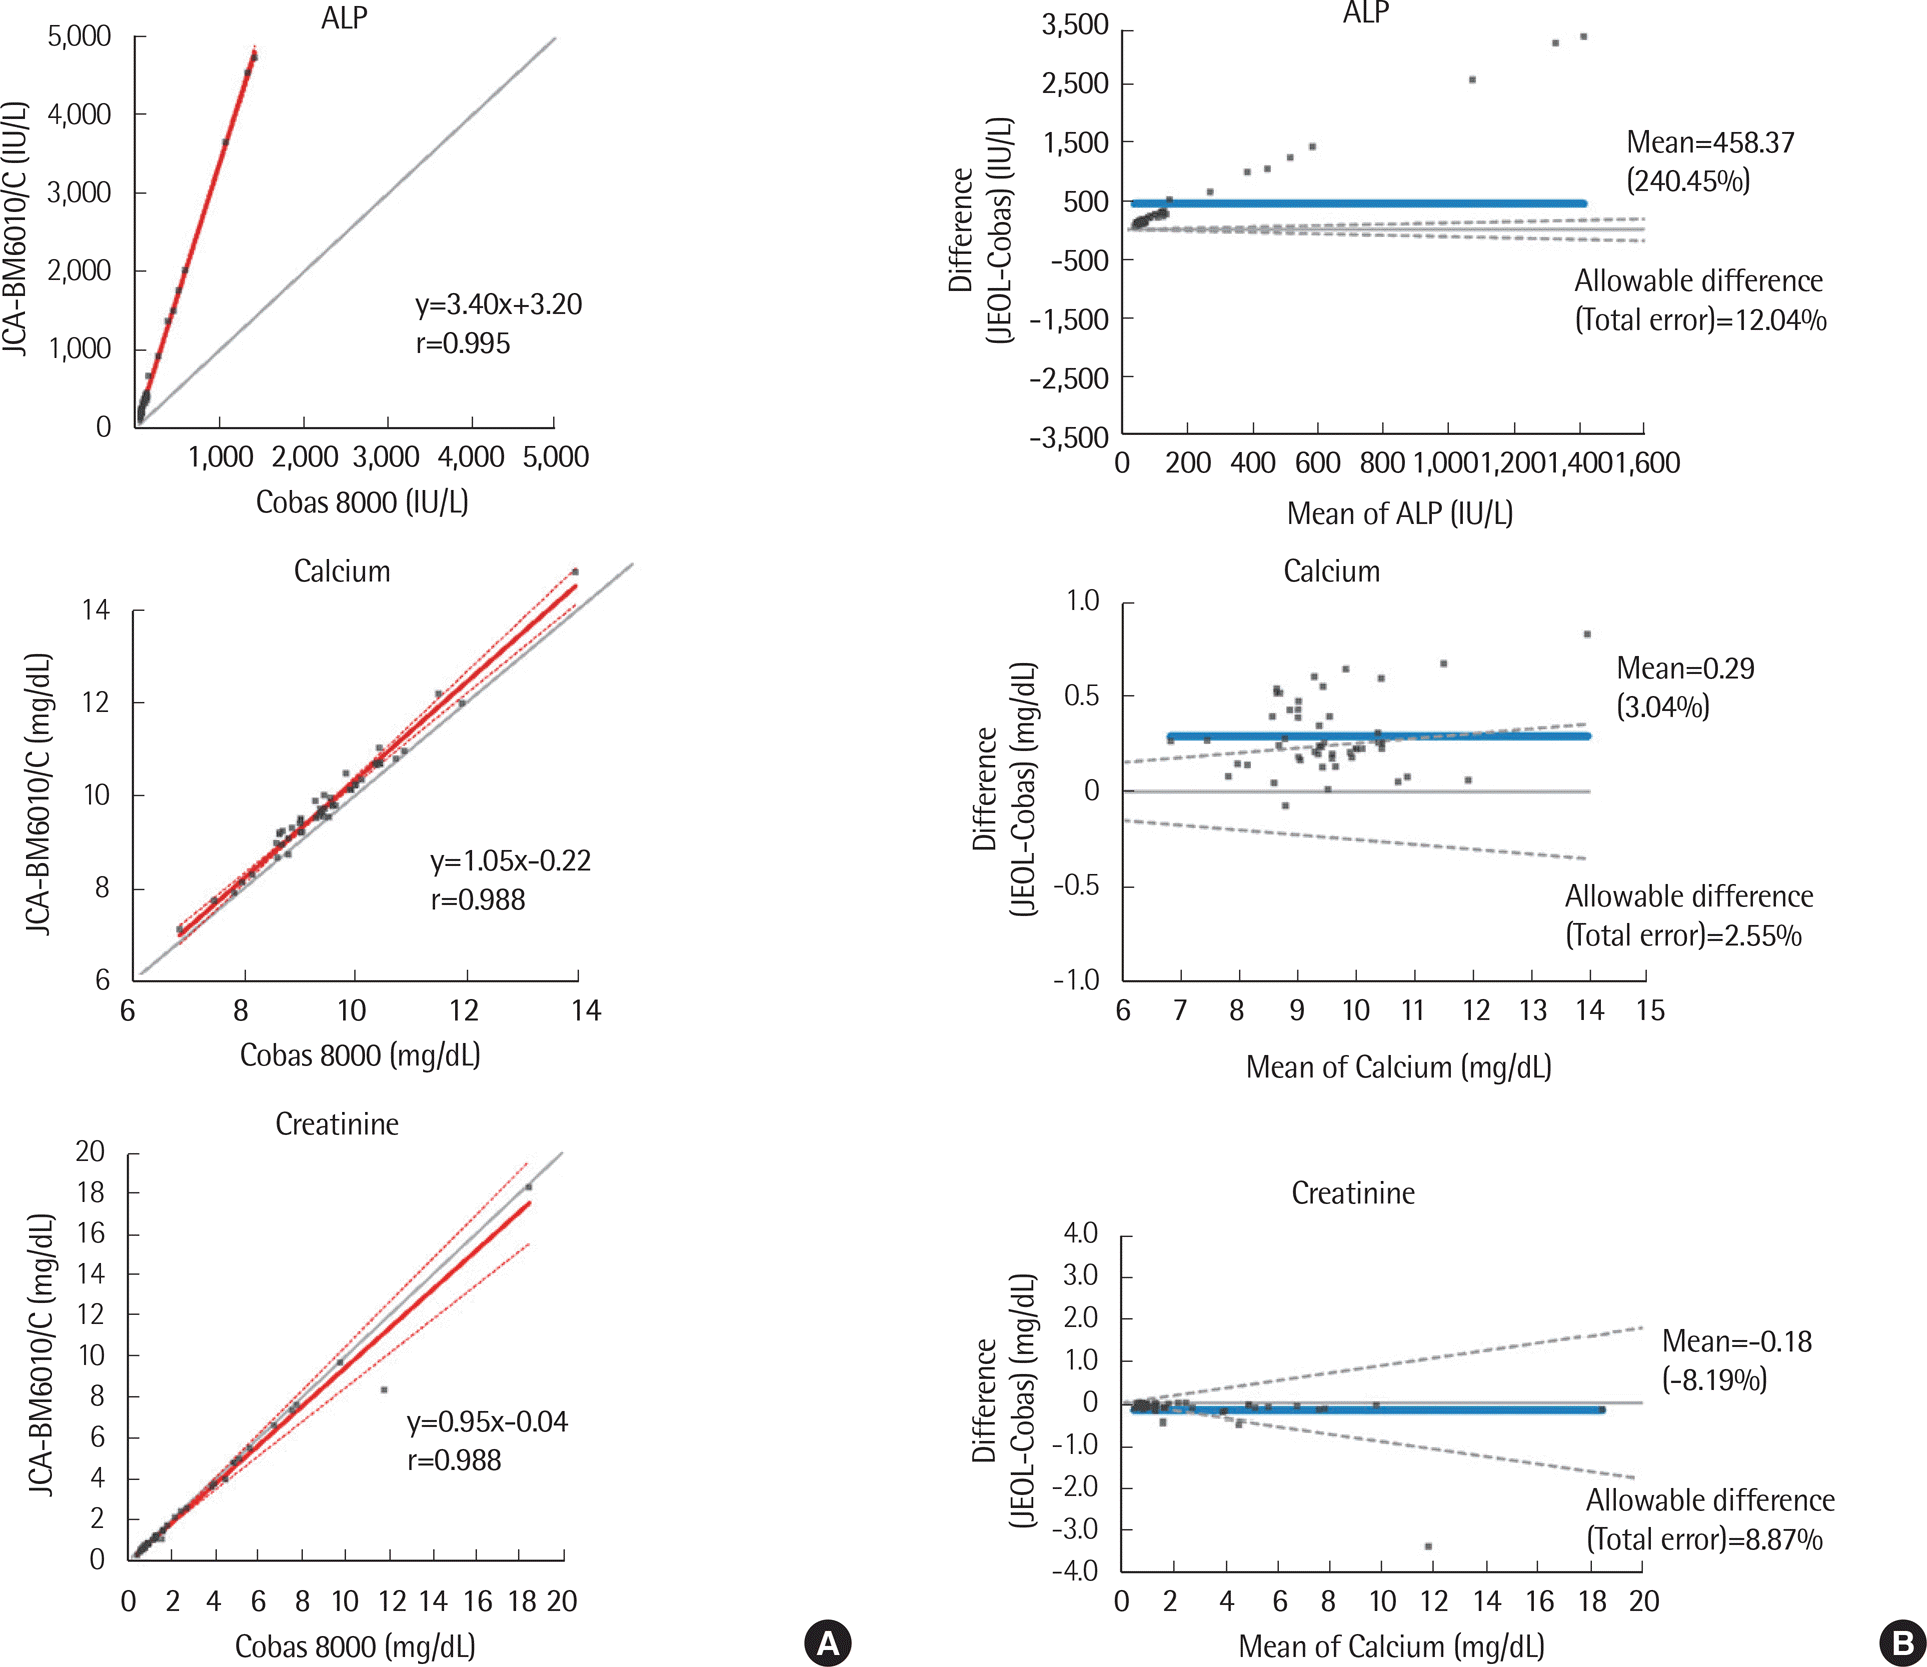
Fig. 1.

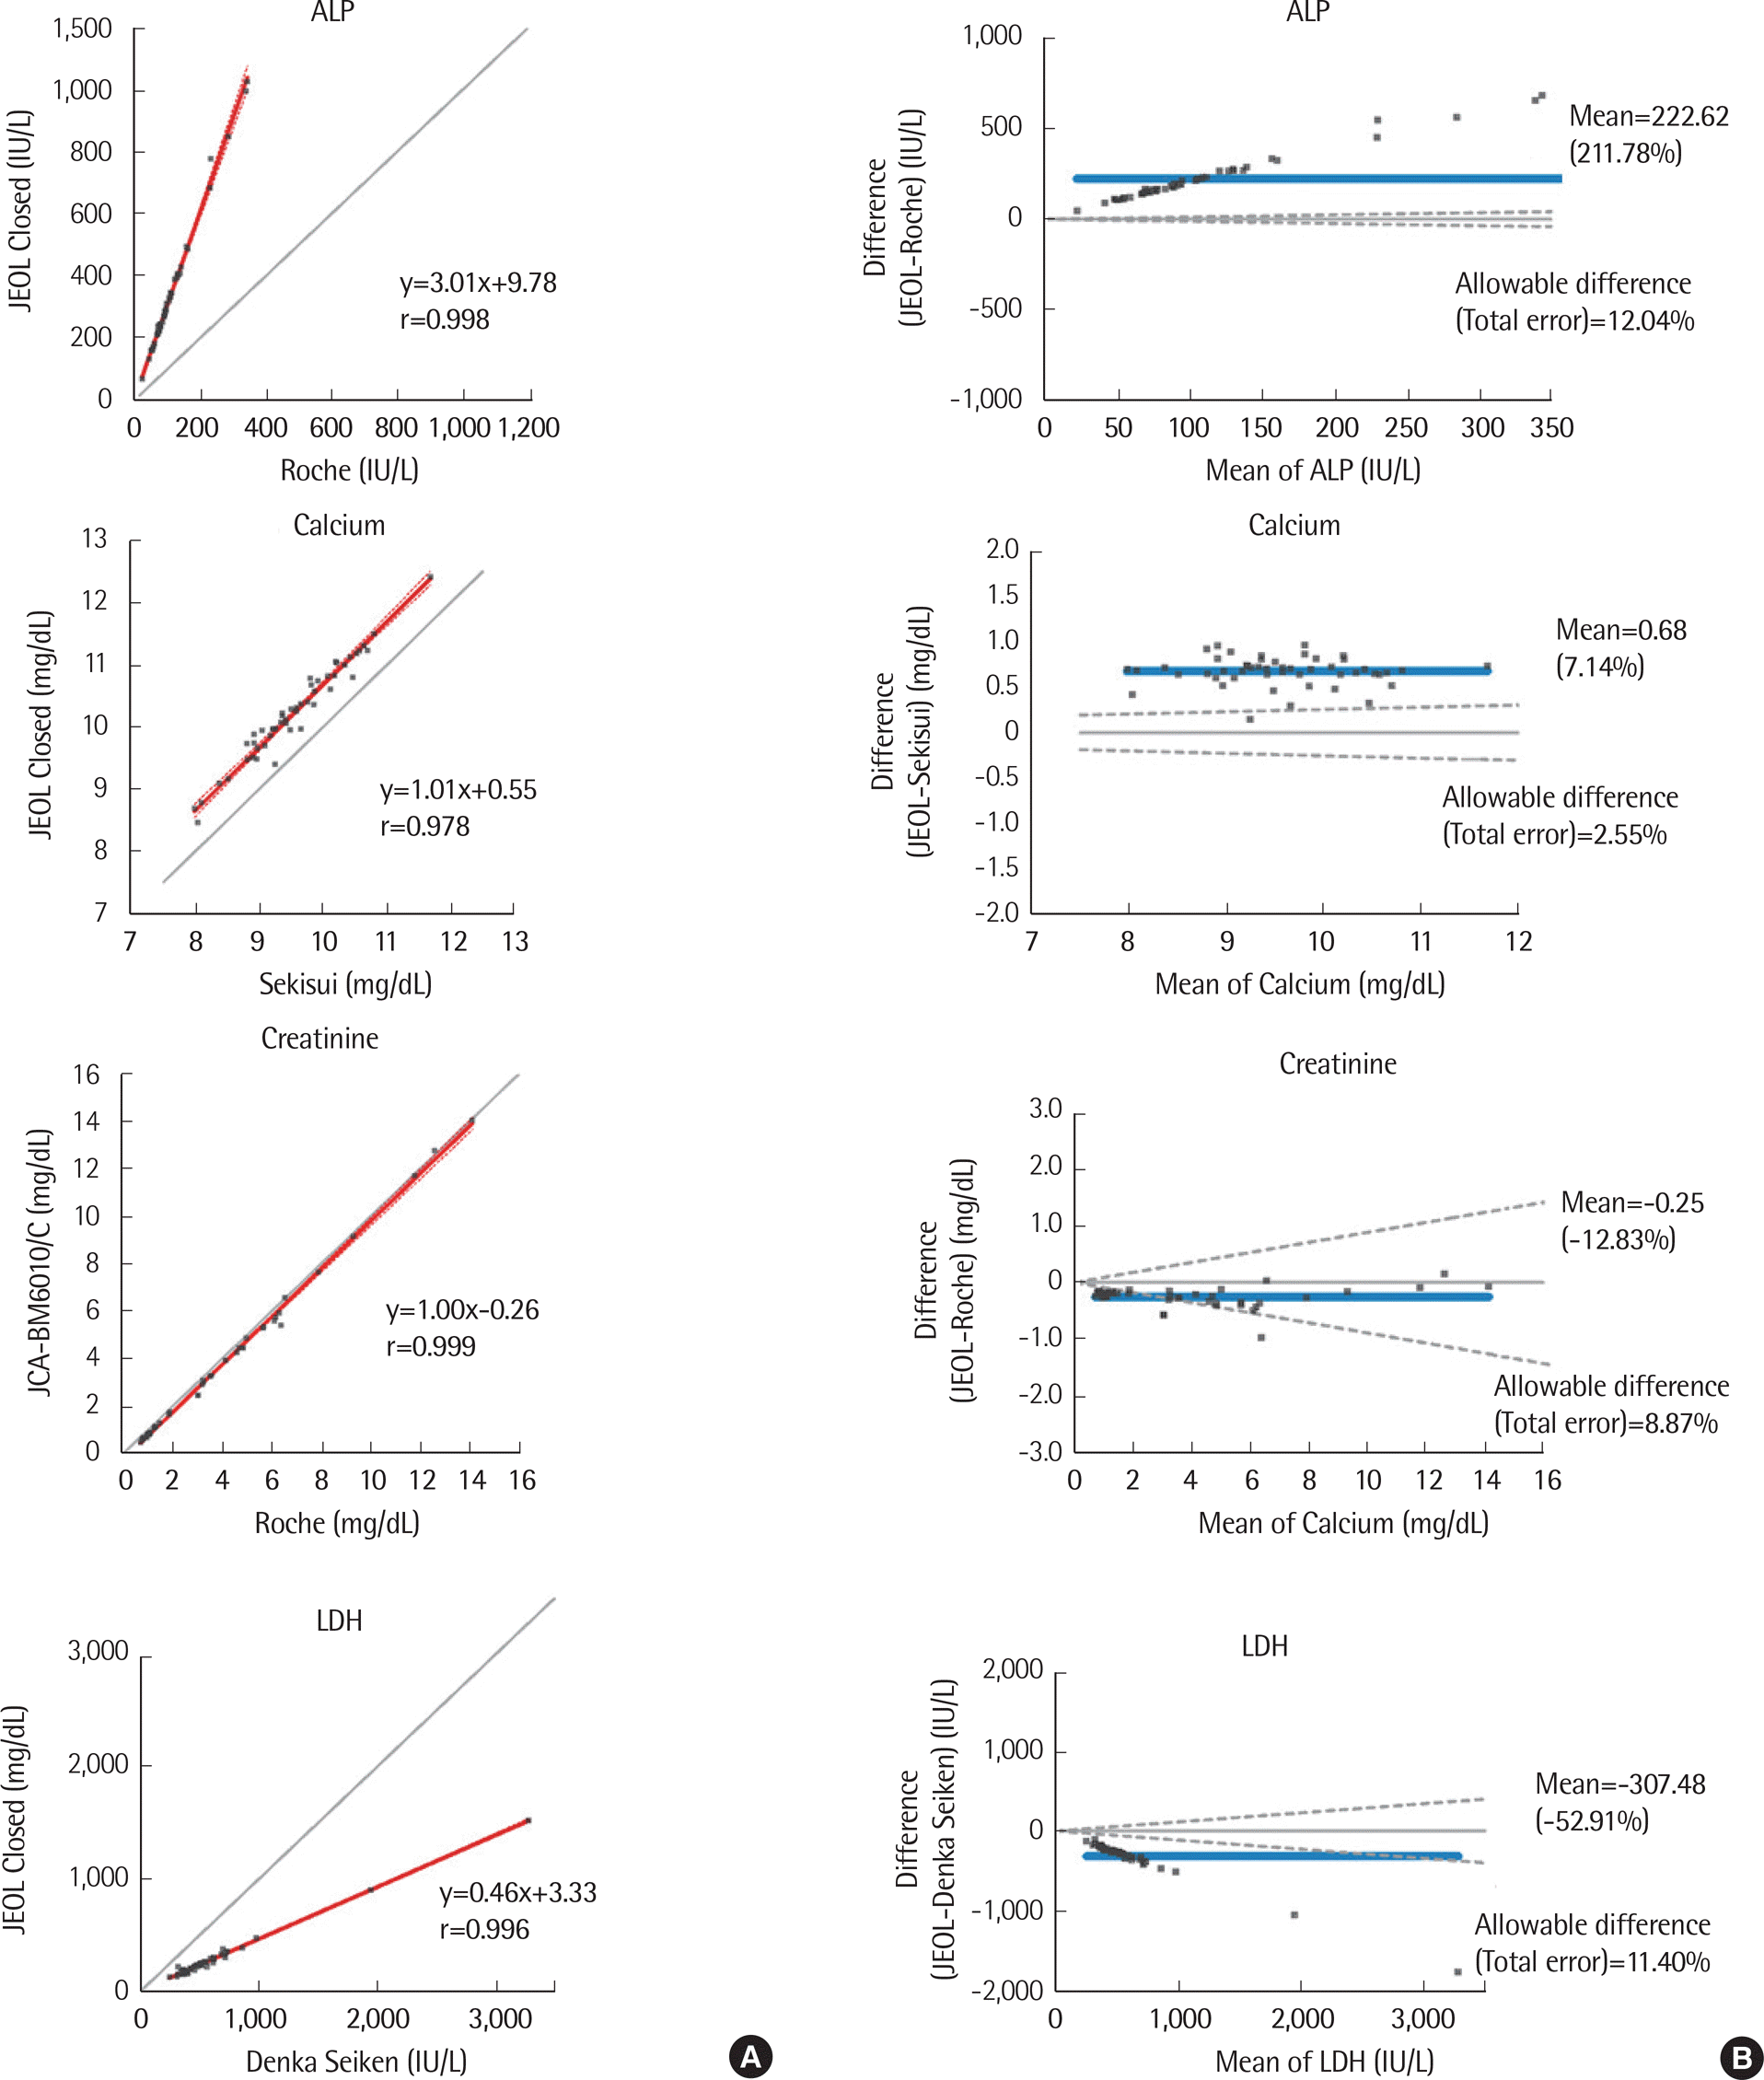
Fig. 2.

Table 1.
| Analytes | Level | Mean concentration | CV (%) | Desirable precision criteria (%)† | Roche total CV‡ (%) | Beckman total CV§ (%) | CVw† (%) | |||
|---|---|---|---|---|---|---|---|---|---|---|
| Repeatability | Between-run | Between-day | Total | |||||||
| ALP (IU/L) | Low | 95.1 | 0.7 | 0.7 | 1.2 | 1.5 | 3.2 | 3.0 | 2.0 | 6.5 |
| High | 603.7 | 0.9 | 0.3 | 2.2 | 2.4 | 2.5 | 1.8 | |||
| ALT (IU/L) | Low | 25.0 | 2.1 | 1.6 | 0.6 | 2.7 | 9.7 | 3.6 | 2.7 | 19.4 |
| High | 190.6 | 0.8 | 0.0 | 1.7 | 1.9 | 1.6 | 1.8 | |||
| AST (IU/L) | Low | 42.5 | 0.7 | 0.5 | 1.1 | 1.4 | 6.2 | 1.5 | 1.9 | 12.3 |
| High | 250.9 | 0.7 | 0.3 | 0.8 | 1.1 | 3.5 | 1.4 | |||
| Calcium (mg/dL) | Low | 6.1 | 1.1 | 0.6 | 0.8 | 1.5 | 1.1 | 1.5 | 1.2 | 2.1 |
| High | 13.6 | 0.8 | 0.0 | 0.9 | 1.2 | 1.4 | 1.2 | |||
| Creatinine (mg/dL) | Low | 0.7 | 0.9 | 0.5 | 1.1 | 1.5 | 3.0 | 3.0 | 3.0 | 6.0 |
| High | 7.0 | 0.8 | 0.4 | 0.6 | 1.1 | 2.4 | 1.9 | |||
| GGT (IU/L) | Low | 30.1 | 1.6 | 1.2 | 0.8 | 2.1 | 6.7 | 2.1 | 1.3 | 13.4 |
| High | 141.3 | 0.6 | 0.3 | 0.7 | 1.0 | 1.1 | 0.8 | |||
| Glucose (mg/dL) | Low | 62.4 | 0.9 | 0.7 | 0.8 | 1.4 | 2.8 | 1.3 | 1.4 | 5.6 |
| High | 360.2 | 0.9 | 0.5 | 1.0 | 1.4 | 1.3 | 1.4 | |||
| LDH (IU/L) | Low | 111.2 | 0.7 | 0.3 | 1.8 | 2.0 | 4.3 | 1.5 | 1.9 | 8.6 |
| High | 374.6 | 0.7 | 0.3 | 1.4 | 1.6 | 1.6 | 1.5 | |||
| Total bilirubin (mg/dL) | Low | 0.6 | 1.7 | 1.0 | 1.2 | 2.3 | 10.9 | 3.3 | 1.1 | 21.8 |
| High | 6.4 | 0.8 | 0.5 | 1.6 | 1.8 | 1.8 | 1.0 | |||
| Total protein (g/dL) | Low | 3.9 | 0.6 | 0.3 | 0.8 | 1.0 | 1.4 | 1.2 | 1.1 | 2.8 |
| High | 6.8 | 0.5 | 0.7 | 0.9 | 1.3 | 1.6 | 1.1 | |||
| Uric acid (mg/dL) | Low | 3.4 | 0.8 | 1.0 | 1.5 | 1.7 | 4.3 | 1.2 | 1.6 | 8.6 |
| High | 9.7 | 0.8 | 0.3 | 0.9 | 1.2 | 1.2 | 1.5 | |||
∗ Liquid Assayed Multiqual (human serum based) Level 1 and Level 2 (Bio-Rad Laboratories Inc., Hercules, CA, USA);
† Within-subject biological variation and desirable analytical precision criteria are referred from the biological variation database specification on the Westgard web site (http://www.westgard.com/biodatabase1.htm) [4];
§ Total CV of Beckman Coulter AU5822 automated clinical chemistry analyzer [6]. Abbreviations: ALP, alkaline phosphatase; ALT, alanine transaminase; AST, aspartate aminotransferase; CV, coefficient of variation; CVw, within-subject biologic variation; GGT, gamma-glutamyl transferase; LDH, lactate dehydrogenase.
Table 2.
| Analytes | Linear range specified by the serum specimen manufacturer | Test range | Observed linear range | Slope | Intercept | R2 | Recovery (%) |
|---|---|---|---|---|---|---|---|
| ALP (IU/L) | 10-6,500 | 0.0-8,868.5 | 0.0-8,868.5 | 0.94 | 26.11 | 0.999 | 93-100 |
| ALT (IU/L)† | 8-2,200 | 0.1-2,306.0 | 0.1-2,306.0 | 0.94 | 19.01 | 0.999 | 100-104 |
| AST (IU/L)† | 6-1,500 | 0.7-1,463.3 | 0.7-1,463.3 | 0.94 | 18.73 | 0.999 | 93-100 |
| Calcium (mg/dL) | 2.0-25.0 | 0.1-26.0 | 0.1-26.0 | 1.00 | 0.02 | 0.999 | 99-101 |
| Creatinine (mg/dL) | 0.5-45.0 | 0.2-35.9 | 0.2-35.9 | 1.00 | 0.03 | 1.000 | 100-109 |
| GGT (IU/L)† | 8-4,000 | 1.1 -3,684.0 | 1.1 -3,684.0 | 0.91 | 20.30 | 0.999 | 90-100 |
| Glucose (mg/dL) | 15-850 | 6.9-690.0 | 6.9-690.0 | 0.96 | 7.11 | 0.998 | 77-101 |
| Lactate dehydrogenase (IU/L) | 12-3,000 | 0.0-3,966.5 | 0.0-3,966.5 | 0.93 | 23.44 | 0.999 | 93-100 |
| Total bilirubin (mg/dL) | 0.2 -27.0 | 0.1-29.1 | 0.1-29.1 | 1.04 | -0.10 | 0.999 | 96-104 |
| Total protein (g/dL) | up to 14 g/dL | 0.6-14.7 | 0.6-14.7 | 0.96 | 0.14 | 0.999 | 96-100 |
| Uric acid (mg/dL) | 1.0-75.0 | 1.9-29.6 | 1.9-29.6 | 1.01 | -0.08 | 0.999 | 100-101 |
† ALT, AST, and GGT were also evaluated using the Sekisui open reagent. Specified linear ranges by the Sekisui were as follows: ALT (0.0–1,500.0, IU/L), AST (0.0–1,500.0, IU/L), GGT (0.0–2,000.0, IU/L). Test ranges and observed linear ranges were as follows: ALT (0.0–1,816.8, 0.0–1,816.8, IU/L), AST (0.6–1,697.9, 0.6–1,697.9, IU/L), GGT (0.0–1,628.0, 0.0–1,628.0, IU/L). Abbreviations: ALP, alkaline phosphatase; ALT, alanine transaminase; AST, aspartate aminotransferase; GGT, gamma-glutamyl transferase.
Table 3.
| Analytes | Test range | Correlation coefficient (r)† (95% CI) | Slope‡ (95% CI) | Intercept‡ (95% CI) | Mean difference (95% CI) |
|---|---|---|---|---|---|
| ALP | 38.3-1418.3 | 0.999 (0.999-1.000) | 3.40 (3.34-3.47) | 3.20 (-10.8-17.2) | 458.4 (242.7-674.0) |
| ALT | 1.8-209.1 | 0.995 (0.991-0.997) | 1.16 (1.07-1.26) | 0.70 (-1.36-2.77) | 5.6 (3.0-8.2) |
| AST | 6.7-445.9 | 0.999 (0.999-1.000) | 1.08 (1.06-1.11) | -0.31 (-1.28-0.66) | 5.1 (2.5-7.6) |
| Calcium | 6.8-14.1 | 0.988 (0.978-0.993) | 1.05 (0.97-1.14) | -0.22 (-0.97-0.54) | 0.3 (0.2-0.3) |
| Creatinine | 0.5-18.7 | 0.991 (0.984-0.995) | 0.95 (0.83-1.07) | -0.04 (-0.24-0.16) | -0.2 (-0.3-0.0) |
| GGT | 6.9-1893.3 | 0.999 (0.998-1.000) | 1.05 (0.98-1.13) | 9.96 (1.99-17.92) | 18.9 (12.0-25.9) |
| Glucose | 64.8-460.1 | 0.999 (0.999-1.000) | 0.99 (0.98-1.00) | 1.86 (0.39-3.33) | -0.5 (-1.5-0.4) |
| LDH | 57.6-1049.5 | 0.963 (0.937-0.979) | 1.04 (0.96-1.13) | 7.65 (-18.54-33.84) | 18.7 (5.2-32.2) |
| Total bilirubin | 0.1-22.4 | 0.998 (0.997-0.999) | 0.98 (0.91-1.05) | -0.01 (-0.10-0.09) | -0.1 (-0.1-0.0) |
| Total protein | 3.5-9.5 | 0.995 (0.991-0.997) | 1.00 (0.97-1.04) | -0.17 (-0.40-0.07) | -0.1 (-0.2-0.10) |
| Uric acid | 0.4-14.9 | 0.999 (0.999-1.000) | 1.00 (0.99-1.01) | 0.03 (-0.01-0.08) | 0.1 (0.0-0.1) |
Table 4.
| Analytes | Manufacturer of reagents | Test range | Correlation coefficient (r)† (95% CI) | Slope‡ (95% CI) | Intercept‡ (95% CI) | Mean difference (95% CI) (Open reagent-JEOL closed reagent) |
|---|---|---|---|---|---|---|
| ALP | Roche | 21.7-343.1 | 0.998 (0.996-0.999) | 3.01 (2.86-3.15) | 9.78 (-1.90-21.45) | 222.6 (183.4-261.8) |
| ALT | Sekisui | 2.5-131.2 | 0.999 (0.998-0.999) | 1.02 (1.01-1.03) | -3.41 (-3.85–2.97) | -3.0 (-3.3–2.7) |
| AST | Roche | 7.0-134.6 | 0.999 (0.999-1.000) | 0.99 (0.97-1.00) | -0.41 (-0.85-0.03) | -0.8 (-1.1–0.6) |
| Calcium | Sekisui | 8.0-11.7 | 0.978 (0.962-0.988) | 1.01 (0.96-1.07) | 0.55 (0.03-1.07) | 0.7 (0.6-0.7) |
| Creatinine | Roche | 0.7-14.1 | 0.999 (0.998-0.999) | 1.00 (0.98-1.02) | -0.26 (-0.31–0.20) | -0.3 (-0.3–0.2) |
| GGT | Sekisui | 13.0-535.2 | 0.999 (0.999-1.000) | 0.95 (0.93-0.97) | 2.09 (1.39-2.79) | -0.9 (-2.4-0.6) |
| Glucose | Denka Seiken | 35.0-436.5 | 0.999 (0.999-1.000) | 1.00 (0.99-1.01) | 0.05 (-0.82-0.93) | 0.1 (-0.2-0.5) |
| LDH | Denka Seiken | 248.7-3276.3 | 0.996 (0.993-0.998) | 0.46 (0.46-0.47) | 3.33 (-3.95-10.62) | -307.5 (-378.7–236.3) |
| Uric acid | Sekisui | 0.1-13.9 | 0.999 (0.998-0.999) | 1.03 (1.00-1.06) | -0.23 (-0.40–0.05) | -0.03 (-0.1-0.0) |
Table 5.
| Analytes | Target±Uncertainty (SRM)† | Mean value (Recovery, %) | Desirable bias (%)§ | Minimum bias (%)II | Optimum bias (%)II | |
|---|---|---|---|---|---|---|
| JEOL | Other‡ | |||||
| Creatinine (mg/dL) | 0.89±0.03 (JCCRM 521-12M) | 0.86 (96.6) | 0.97 (109.3) | 3.96 | 5.94 | 1.98 |
| 2.20±0.09 (JCCRM 521-12H) | 2.18 (99.0) | 2.24 (101.7) | ||||
| 5.31±0.21 (JCCRM 521-12HH) | 5.32 (100.2) | 5.28 (99.5) | ||||
| Glucose (mg/dL) | 100.10±1.00 (JCCRM 521-12M) | 100.23 (100.1) | 100.55 (100.4) | 2.34 | 3.51 | 1.17 |
| 150.20±1.60 (JCCRM 521-12H) | 149.83 (99.8) | 150.83 (100.4) | ||||
| 249.80±2.6 (JCCRM 521-12HH) | 251.70 (100.8) | 251.03 (100.5) | ||||
| Calcium (mg/dL) | 9.37±0.14 (JCCRM 321-7M) | 9.50 (101.4) | 9.25 (98.7) | 0.82 | 1.23 | 0.41 |
| 12.00±0.18 (JCCRM 321-7H) | 12.18 (101.5) | 11.87 (98.9) | ||||
| Uric acid (mg/dL) | 5.50±0.08 (JCCRM 521-12M) | 5.42 (98.5) | 5.54 (100.7) | 4.87 | 7.31 | 2.44 |
| 8.08±0.11 (JCCRM 521-12H) | 8.02 (99.3) | 8.12 (100.5) | ||||
| 11.99±0.23 (JCCRM 521-12HH) | 11.92 (99.4) | 12.09 (100.8) | ||||
∗ The accuracy was performed with certified standard materials∗ for each of the three levels according to the CLSI EP15-A2;
‡ Other tested reagents are manufactured by Roche for creatinine, Denka Seiken for glucose, and Sekisui for calcium and uric acid;


 PDF
PDF ePub
ePub Citation
 Print
Print


 XML Download