

 PDF
PDF ePub
ePub Citation
 Print
Print


Abstract
Background
Methods
Results
Figures and Tables
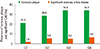 | Fig. 1Presence of coronary plaque and significant coronary artery disease (CAD) based on homocysteine quartile groups.
|
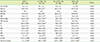
Table 1
Clinical and laboratory characteristics in the subjects based on the homocysteine quartile group
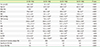
P value derived from one-way ANOVA and χ2 test was used for intergroup comparison.
a, b, c, d: The same letters indicate a non-significant difference between groups based on Scheffe's multiple comparison test.
Abbreviations: Q, quartile; Hcy, homocysteine; BMI, body mass index; WC, waist circumference; SBP, systolic blood pressure; DBP, diastolic blood pressure; TC, total cholesterol; TG, triglyceride; HDL-C, HDL-cholesterol; LDL-C, LDL-cholesterol; FBS, fasting blood sugar; HbA1c, hemoglobin A1c; hsCRP, high sensitivity C-reactive protein; CACS, coronary artery calcium score; CAD, coronary artery disease.
![]()
Table 2
Characteristics of subjects with/without coronary plaque
P value derived from Student's t-test and χ2 test was used for comparing subjects with/without coronary artery plaques.
Abbreviations: Hcy, homocysteine; BMI, body mass index; WC, waist circumference; SBP, systolic blood pressure; DBP, diastolic blood pressure; TC, total cholesterol; TG, triglyceride; HDL-C, HDL-cholesterol; LDL-C, LDL-cholesterol; FBS, fasting blood sugar; HbA1c, hemoglobin A1c; hsCRP, high sensitivity C-reactive protein; CACS, coronary artery calcium score; CAD, coronary artery disease.
![]()
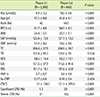
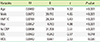
Table 3
Logistic regression analysis for the variables affecting the presence of coronary plaque
This model was adjusted for age, sex, body mass index, waist circumference, blood pressure, blood lipid, fasting blood glucose and HbA1c level.
Abbreviations: OR, odds ratio; CI, confidence interval; WC, waist circumference; SBP, systolic blood pressure; FBS, fasting blood sugar; Hcy, homocysteine; CACS, coronary artery calcium score.
![]()
Table 4
Clinical and laboratory characteristics based on the coronary artery calcium score group in subjects
P value derived from one-way ANOVA and χ2 test was used for intergroup comparison.
a, b, c, d: The same letters indicate non-significant differences between groups based on Scheffe's multiple comparison test.
Abbreviations: Hcy, homocysteine; BMI, body mass index; WC, waist circumference; SBP, systolic blood pressure; DBP, diastolic blood pressure; TC, total cholesterol; TG, triglyceride; HDL-C, HDL-cholesterol; LDL-C, LDL-cholesterol; FBS, fasting blood sugar; HbA1c, hemoglobin A1c; hsCRP, high sensitivity C-reactive protein; CACS, coronary artery calcium score.
![]()
Table 5
Association of the coronary artery calcium score with metabolic and demographic variables
![]()
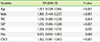
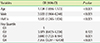
Table 6
Multiple logistic regression analysis for the effect of homocysteine quartile on significant coronary disease (CACS > 400)
![]()
 XML Download