

 PDF
PDF ePub
ePub Citation
 Print
Print


Abstract
Background
The conventional indocyanine green retention rate at 15 minutes (ICG R15) test is inefficient and inconvenient because it requires the use of a manual spectrophotometer and several samples per patient. This study aimed to establish the automation of the ICG R15 test using an automated clinical chemistry analyzer, and to evaluate the calculation of R15 with a small number of samples.
Methods
The performance of the AU5832 (Beckman Coulter, USA) for determining ICG concentration was evaluated in accordance with the Clinical Laboratory Standards Institute (CLSI) guidelines. The R15 results for 77 patients determined by spectrophotometry and AU5832 were compared. We evaluated the calculation of R15 with three samples, except for one sample in which the results had been obtained previously, at 5, 10, and 15 minutes after injection of ICG into the patients, and compared the results with those obtained with four samples.
Results
The automated ICG test using the AU5832 system showed proper performances according to CLSI. Although the difference in the R15 results between the two methods was within the 95% confidence interval, the R15 was adjusted by the regression equation because it was slightly lower according to the automated method compared with the manual method. The R15 with three samples (0, 5, and 15 minutes) showed the best correlation with conventional R15 with four samples (r2=0.996). Compared with the manual method, the R15 result using the AU5832 showed excellent agreement with four samples (kappa value 0.904) and with three samples (kappa value 0.880).
Figures and Tables
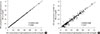 | Fig. 1Linear regression plots of the results of indocyanine green (ICG) concentrations gathered using spectrophotometry (800 nm and 805 nm). The results were also obtained via an automation method using Beckman Coulter AU5832 (800 nm). (A) A significant correlation was observed between ICG concentrations at 800 nm and 805 nm (r2=0.999, P value<0.001). (B) The ICG concentrations using AU5832 at 800 nm also showed significant correlations with those gathered using spectrophotometry at 805 nm (r2=0.957, P value<0.001).
|
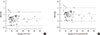 | Fig. 2Bland-Altman plots comparing the retention rate at 15 minutes (R15) results obtained using spectrophotometry and AU5832. (A) A difference plot of the R15 results gathered using spectrophotometry at 805 nm and AU5832 at 800 nm. (B) A difference plot of the R15 results acquired using spectrophotometry at 805 nm and AU5832 at 800 nm. The results were corrected using a regression equation (Y=3.915+0.969X).
|
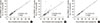 | Fig. 3Linear regression plots comparing the retention rates at 15 minutes (R15) results of AU5832 calculated with 3 or 4 samples obtained at 0, 5, 10, and 15 minutes. (A) A scatter plot of R15 with 3 samples obtained at 5, 10, and 15 minutes. (B) A scatter plot of R15 with 3 samples obtained at 0, 10, and 15 minutes. (C) A scatter plot of R15 with 3 samples obtained at 0, 5, and 15 minutes.
|
Table 1
Precision profiles for the automated measurement of indocyanine green (ICG) concentrations using Beckman Coulter AU5832

| Level* | Mean (mg/dL) | SD (mg/dL) | CV (%) | |||
|---|---|---|---|---|---|---|
| Within-run | Between-run | Between-day | Total | |||
| 1 | 0.20 | 0.01 | 0.88 | 1.15 | 1.67 | 2.21 |
| 2 | 0.49 | 0.01 | 0.60 | 1.74 | 0.64 | 1.95 |
![]()
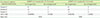
Table 2
Agreement between indocyanine green retention rates at 15 minutes (ICG R15) measured using manual spectrophotometry and AU5832 with 3 or 4 samples from 77 patients
![]()
References
1. Imamura H, Sano K, Sugawara Y, Kokudo N, Makuuchi M. Assessment of hepatic reserve for indication of hepatic resection: decision tree incorporating indocyanine green test. J Hepatobiliary Pancreat Surg. 2005; 12:16–22.

2. Poon RT, Fan ST. Hepatectomy for hepatocellular carcinoma: patient selection and postoperative outcome. Liver Transpl. 2004; 10:S39–S45.
3. Lee CF, Yu MC, Kuo LM, Chan KM, Jan YY, Chen MF, et al. Using indocyanine green test to avoid post-hepatectomy liver dysfunction. Chang Gung Med J. 2007; 30:333–338.
4. Seong MW, Song SH, Oh JY, Park JW, Lee DH. Establishment of an indocyanine green test using an automatic chemistry analyzer. Clin Chem Lab Med. 2006; 44:196–198.
5. Kim SK, Jeong TD, Lee W, Chun S, Min WK. Performance evaluation of Beckman Coulter AU5822 automated clinical chemistry analyzer. Lab Med Online. 2014; 4:77–84.
6. Owen VM. Estimation of indocyanine green concentrations. Clin Biochem. 1973; 6:132–135.
7. Kochubey VI, Kulyabina TV, Tuchin VV, Altshuler GB. Spectral characteristics of indocyanine green upon its interaction with biological tissues. Opt Spectrosc. 2005; 99:560–566.
8. Clinical and Laboratory Standards Institute. Evaluation of precision performance of quantitative measurement methods; approved guideline. 2nd ed. EP5-A2. Wayne, PA: Clinical and Laboratory Standards Institute;2004.
9. Clinical and Laboratory Standards Institute. Evaluation of the linearity of quantitative measurement procedures: A statistical approach; approved guideline. EP6-A. Wayne, PA: Clinical and Laboratory Standards Institute;2003.
10. Clinical and Laboratory Standards Institute. Preliminary evalaution of quantitative clinical laboratory methods; approved guideline. 2nd ed. EP10-A2. Wayne, PA: Clinical and Laboratory Standards Institute;2002.
11. Clinical and Laboratory Standards Institute. Method comparison and bias estimation using patient samples; approved guideline. 2nd ed. EP9-A2. Wayne, PA: Clinical and Laboratory Standards Institute;2002.
12. Kim WW, Lee KW, Choi SH, Heo JS, Kim YI, Kim SJ, et al. Risk factors of morbidity and mortality following surgical resection for hepatocellular carcinoma. Korean J Hepatol. 2004; 10:51–61.
13. Kim SY, Jeong TD, Lee WC, Chun S, Min WK. Performance evaluation of the Roche-Hitachi Cobas 8000 c702 chemistry autoanalyzer. Lab Med Online. 2014; 4:132–139.
 XML Download