

 PDF
PDF ePub
ePub Citation
 Print
Print


Abstract
Background
We evaluated the analytical performance of the Abbott i-STAT CHEM8+, a point-of-care testing system that measures 8 basic chemical analytes, namely, sodium, potassium, chloride, total carbon dioxide, BUN, creatinine, glucose, and ionized calcium.
Methods
The precision and linearity of 8 analytes were evaluated according to the CLSI guidelines EP15-A and EP6-A, respectively, using standard material provided by the manufacturer. i-STAT CHEM8+ and other primary methods (e.g. Hitachi Clinical Analyzer 7600 for 7 analytes, Nova CCX for ionized calcium) were also compared according to the CLSI guideline EP9-A2, using 113 patient samples.
Results
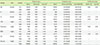
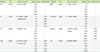
The standard deviation (SD) of within-run and total precision of 7 analytes except chloride was within the claimed SD or within the verification value. The coefficient of variation of total precision of 7 analytes except creatinine was within 2%. With regard to linearity, all 8 analytes showed first-order equation or at least no statistical difference with the first-order equation. We observed that the efficiency of i-STAT CHEM8+ was comparable to that of primary methods, and that this method has potential applications in the clinical laboratory.
Conclusions
i-STAT CHEM8+ showed good precision and linearity, and an efficiency comparable to that shown by routine chemistry analyzers; thus, it has potential applications in the clinical laboratory. It can provide much faster results and relatively accurate value to clinicians in need of immediate results, such as in an emergency unit or in the intensive care unit.
Figures and Tables
Table 1
Precision of i-STAT CHEM8+
![]()
Table 2
Linearity of i-STAT CHEM8+

![]()
Table 3
Best-fit equation and non-linearity% of i-STAT CHEM8+
![]()
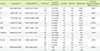
Table 4
Range of value and correlation coefficient of comparison between i-STAT CHEM8+ and main chemistry analyzer

![]()
Table 5
Comparison of i-STAT CHEM8+ with routine chemistry analyzer at the medical decision level by Deming regression
![]()
References
1. Park H, Ko DH, Kim JQ, Song SH. Performance evaluation of the Piccolo xpress Point-of-care Chemistry Analyzer. Korean J Lab Med. 2009; 29:430–438.

2. St John A. The Evidence to Support Point-of-Care Testing. Clin Biochem Rev. 2010; 31:111–119.
3. Nichols JH. Point of care testing. Clin Lab Med. 2007; 27:893–908.
4. Matteucci E, Della Bartola L, Rossi L, Pellegrini G, Giampietro O. Improving CardioCheck PA analytical performance: three-year study. Clin Chem Lab Med. 2014; 52:1291–1296.
5. Clinical and Laboratory Standards Institute. User Demonstration of Performance for Precision and Accuracy; Approved Guideline. Document EP15-A. 2001. p. 67.
6. Clinical and Laboratory Standards Institute. Evaluation of the linearity of quantitative measurement procedure: a statistical approach; Approved guideline. Document EP6-A. Wayne, PA: Clinical and Laboratory Standards Institute;2003. p. 23.
7. Clinical and Laboratory Standards Institute. Method comparison and bias estimation using patient samples; Approved guideline-2nd edition. Document EP9-A2. Wayne, PA: Clinical and Laboratory Standards Institute;2002. p. 22.
8. Statland BE. Clinical Decision Levels for Laboratory Tests. Second Edition. Oradell, NJ: 1987.
9. Centers for Disease Control and prevention. Clinical Laboratory Improvement Amendments Regulation, Standards and Certification: Laboratory Requirements (42 CFR 493). uptated on OCT 2003. http://wwwn.cdc.gov/CLIA/Regulatory/default.aspx.
10. Rhee AJ, Khan RA. Laboratory point-of-care monitoring in the operating room. Curr Opin Anaesthesiol. 2010; 23:741–748.
11. Gault MH, Harding CE. Evaluation of i-STAT portable clinical analyzer in a hemodialysis unit. Clin Biochem. 1996; 29:117–124.
12. Tendl KA, Christoph J, Bohn A, Herkner KR, Pollak A, Prusa AR. Two site evaluation of the performance of a new generation point-of-care glucose meter for use in a neonatal intensive care unit. Clin Chem Lab Med. 2013; 51:1747–1754.
13. Tortella BJ, Lavery RF, Lavery RF, Siegel JH. Precision, accuracy, and managed care implications of a hand-held whole blood analyzer in the prehospital setting. Am J Clin Pathol. 1996; 106:124–127.
 XML Download