Abstract
Background
The XN-series (Sysmex, Japan) is the new hematology analyzer from Sysmex, with new channels to improve the accuracy of differential leukocyte count and platelet count in the low cell count range. We evaluated the analytical performance and low white blood cell (WBC) mode of the XN-2000.
Methods
Precision, linearity, and carryover were evaluated for the analyzer. We analyzed the accordance of complete blood count (CBC), reticulocyte count, and differential leukocyte count between the XN-2000 and XE-2100 (Sysmex), using 200 samples from normal controls and patients. For 80 samples with a WBC count <1.5×10⁹ cells/L, the low WBC mode was evaluated by comparing the automated count with a manual differential count as the reference.
Results
The coefficients of variation of precision were <5% for most CBC parameters and <10% for differential leukocyte count. All results obtained with the XN-2000 showed good correlation with those obtained with the XE-2100. The correlation coefficients (r) were >0.9800 for all CBC parameters except mean corpuscular hemoglobin concentration, mean platelet volume, and platelet distribution width, and >0.9900 for differential leukocyte count except monocytes and basophils. The low WBC mode provided accurate counts for neutrophils and lymphocytes, with r >0.9300 for samples with a WBC count of 0.1–1.5×10⁹ cells/L.
Go to : 
References
2. Buttarello M and Plebani M. Automated blood cell counts: state of the art. Am J Clin Pathol. 2008; 130:104–16.
3. Meintker L, Ringwald J, Rauh M, Krause SW. Comparison of automated differential blood cell counts from Abbott Sapphire, Siemens Advia 120, Beckman Coulter DxH 800, and Sysmex XE-2100 in normal and pathologic samples. Am J Clin Pathol. 2013; 139:641–50.

4. Briggs C, Longair I, Kumar P, Singh D, Machin SJ. Performance evaluation of the Sysmex haematology XN modular system. J Clin Pathol. 2012; 65:1024–30.

5. International Council for Standardization in Haematology. Guidelines for the evaluation of blood cell analysers including those used for differential leucocyte and reticulocyte counting and cell marker applications. International Council for Standardization in Haematology: prepared by the ICSH Expert Panel on Cytometry. Clin Lab Haematol. 1994; 16:157–74.
6. Clinical and Laboratory Standards Institute. Validation, verification, and quality assurance of automated hematology analyzers: approved standard. 2nd ed.CLSI document H26-A2. Wayne PA: Clinical and Laboratory Standard Institute;2010.
7. Clinical and Laboratory Standards Institute. Measurement procedure comparison and bias estimation using patient samples: approved guideline. 3rd ed.CLSI document EP9-A3. Wayne PA: Clinical and Laboratory Standards Institute;2013.
8. Clinical and Laboratory Standards Institute. Reference leukocyte (WBC) differential count(proportional) and evaluation of instrumental methods: approved standard. 2nd ed.CLSI document H20-A2.Wayne PA: Clinical and Laboratory Standard Institute;2007.
9. Seo JY, Lee ST, Kim SH. Performance evaluation of the new hematology analyzer Sysmex XN-series. Int J Lab Hematol. 2015; 37:155–64.

10. Hove LV, Schisano T, Brace L. Anemia diagnosis, classification, and monitoring using Cell-Dyn technology reviewed for the new millennium. Lab Hematol. 2000; 6:93–108.
11. Leader A, Pereg D, Lishner M. Are platelet volume indices of clinical use? A multidisciplinary review. Ann Med. 2012; 44:805–16.

12. Jo YA, Kim M, Kim HS, Kang HJ, Lee YK. Evaluation of the Mindray BC-6800 Complete Blood Counts Analyzer. Lab Med Online. 2013; 3:131–7.

13. Kang SH, Shin E, Han CK, Kim HK, Cho HI. CELL-DYN Sapphire hematology analyzer performance evaluation on leukocyte differential count. J Lab Med Qual Assur. 2006; 28:219–24.
14. Park Y, Song J, Song S, Song KS, Ahn MS, Yang MS, et al. Evaluation of the Abbott Cell-Dyn Sapphire hematology analyzer. Korean J Lab Med. 2007; 27:162–8.

15. Lesesve JF, Benbih M, Lecompte T. Accurate basophils counting: not an easy goal! Clin Lab Haematol. 2005; 27:143–4.
Go to : 
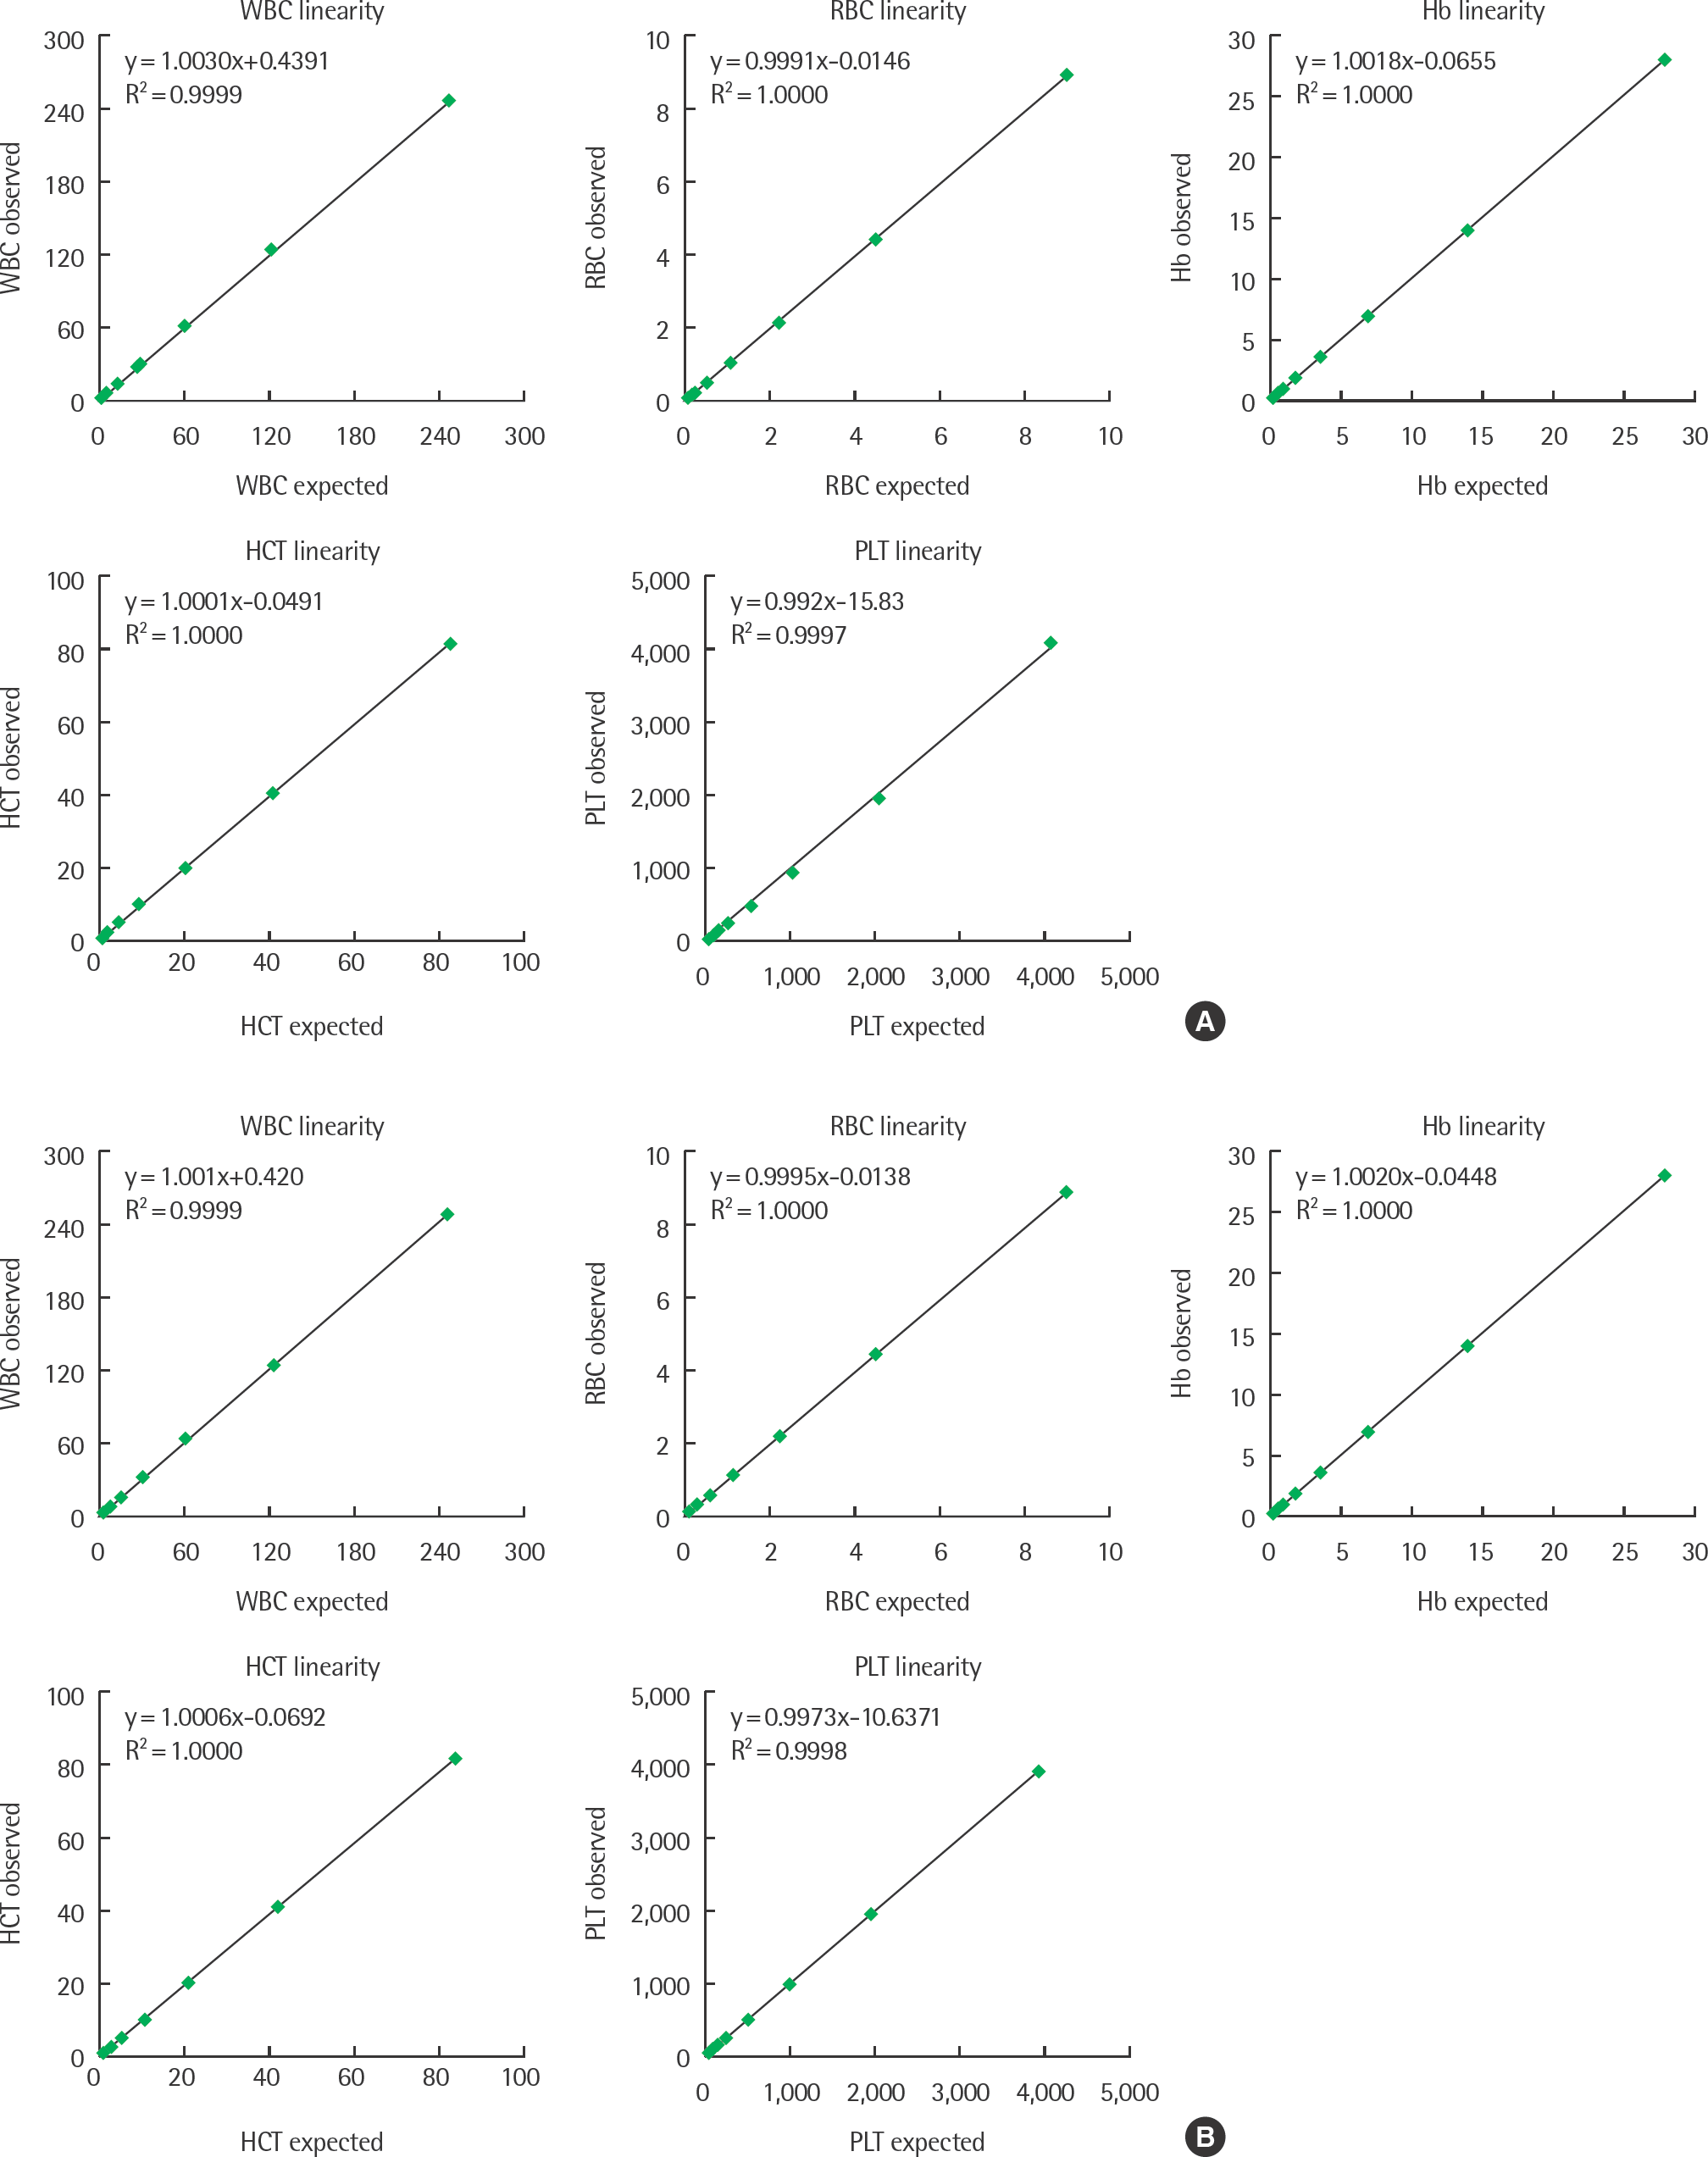
 | Fig. 1.Linearities of white blood cell (WBC) count, red blood cell (RBC) count, hemoglobin (Hb), hematocrit (HCT), and platelet (PLT) count determined by the XN-2000 (A, XN-10 B3; B, XN-10 B4). |
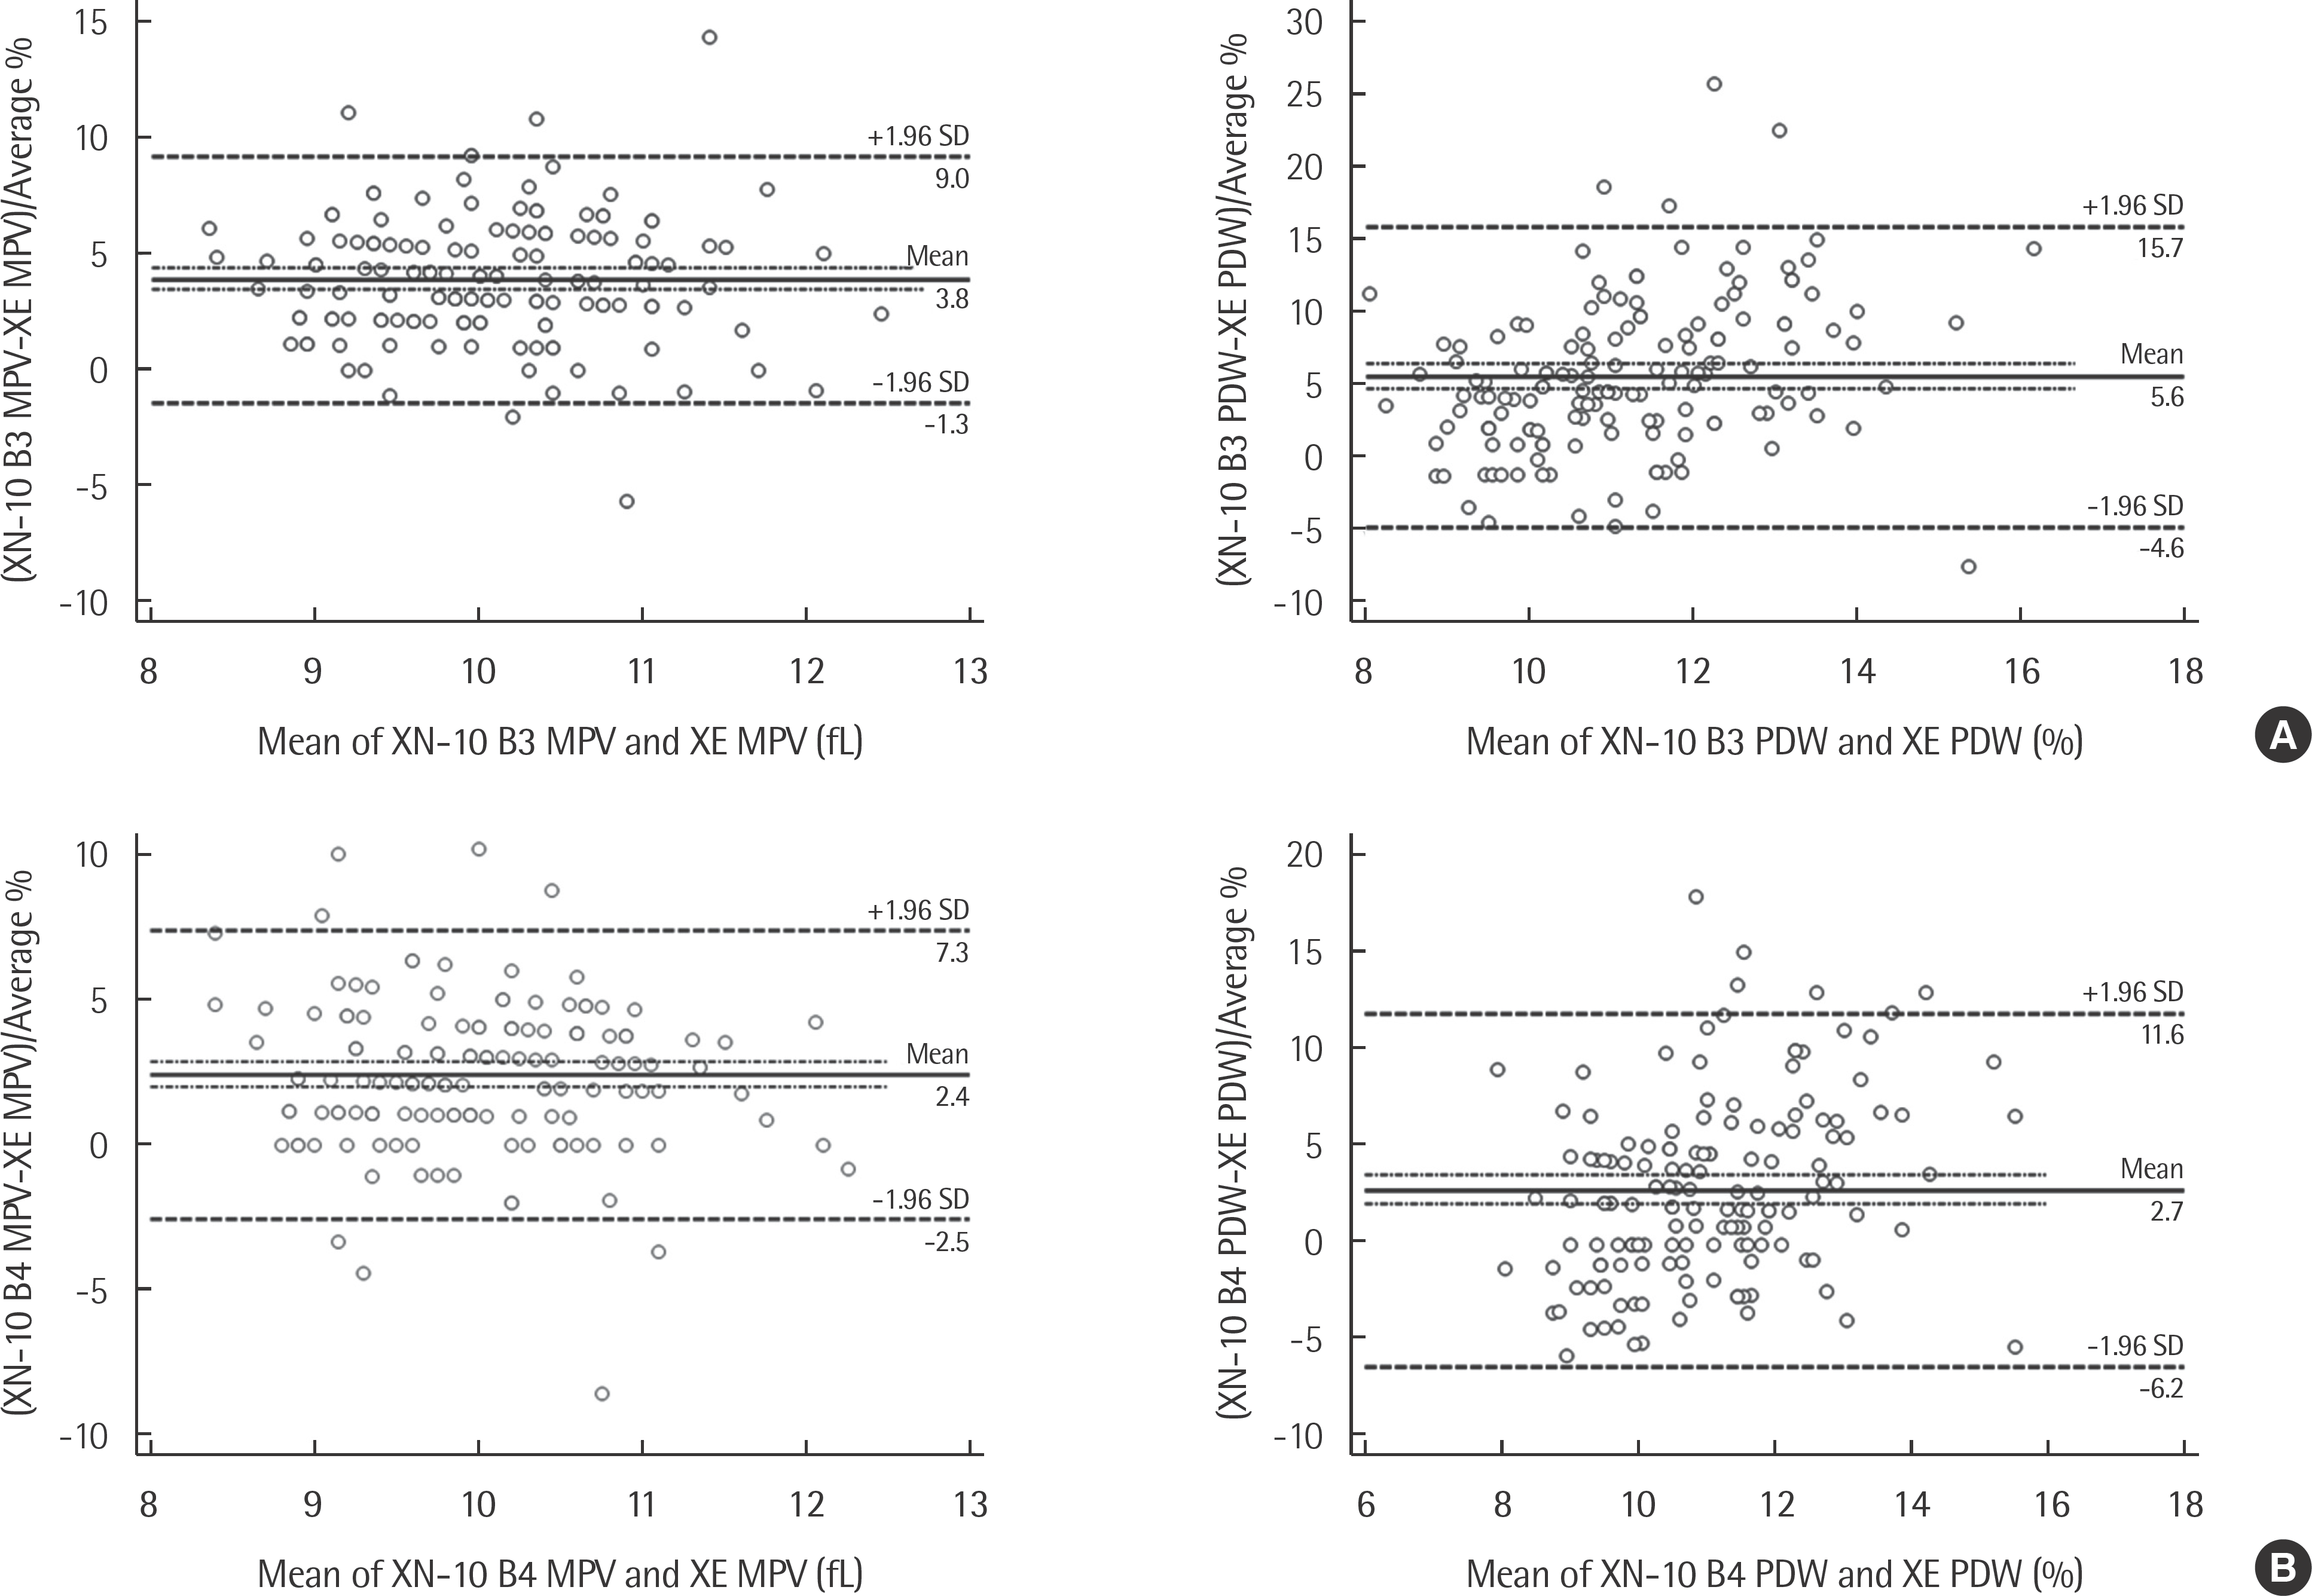
 | Fig. 2.Comparison of complete blood count parameters including mean platelet volume (MPV) and platelet distribution width (PDW) between the XN-2000 and XE-2100 using Bland-Altman plots (A, XN-10 B3; B, XN-10 B4). |
Table 1.
Within-run precision of complete blood count parameters, white blood cell differentials, and reticulocyte counts obtained with the XN-2000
Abbreviations: CV, coefficient of variation; WBC, white blood cells; RBC, red blood cells; MCV, mean corpuscular volume; MCH, mean corpuscular hemoglobin; MCHC, mean corpuscular hemoglobin concentration; PLT, platelets; RDW, red blood cell distribution width; MPV, mean platelet volume; PDW, platelet distribution width.
Table 2.
Correlations of complete blood count parameters, white blood cell differentials (N=150), and reticulocyte counts (N=50) obtained with the XN-2000 vs. the XE-2100
Table 3.
Comparison of automated white blood cell (WBC) differentials, obtained with the XN-2000 using the low WBC mode and the XE-2100, and manual differential counts
| Neutrophils (%) | Lymphocytes (%) | Monocytes (%) | Eosinophils (%) | Basophils (%) | |
|---|---|---|---|---|---|
| XN-10 B3 (N=80) | |||||
| Intercept | 12.0254 | 6.1391 | 3.5972 | 0.8592 | 0.3561 |
| Slope | 0.8107 | 0.7829 | 0.7240 | 0.1036 | 0.3443 |
| r | 0.8588 | 0.8722 | 0.6983 | 0.2737 | 0.4376 |
| XN-10 B4 (N=80) | |||||
| Intercept | 11.2514 | 7.3356 | 2.9366 | 0.9330 | 0.6112 |
| Slope | 0.8125 | 0.7933 | 0.6354 | 0.1080 | 0.4085 |
| r | 0.8569 | 0.8693 | 0.6945 | 0.2706 | 0.4171 |
| XE-2100 (N=62)∗ | |||||
| Intercept | 5.7094 | 8.5618 | 4.0084 | 0.2666 | 0.2244 |
| Slope | 0.8257 | 0.8198 | 0.7259 | 0.7252 | 0.2414 |
| r | 0.9528 | 0.9188 | 0.5279 | 0.8186 | 0.3824 |
Table 4.
Comparison of automated white blood cell (WBC) differentials, obtained with the XN-2000 using the low WBC mode, and manual differential counts for different WBC count ranges


 PDF
PDF ePub
ePub Citation
 Print
Print


 XML Download