

 PDF
PDF ePub
ePub Citation
 Print
Print


Abstract
Background
AU5822 Automated Clinical Chemistry Analyzer (Beckman Coulter, USA) is a fully automated analytical platform designed for the analysis of general chemistry, specific serologic proteins, therapeutic drug monitoring, and drug abuse testing. AU5822 is a high-throughput system that can process up to 5,800 tests per hour and is easy to maintain. In this study, we evaluated the performance of AU5822 on 31 analytes.
Methods
The precision, linearity, correlation, and sample carryover of 31 analytes were evaluated in accordance with the guidelines of the Clinical Laboratory Standards Institute (CLSI). Lyphochek (Bio-Rad Laboratories Inc., USA), Liquichek (Bio-Rad Laboratories Inc.), Validate (Marine Standard Company, USA), and patient sera were used in the analysis. For the correlation study, we carried out a comparison of AU5822 and Cobas 8000 Modular Analyzer (Roche, Switzerland).
Results
The coefficients of variation of all samples showed values below 5%. The coefficient of determination (R2) was ≥0.99, with linearity in the clinically important range. The comparison with Cobas 8000 showed a good correlation, with a correlation coefficient of >0.975 for all of the analytes, excluding sodium that had a correlation coefficient of 0.9641. The test values of percentage sample carryover were less than 0.89%.
Conclusions
AU5822 performed well in terms of precision, linearity, comparison, and sample carryover in the established assays for 31 analytes. Therefore, Beckman Coulter AU5822 Automated Clinical Chemistry Analyzer is expected to be useful for routine chemistry analysis in hospitals with large test volumes.
Figures and Tables
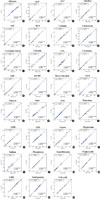 | Fig. 1Linear regression plots comparing the results obtained for 31 analytes by using Beckman Coulter AU5822 and cobas 8000 Modular Analyzer. The following analytes were analyzed: (A) albumin, (B) ALP, (C) ALT, (D) amylase, (E) AST, (F) BUN, (G) calcium, (H) cholesterol, (I) creatinine kinase, (J) chloride, (K) CO2, (L) creatinine, (M) CRP, (N) hs-CRP, (O) direct bilirubin, (P) GGT, (Q) glucose, (R) HDL, (S) iron, (T) potassium. (U) LDH, (V) LDL, (W) lipase, (X) magnesium, (Y) sodium, (Z) phosphorus, (AA) total bilirubin, (AB) triglyceride, (AC) UIBC, (AD) total protein, (AE) uric acid. The blue line represents the linear regression and the gray line depicts a theoretical line with a slope of 1.0 and a y-intercept of 0.
|
Table 1
Analytical methods of Beckman Coulter AU5822
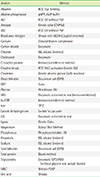
Abbreviations: AMP, 2-amino-2-methyl-1-propanol; BCG, bromo-cresol green; CNPG3, 2-chloro-4-nitrophenyl-α-D-maltotrioside; DPD, 3,5-dichlorophenyldiazonium tetrafluoroborate; GGT, gamma-glutamyl transferase; GLDH, glutamate dehydrogenase; GPO-POD, glycerol-3-phosphate oxidase-peroxidase; hs-CRP, high-sensitivity C-reactive protein; IFCC, international federation of clinical chemistry; ISE, ion-selective electrode; NAC, N-acetyl cysteine; Nitroso-PSAP, 2-Nitroso-5-(N-propyl-N-sulfopropylamino)phenol; P5P, pyridoxal-5-phosphate; pNPP, p-nitrophenyl phosphate; TPTZ, 2,4,6-tripyridyl-s-triazine; UIBC, unsaturated iron binding capacity.
![]()
References
1. Lippi G, Dipalo M, Musa R, Avanzini P, Ferrarini C, Pattini A, et al. Evaluation of the analytical performances of the novel Beckman Coulter AU5800. Clin Biochem. 2012; 45:502–504.

2. Lee DH, Yoon KJ. Evaluation of the Dimension Vista 1500 Chemical Autoanalyzer. J Lab Med Qual Assur. 2012; 34:77–86.
3. Clinical and Laboratory Standards Institute. Evaluation of precision performance of quantitative measurement methods; approved guideline. 2nd ed. EP5-A2. Wayne, PA: Clinical and Laboratory Standards Institute;2004.
4. Medicare, Medicaid and CLIA programs; regulations implementing the Clinical Laboratory Improvement Amendments of 1988 (CLIA)--HCFA. Final rule with comment period. Fed Regist. 1992; 57:7002–7186.
5. Clinical and Laboratory Standards Institute. Evaluation of the linearity of quantitative measurement procedures: A ststistical approach; approved guideline. EP6-A. Wayne, PA: Clinical and Laboratory Standards Institute;2003.
6. Clinical and Laboratory Standards Institute. Method comparison and bias estimation using patient samples; approved guideline. 2nd ed. EP9-A2. Wayne, PA: Clinical and Laboratory Standards Institute;2002.
7. Clinical and Laboratory Standards Institute. Preliminary evalaution of quantitative clinical laboratory methods; approved guideline. 2nd ed. EP10-A2. Wayne, PA: Clinical and Laboratory Standards Institute;2002.
8. Broughton PM. Carry-over in automatic analysers. J Automat Chem. 1984; 6:94–95.
9. Burtis CA, Ashwood ER, editors. Tietz textbook of clinical chemistry and molecular diagnostics. 5th ed. St. Louis, MO: Elsevier/Saunders;2012. p. 163–203.
10. Yoon KJ, Kim JK, Jang JY. Evaluation of VITROS(R) 5,1 FS automated chemistry analyzer. J Lab Med Qual Assur. 2005; 27:211–218.
11. Ehrmeyer SS, Laessig RH, Leinweber JE, Oryall JJ. 1990 Medicare/CLIA final rules for proficiency testing: minimum intralaboratory performance characteristics (CV and bias) needed to pass. Clin chem. 1990; 36:1736–1740.
12. Westgard JO, Burnett RW. Precision requirements for cost-effective operation of analytical processes. Clin chem. 1990; 36:1629–1632.
 XML Download