

 PDF
PDF ePub
ePub Citation
 Print
Print


Abstract
Background
Blood CD4+ T-lymphocyte (T4) count is a major clinical marker for the diagnosis and management of AIDS, and flow cytometry is considered the gold standard for T4 enumeration. Our aim was to compare the 2-color and 4-color flow cytometric methods for T-cell subset analysis in HIV-infected patients.
Methods
T-cell subsets such as T3, T4, T8, and CD3+CD4-CD8- double negative T cells (DN T) were analyzed from the whole blood of 40 HIV-infected patients by using both 2-color and 4-color methods on a Cytomics FC500 analyzer. Statistical analyses using simple linear regression, paired t-tests, and Bland-Altman plots were performed.
Results
The measured T3 (%), T4 (%), T4 (/µL), T8 (%), T8 (/µL), and DN T (%) differed significantly between the 2 methods (P<0.05), whereas the T4/T8 ratio did not. T3 (%), T4 (%), T4 (/µL), T8 (%), T8 (/µL), and T4/T8 measured by the 2 methods showed good correlation, with correlation coefficients above 0.96, whereas DN T (%) did not. The mean differences in T4 (%) and T8 (%) were 0.39% (limit of agreement (LoA), -1.64~2.43) and 1.26% (LoA, -3.37~5.89), respectively.
Conclusions
Although there were statistically significant differences in the T cell subsets measured between the 2 methods, the differences were minor, and the 2 methods showed good correlation. As confirmed in this study, DN T (%) estimated by the 2-color method is lower than the actual value. We suggest that although the 2 methods can be used interchangeably, the 4-color method is recommended for the analysis of some specific subpopulations such as DN T (%).
Figures and Tables
Fig. 1
T lymphocyte subset analyses of a representative patient sample analyzed by the 2-color (A) and 4-color (B) methods. (A) Gating was done with forward scatter and side scatter. CD45 and CD14 were used to measure purity. Absolute counts were calculated from data input from the CBC count and WBC differential count performed before analysis. (B) Gating was automatically set on CD45 and side scatter.
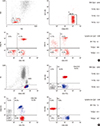
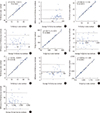
Fig. 2
Graphic representation of regression analyses (A, C, E, G, I) and Bland-Altman difference plots (B, D, F, H, J) between the 2-color and 4-color methods: percentage of T3 cells (A, B), percentage of T4 cells (C, D), absolute T4 count (E, F), percentage of T8 cells (G, H), and absolute T8 count (I, J). The horizontal dotted lines indicate ±2SD.
References
1. Fahey JL, Taylor JM, Detels R, Hofmann B, Melmed R, Nishanian P, et al. The prognostic value of cellular and serologic markers in infection with human immunodeficiency virus type 1. N Engl J Med. 1990; 322:166–172.

2. Fauci AS, Macher AM, Longo DL, Lane HC, Rook AH, Masur H, et al. NIH conference. Acquired immunodeficiency syndrome: epidemiologic, clinical, immunologic, and therapeutic consideration. Ann Intern Med. 1984; 100:92–106.
3. Hammer SM, Eron JJ Jr, Reiss P, Schooley RT, Thompson MA, Walmsley S, et al. Antiretroviral treatment of adult HIV infection: 2008 recommendations of the International AIDS society-USA panel. JAMA. 2008; 300:555–570.
4. O'Brien WA, Hartigan PM, Martin D, Esinhart J, Hill A, Benoit S, et al. Veterans Affairs Cooperative Study Group on AIDS. Changes in plasma HIV-1 RNA and CD4+ lymphocyte counts and the risk of progression to AIDS. N Engl J Med. 1996; 334:426–431.
5. World Health Organization. Laboratory guidelines for enumerating CD4 T lymphocytes in the context of HIV/AIDS. New Delhi WHO Regional Office for South-East Asia: WHO press;2007. p. 62–83.
6. Bergeron M, Nicholson JK, Phaneuf S, Ding T, Soucy N, Badley AD, et al. Selection of lymphocyte gating protocol has impact on the level of reliability of T-cell subsets in aging specimens. Cytometry. 2002; 50:53–61.
7. Bland JM, Altman DG. Statistical methods for assessing agreement between two methods of clinical measurement. Lancet. 1986; 1:307–310.
8. UNAIDS and World Health Organization. Progress on global access to HIV antiretroviral therapy: a report on "3 by 5" and beyond. Geneva: WHO press;2006. p. 24–25.
9. Korea Centers for Disease Control and Prevention. Annual report on the notified HIV/AIDS in Korea. Chungwon: Korea Centers for Disease Control and Prevention;2012. p. 14.
10. D'Acquisto F, Crompton T. CD3+CD4-CD8- (double negative) T cells: saviours or villains of the immune response? Biochem Pharmacol. 2011; 82:333–340.
11. Sundaravaradan V, Mir KD, Sodora DL. Double-negative T cells during HIV/SIV infections: potential pinch hitters in the T-cell lineup. Curr Opin HIV AIDS. 2012; 7:164–171.
12. Fletcher MA, Baron GC, Ashman MR, Fischl MA, Klimas NG. Use of whole blood methods in assessment of immune parameters in immunodeficiency states. Diagn Clin Immunol. 1987; 5:69–81.
13. Nicholson JK, Jones BM, Hubbard M. CD4 T-lymphocyte determinations on whole blood specimens using a single-tube three-color assay. Cytometry. 1993; 14:685–689.
14. Nicholson J, Kidd P, Mandy F, Livnat D, Kagan J. Three-color supplement to the NIAID DAIDS guideline for flow cytometric immunophenotyping. Cytometry. 1996; 26:227–230.
15. Kutok JL, Roma AO, Lemire SJ, Dorfman DM. Four-color flow cytometric immunophenotypic determination of peripheral blood CD4+ T lymphocyte counts: a comparison of validity and cost-effectiveness with a two-color method. Am J Clin Pathol. 1998; 110:465–470.
16. Mbopi-Kéou FX, Mion S, Sagnia B, Bélec L. Validation of a single-platform, volumetric, CD45-assisted PanLeucogating Auto40 flow cytometer to determine the absolute number and percentages of CD4 T cells in resource-constrained settings using Cameroonian patients' samples. Clin Vaccine Immunol. 2012; 19:609–615.
17. Clinical and Laboratory Standards Institute. EP5-A2. Enumeration of immunologically defined cell populations by flow cytometry; approved guideline. 2nd ed. Wayne, PA: Clinical and Laboratory Standards Institute;2007.
18. Luider J, Cyfra M, Johnson P, Auer I. Impact of the new Beckman Coulter Cytomics FC 500 5-color flow cytometer on a regional flow cytometry clinical laboratory service. Lab Hematol. 2004; 10:102–108.
 XML Download