Abstract
Objectives
With the rapid increase in the prevalence of diabetes, the age groups of diabetic patients are becoming diversified. This study will examine the degree of obesity, insulin resistance, and insulin secretion ability among patients first diagnosed with diabetes according to age and gender.
Methods
The subjects of this study included 616 patients who were first diagnosed with diabetes during a routine physical examination. This sample was obtained from a total of 28,075 adults aged 19 years and older who received the examination among 33,829 participants in the Korea National Health & Nutrition Examination Survey (KNHANES) from 2007–2010. The subjects were categorized by age into young age (age: 19 – 39 years), middle age (age: 40 – 59 years), and old age (age: 60 years and older). The degree of obesity was categorized according to body mass index (BMI) into normal weight (BMI: 18.5 ∼ 22.9), overweight (BMI: 23 ∼ 24.9), and obesity (BMI: 25 or above). Insulin resistance was evaluated by homeostatic model assessment of insulin resistance (HOMA-IR).
Results
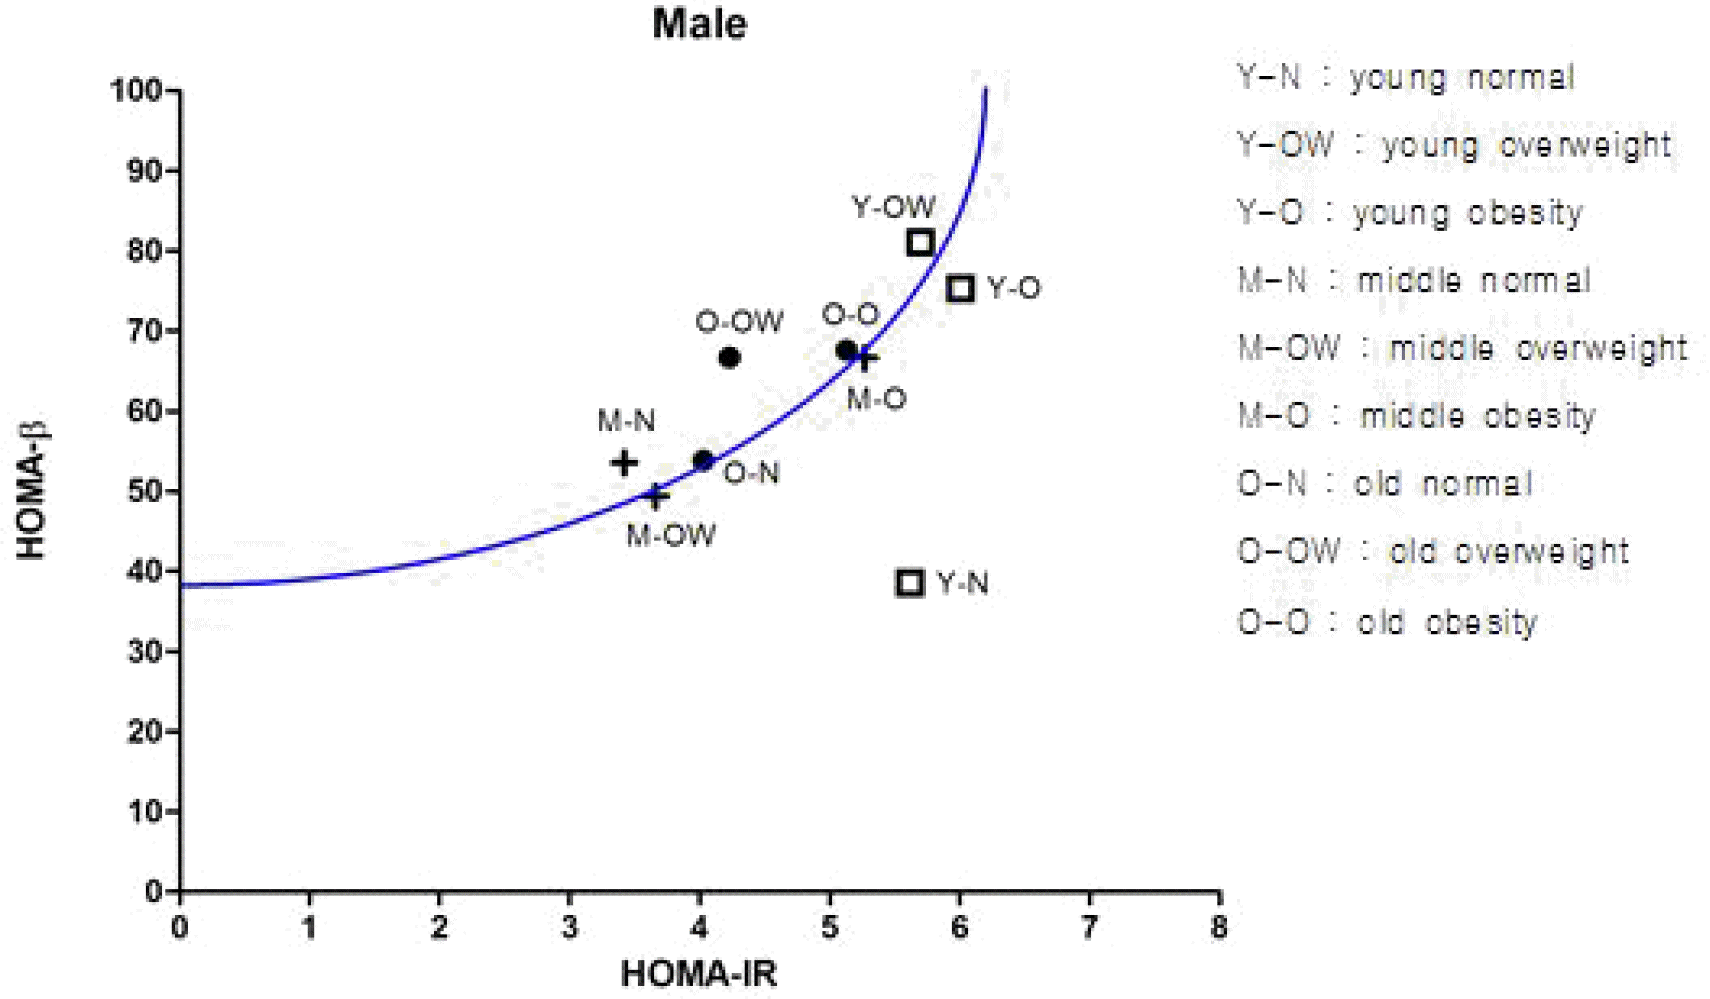
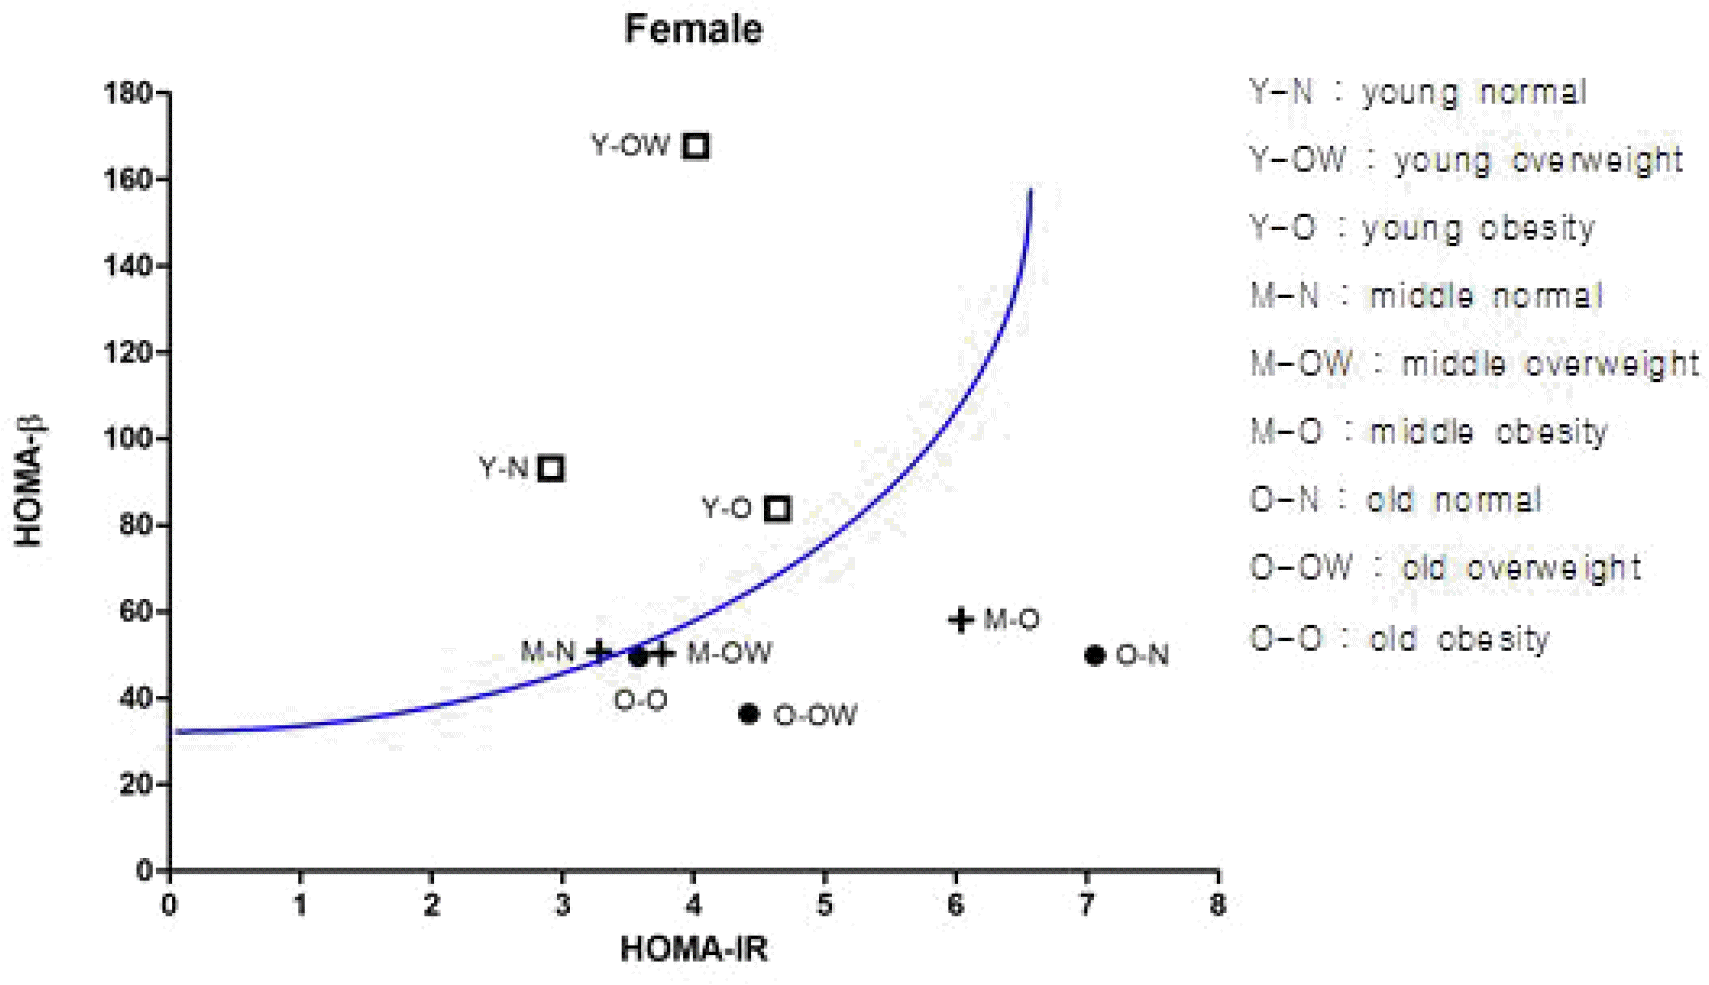
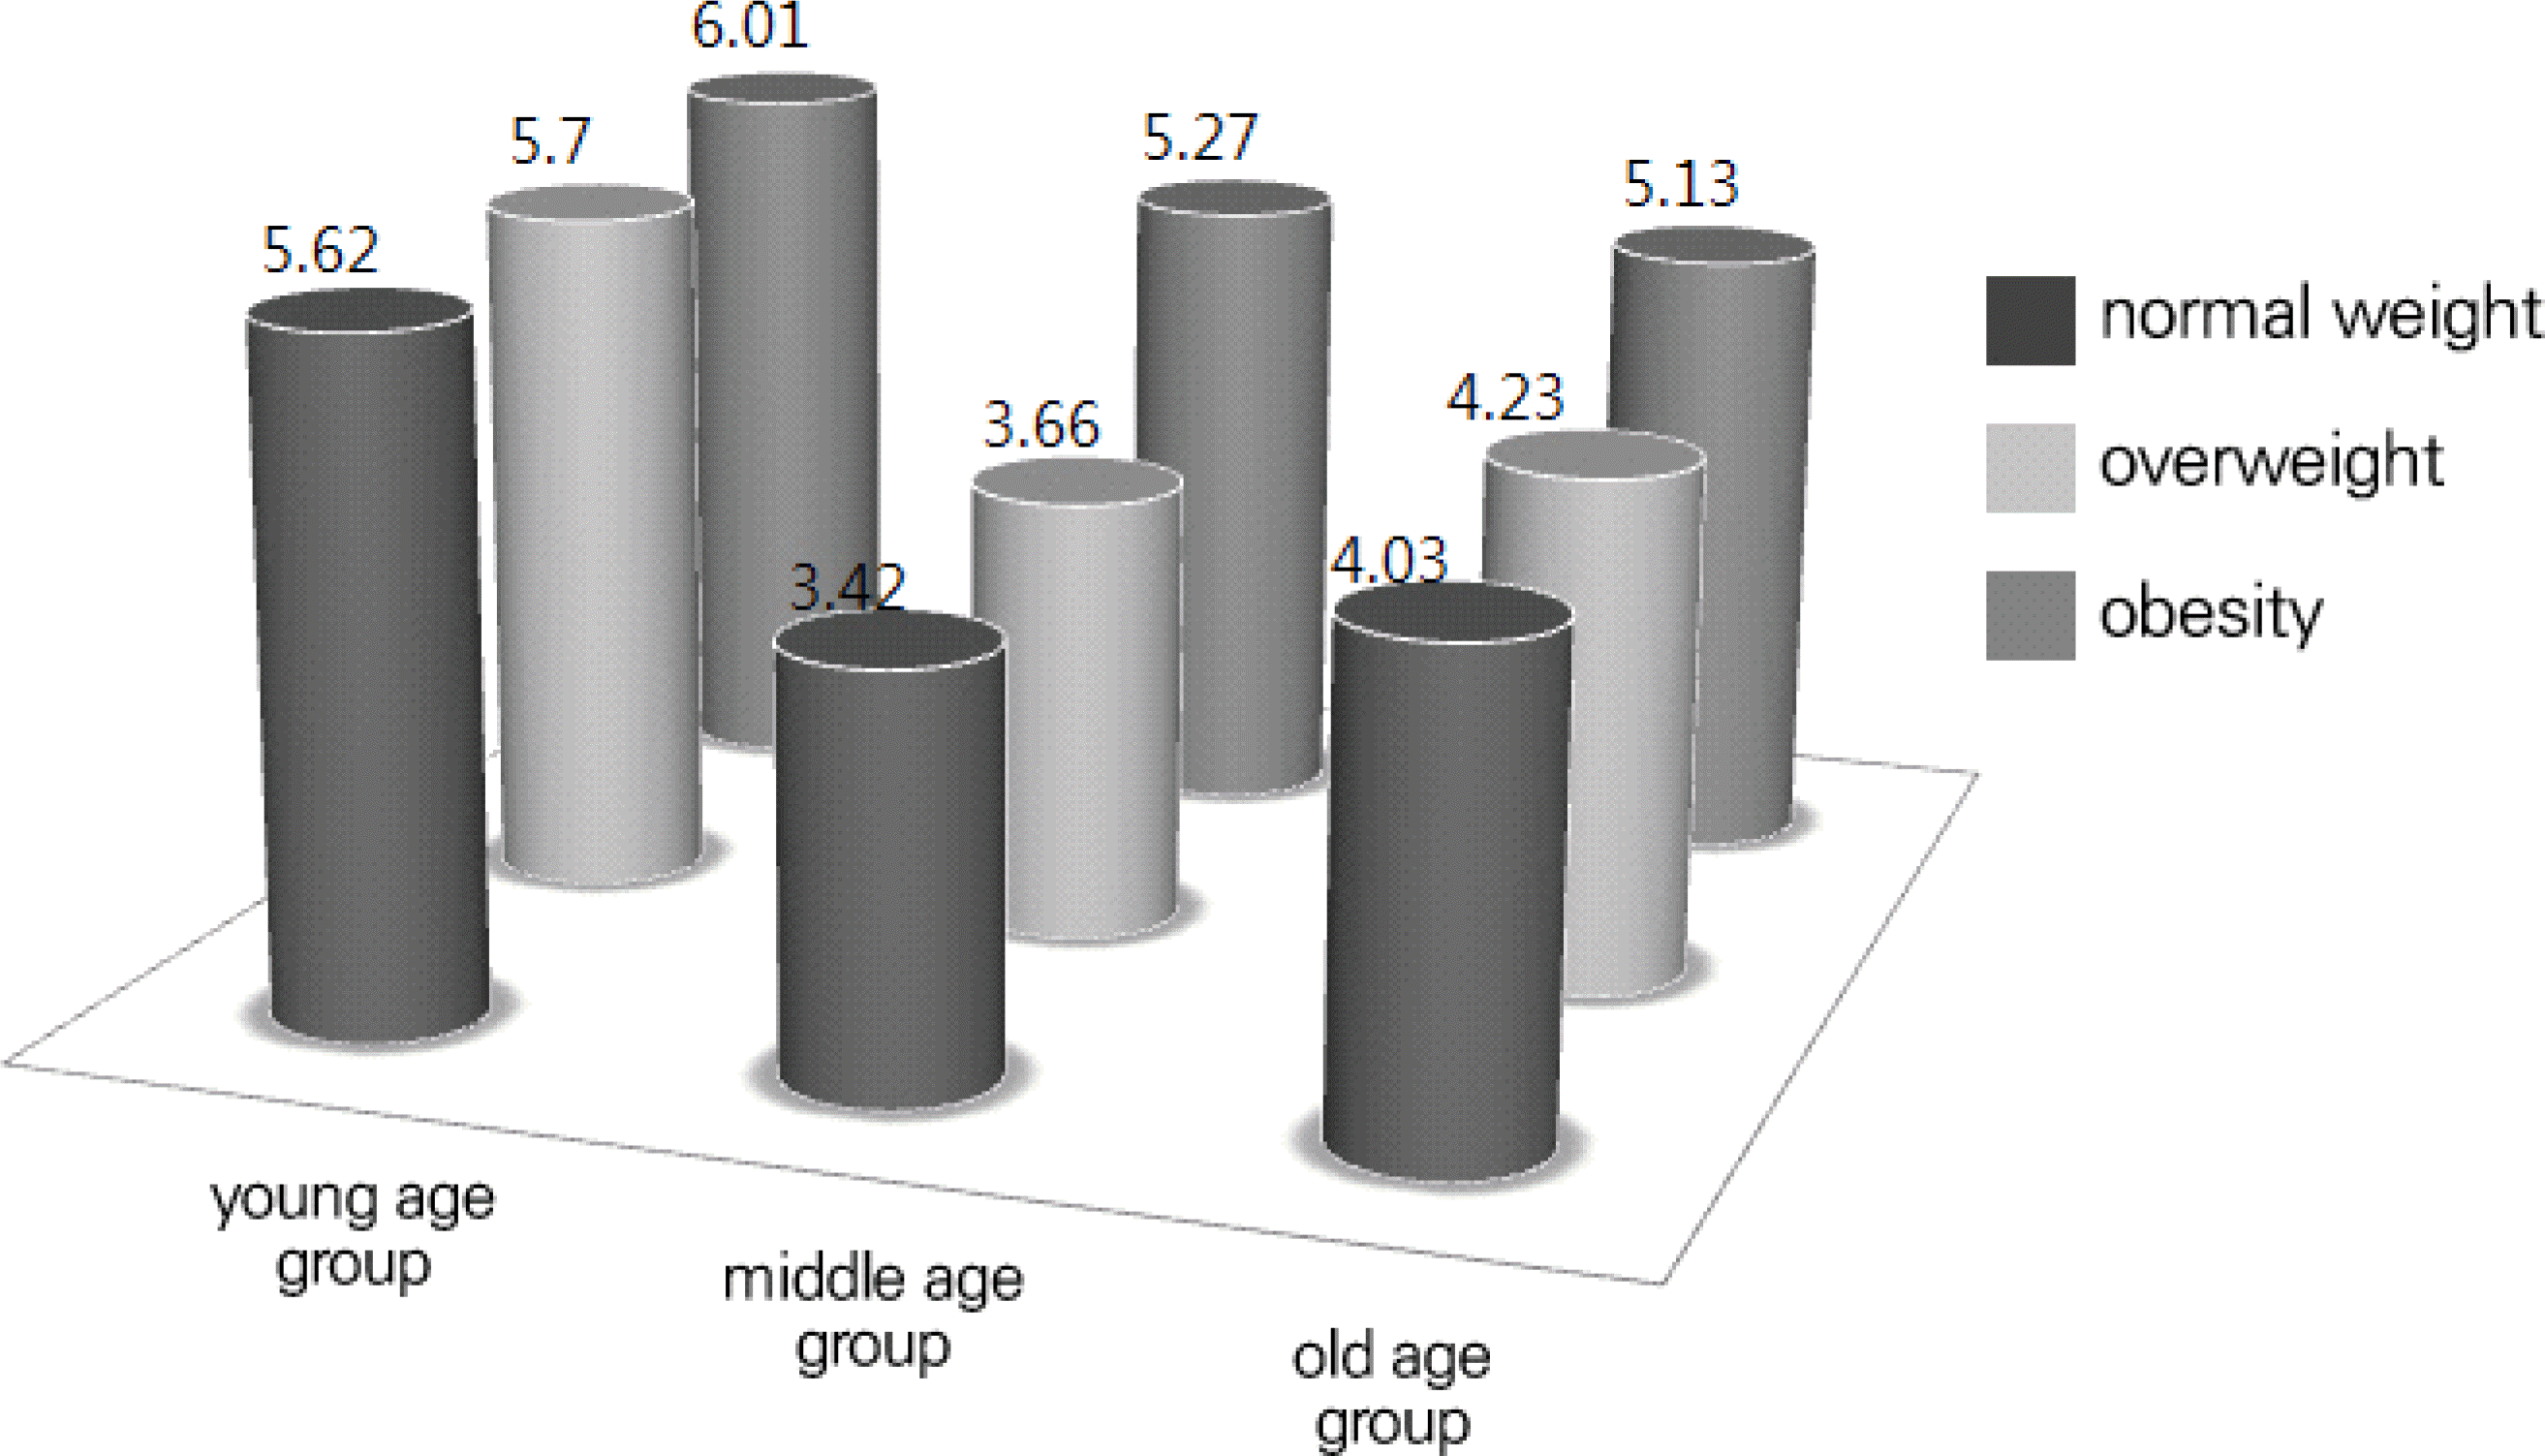
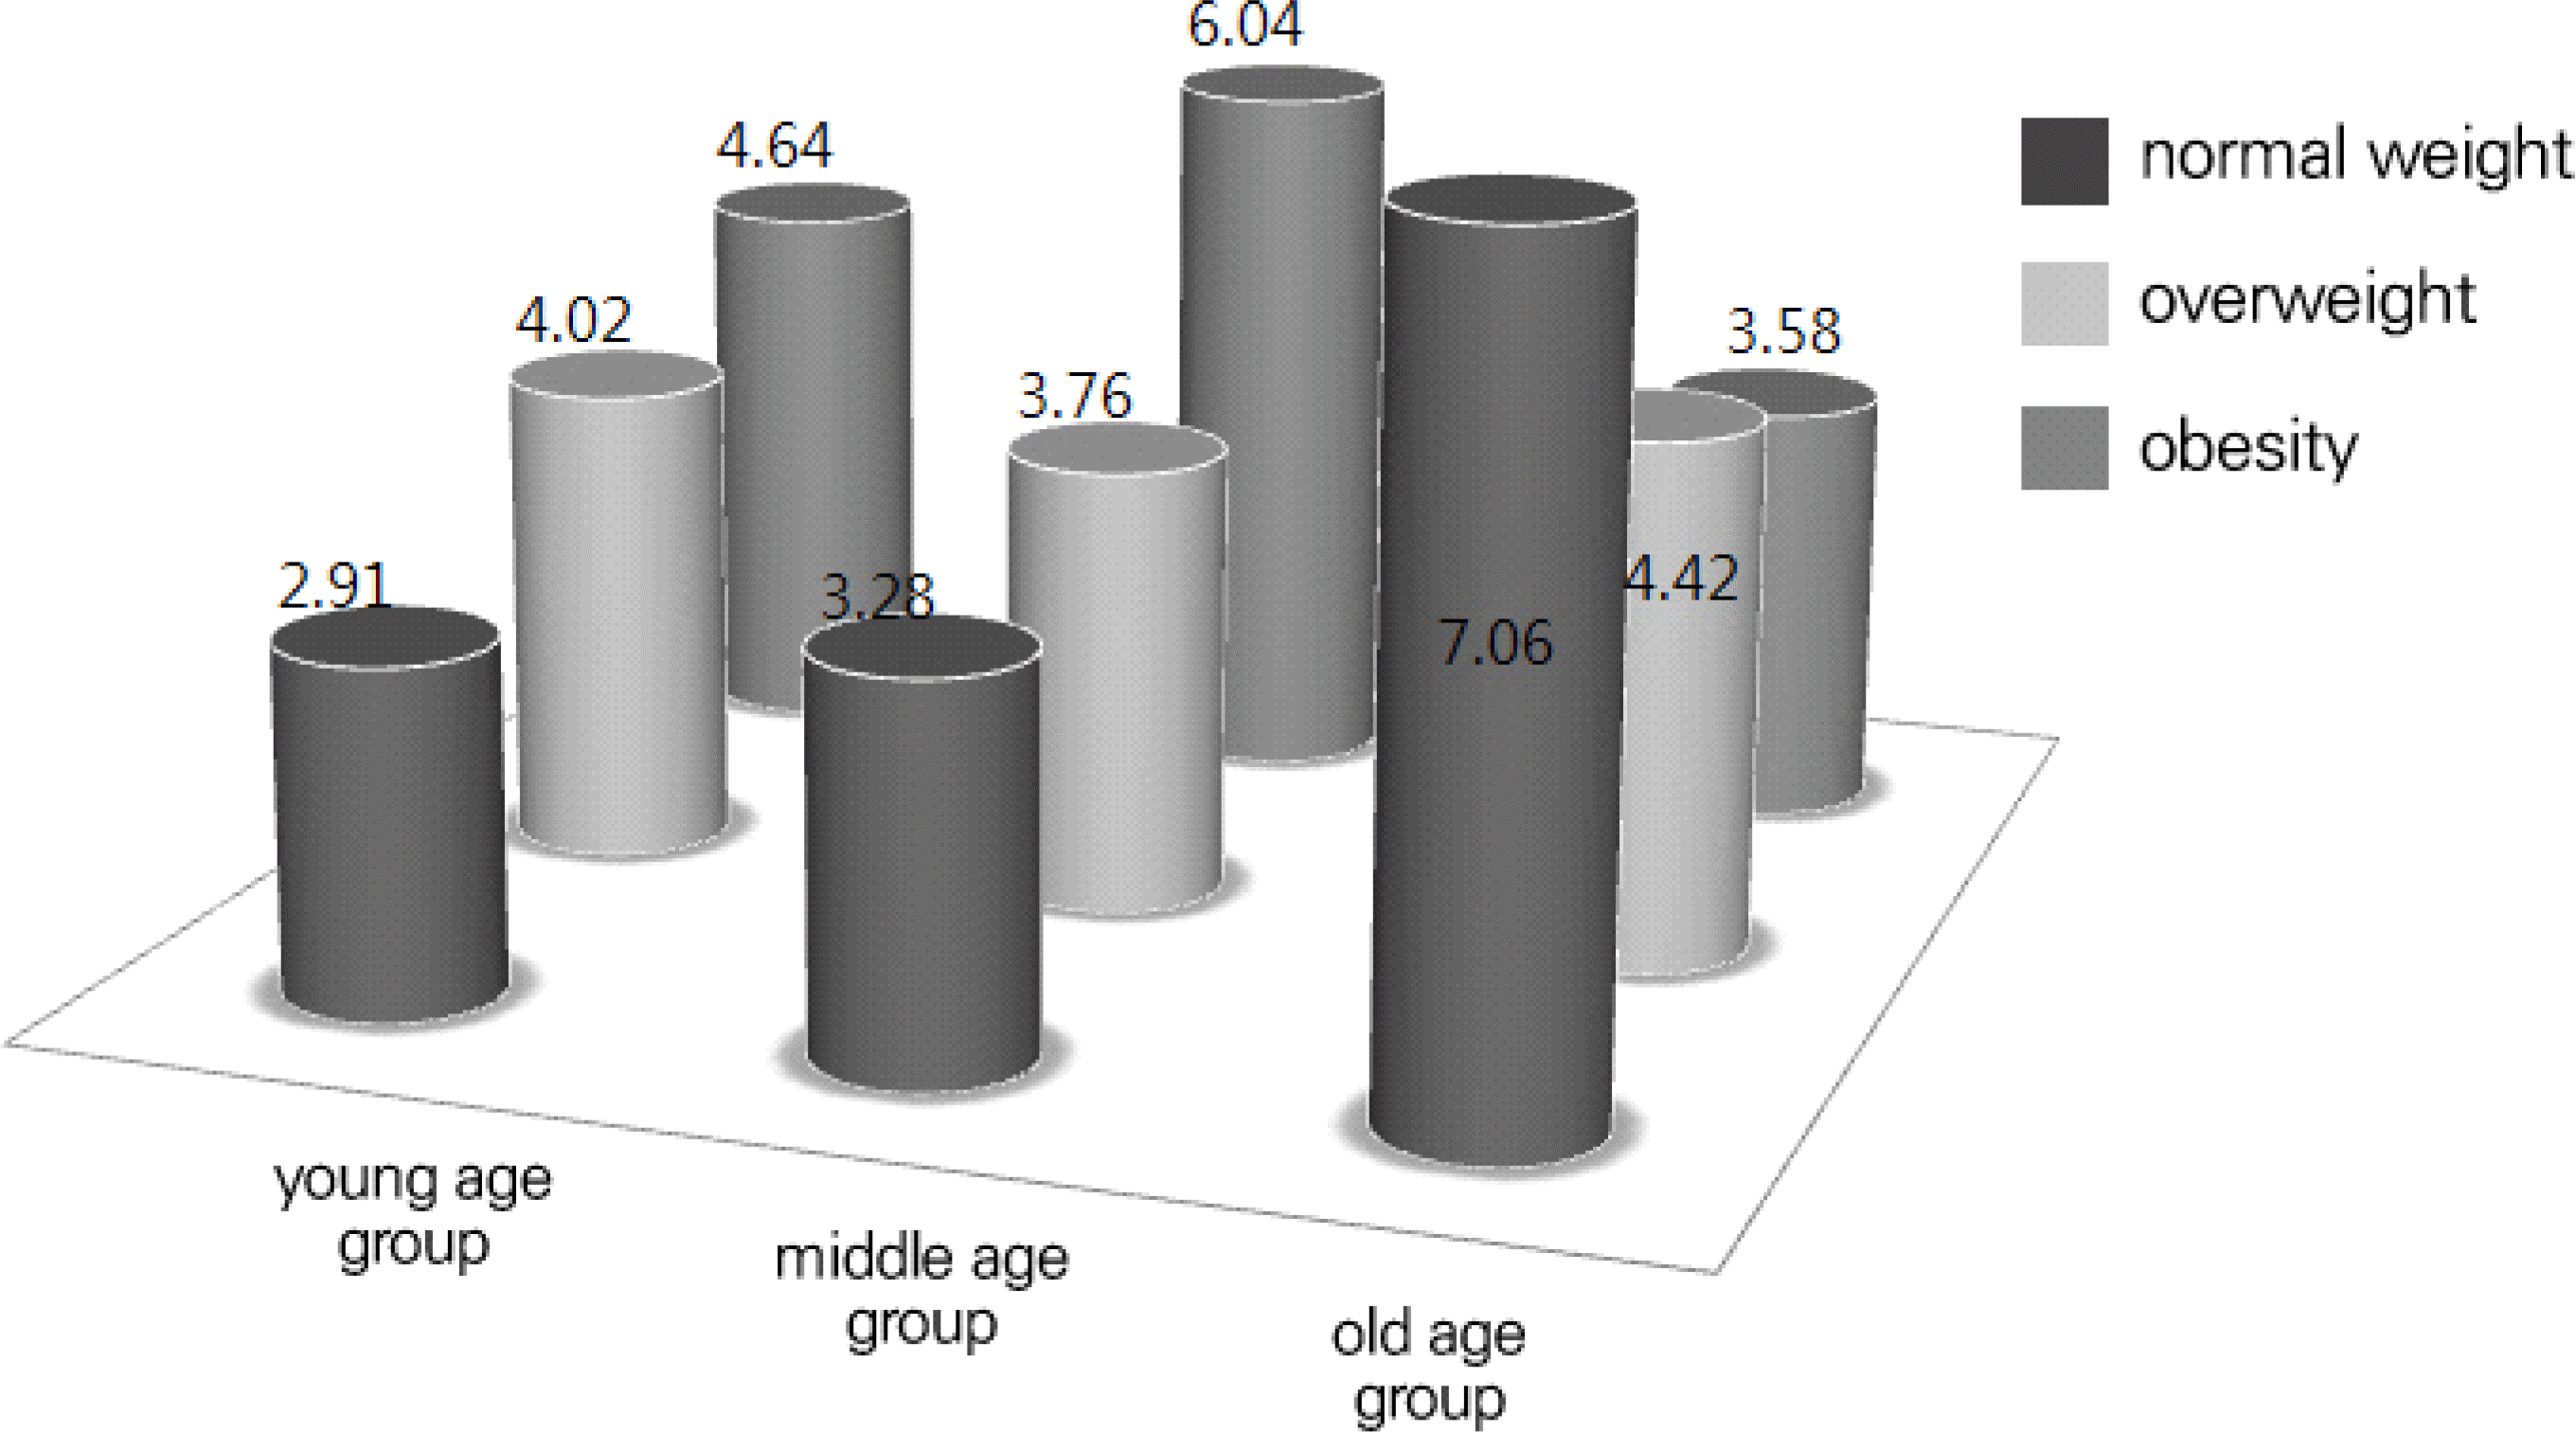
It was found that 14.1% (n = 87) of a total of 616 subjects (324 men, 292 women) were in the young age group, 43.8% (n = 270) were in the middle age group, and 42.1% (n = 259) were in the old age group. In addition, 83.3% of men that were overweight or obesity were in the young age group, while 79.2% and 60.5% were in the middle age and old age groups, respectively. A total of 82.2% of women that were overweight or obesity were in the young age group, while 79.5% and 77% were in the middle age and old age groups, respectively. For men, the more obesity they were in all age groups, the higher their HOMA-IR. For women, the more obesity they were in the young age and middle age groups, the higher their HOMA-IR; however, women in the old age group showed the highest HOMA-IR when they were of normal weight.
Conclusion
Among diabetic patients first diagnosed with the disease in Korea, the youth population had the highest obesity rate. Insulin resistance increases as an individual's weight increases among those patients who are first diagnosed with diabetes; the only exception noted is for elderly women.
References
1. Lam DW, LeRoith D. The worldwide diabetes epidemic. Curr Opin Endocrinol Diabetes Obes. 2012; 19:93–6.

3. Kim JH, Kim DJ, Jang HC, Choi SH. Epidemiology of micro- and macrovascular complications of type 2 diabetes in Korea. Diabetes Metab J. 2011; 35:571–7.

4. The Korea Centers for Disease Control and Prevention. Korean National Health and Nutrition Examination Survey. 2009.
5. Kim SG, Choi DS. Epidemiology and current status of diabetes in Korea. Hanyang Medical Rev. 2009; 29:122–9.
6. Korean diabetes association. Diabetes fact sheet in Korea. 2012.
7. Matthews DR, Hosker JP, Rudenski AS, Naylor BA, Treacher DF, Turner RC. Homeostasis model assessment: insulin resistance and beta-cell function from fasting plasma glucose and insulin concentrations in man. Diabetologia. 1985; 28:412–9.
8. Kim KS, Choi CH, Lee DY, Kim EJ. Epidemiological study on diabetes mellitus among rural Korean. J Korean Diabetes Assoc. 1972; 1:17–24.
9. Leahy JL. Natural history of beta-cell dysfunction in NIDDM. Diabetes Care. 1990; 13:992–1010.
10. Song KE, Kim DJ, Park JW, Cho HK, Lee KW, Hub KB. Clinical Characteristics of Korean Type 2 Diabetic Patients According to Insulin Secretion and Insulin Resistance. J Korean Diabetes Assoc. 2007; 31:123–9.

11. Rhee SY, Chon S, Oh S, Kim SW, Kim JW, Kim YS, et al. Insulin secretion and insulin resistance in newly diagnosed, drug naive prediabetes and type 2 diabetes patients with/without metabolic syndrome. Diabetes Res Clin Pract. 2007; 76:397–403.

13. Kahn SE. Clinical review 135. The importance of beta-cell failure in the development and progression of type 2 diabetes. J Clin Endocrinol Metab. 2001; 86:4047–58.
Fig. 4.
Relationship between insulin resistance and insulin secretory function according to obesity and age group in male. Y-N: young normal, Y-OW: young overweight, Y-O: young obesity M-N: middle normal, M-OW: middle overweight, M-O: middle obesity O-N: old normal, O-OW: old overweight, O-O: old obesity

Fig. 5.
Relationship between insulin resistance and insulin secretory function according to obesity and age group in female. Y-N: young normal, Y-OW: young overweight, Y-O: young obesity M-N: middle normal, M-OW: middle overweight, M-O: middle obesity O-N: old normal, O-OW: old overweight, O-O: old obesity

Table 1.
Baseline characteristics according to age group
Data are mean ± standard deviation. AC, abdominal circumference; FBS, fasting plasma sugar; HbA1C, hemoglobin A1c; HOMA-IR, [Fasting insulin (IU/mL) × fasting plasma glucose (mmol/L)] / 22.5; HOMA β-cell, [20 × fasting plasma insulin (IU/mL)] / [fasting plasma glucose (mmol/L) – 3.5]; a, young age group and middle age group, P< 0.05; b, young age group and old age group, P< 0.05; c, middle age group and old age group, P< 0.05


 PDF
PDF ePub
ePub Citation
 Print
Print


 XML Download