Abstract
Objectives
Methods
Results
Conclusions
References
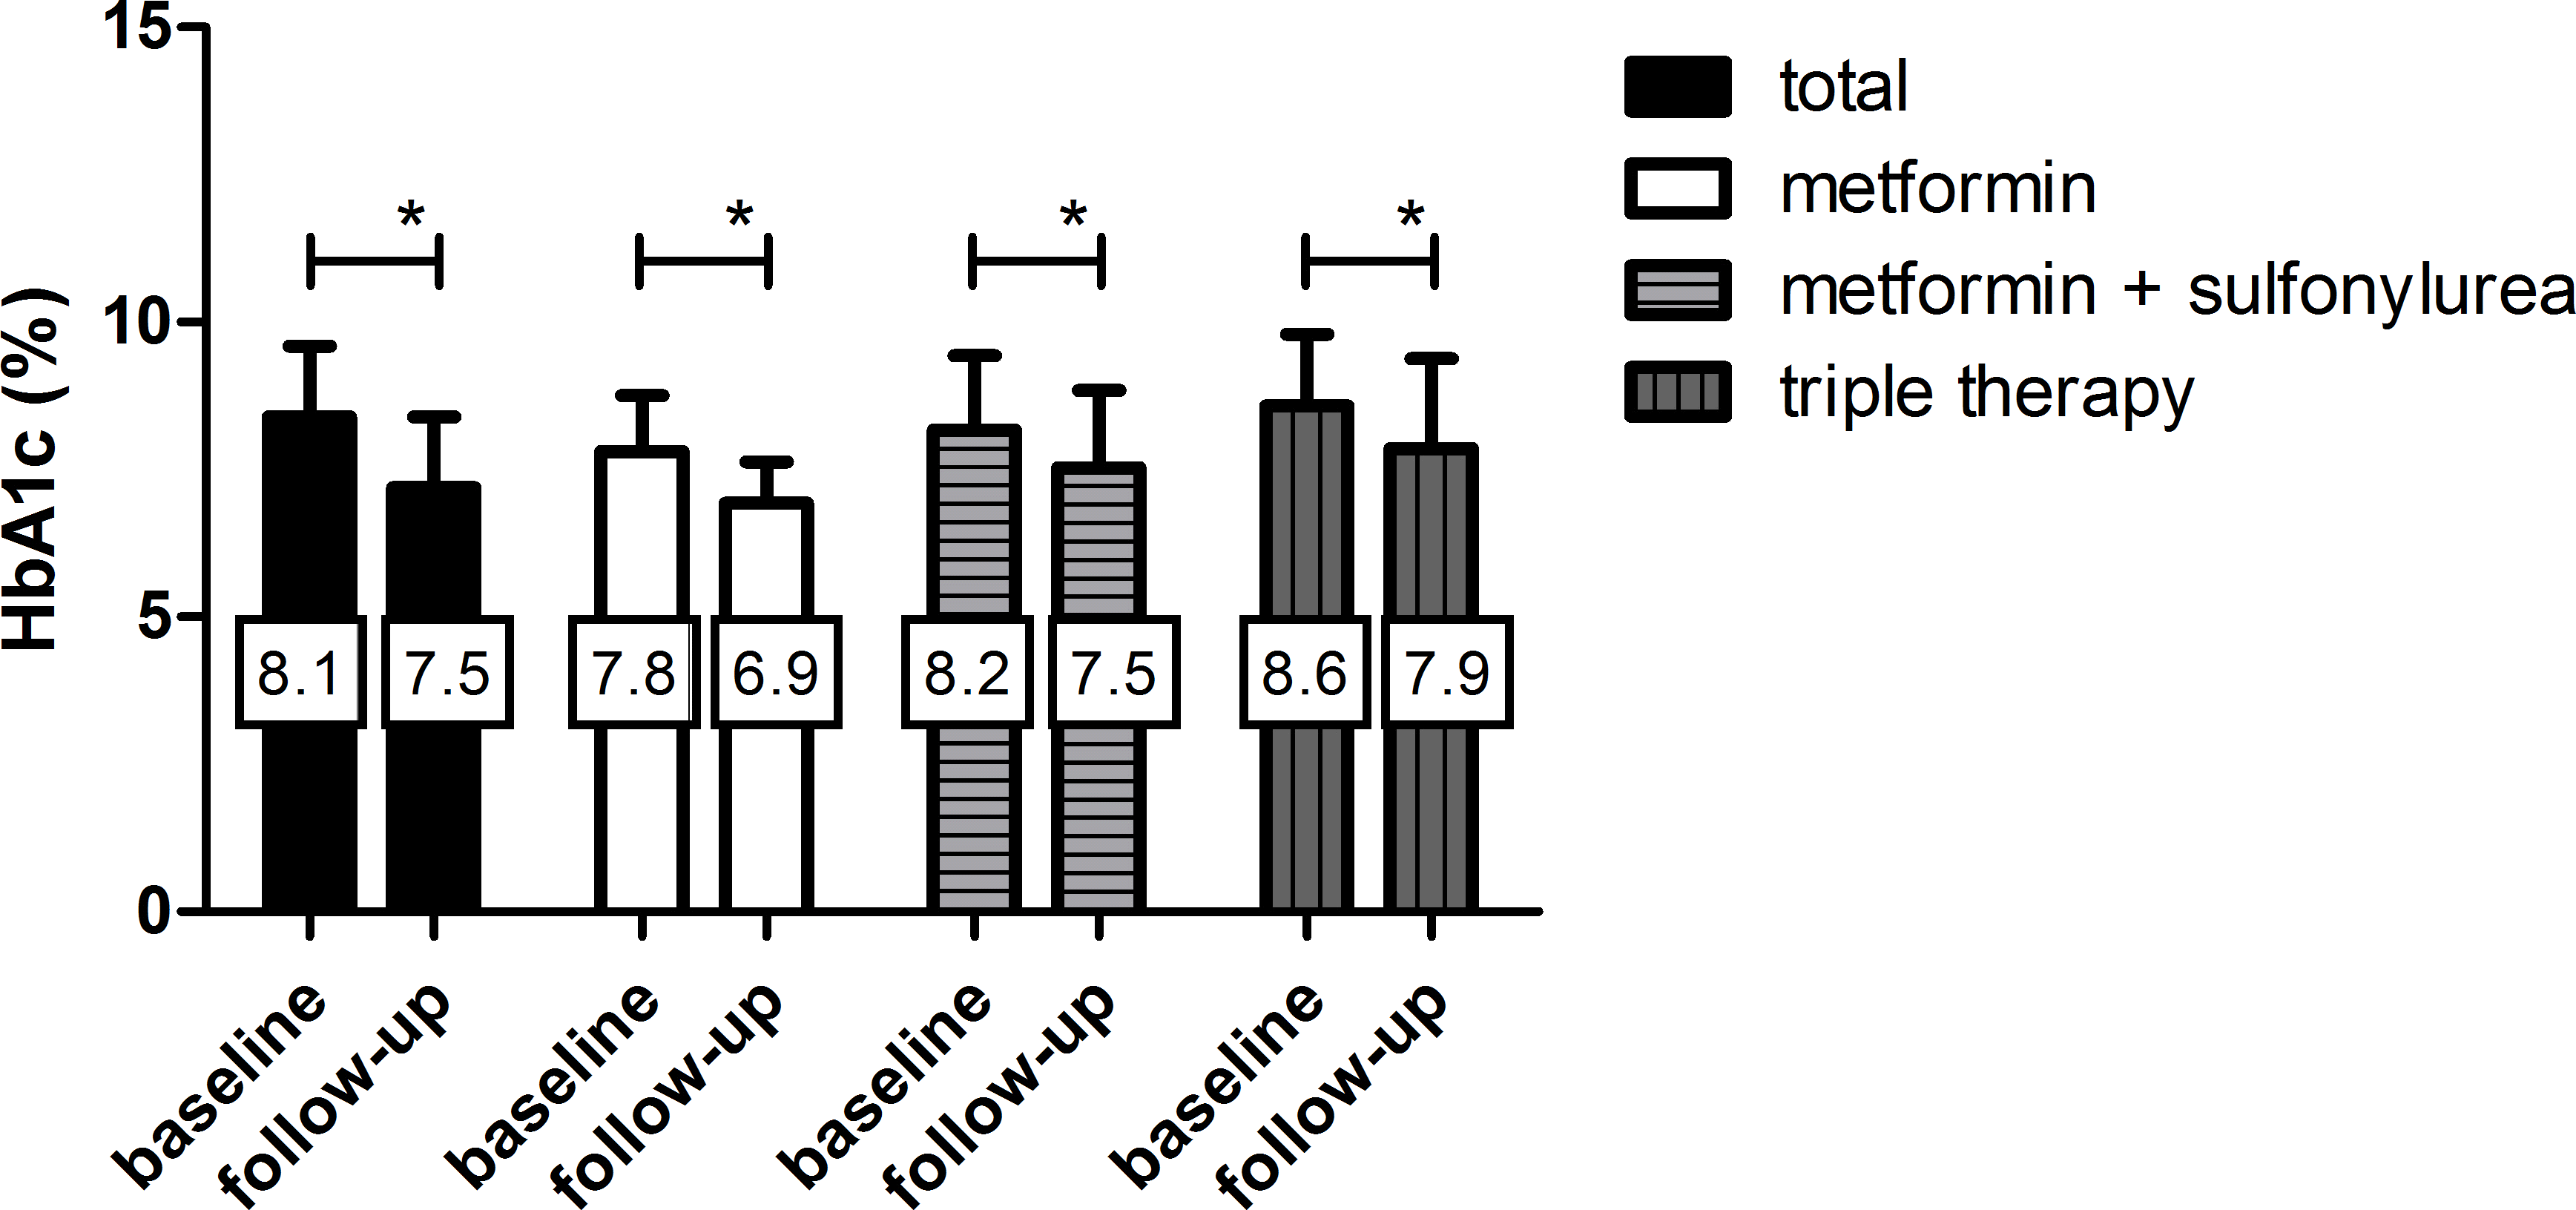
 | Fig. 1.The efficacy of glycemic control after add-on treatment with DPP-4 inhibitors stratified by concomitant combination treatment. Values in the box represent the mean HbA1c level. ∗ P – value < 0.005 by paired t-test. |
Table 1.
| Parameters | n | Baseline | Follow-up | P – value† |
|---|---|---|---|---|
| Age (years) | 135 | 56.9 (10.0) | ||
| Sex (M, %) | 135 | 82 (60.7) | ||
| BMI (kg/m2) | 135 | 25.1 (3.3) | ||
| SBP (mmHg) | 131 | 125 (15) | ||
| DBP (mmHg) | 130 | 72 (10) | ||
| Duration of diabetes (years) | 135 | 8.6 (7.3) | ||
| Laboratory findings | ||||
| FPG (mg/dl) | 105 | 148 (42) | 134 (41) | 0.019 |
| PP1 (mg/dl) | 111 | 247 (72) | 218 (68) | 0.002 |
| HbA1c (%) | 135 | 8.1 (1.2) | 7.4 (1.3) | < 0.001 |
| C-peptide (ng/ml) ∗ | 118 | 2.20 (1.62–2.98) | 2.09 (1.59–3.03) | 0.423 |
| Total cholesterol (mg/dl) | 133 | 183 (43) | 157 (31) | < 0.001 |
| Triglyceride (mg/dl) | 133 | 154 (93) | 135 (69) | 0.014 |
| HDL (mg/dl) | 133 | 48 (22) | 47 (14) | 0.864 |
| LDL (mg/dl) | 133 | 105 (34) | 90 (28) | < 0.001 |
| Creatinine (mg/dl) ∗ | 132 | 0.80 (0.69–0.95) | 0.82 (0.68–0.96) | 0.406 |
| uACR (ug/mg) ∗ | 128 | 16.3 (4.4–51.3) | 19.7 (9.4–58.3) | 0.765 |
| HOMA2-IR | 95 | 2.07 (1.16) | 2.00 (1.16) | 0.962 |
| HOMA2%B | 95 | 68.49 (43.30) | 70.72 (31.81) | 0.323 |
| Combination therapy | ||||
| Biguanide (n, %) | 135 | 123 (91.1) | ||
| Sulfonylurea (n, %) | 135 | 72 (53.3) | ||
| TZD (n, %) | 135 | 14 (10.4) | ||
| AGI (n, %) | 135 | 18 (13.3) | ||
| Insulin (n, %) | 135 | 22 (16.3) | ||
| Diabetes-related complications | ||||
| Retinopathy (n, %) | 135 | 42 (31.1) | ||
| Nephropathy (n, %) | 132 | 18 (13.6) | ||
| Neuropathy (n, %) | 135 | 34 (25.2) |
† analyzed by the paired t-test for normally distributed variables, and by the Wilcoxon signed rank test for continuous variables with skewed distributions.
BMI, body mass index; FPG, fasting plasma glucose; PP1, post-prandial 1-hr glucose; HbA1c, glycated hemoglobin;SBP, systolic blood pressure; DBP, diastolic blood pressure; HDL, high-density lipoprotein; LDL, low-density lipoprotein; uACR, spot urine albumin/creatinine ratio; TZD, thiazolidinedione; AGI, alpha-glucosidase inhibitor; HOMA2%B, homeostasis model assessment of pancreatic beta-cell function; HOMA2-IR, homeostasis model assessment of insulin resistance.
Table 2.
| Characteristics | Responder | Non-responder | P – value† |
|---|---|---|---|
| n | 84 | 51 | |
| Age (years) | 57.1 (10.7) | 56.6 (8.9) | 0.792 |
| Sex (M/F) | |||
| BMI (kg/m2) | 24.9 (3.0) | 25.5 (3.8) | 0.267 |
| SBP (mmHg) | 123 (15) | 128 (16) | 0.069 |
| DBP (mmHg) | 72 (10) | 73 (10) | 0.640 |
| Duration of diabetes (months) | 7.8 (7.2) | 9.8 (7.3) | 0.118 |
| Follow-up duration (months) | 9.2 (1.8) | 8.6 (1.9) | 0.080 |
| FPG (mg/dl) | 154 (41) | 137 (41) | 0.047 |
| PP1 (mg/dl) | 245 (67) | 250 (79) | 0.700 |
| HbA1c (%) | 8.4 (1.2) | 7.7 (0.9) | 0.001 |
| C-peptide (ng/ml) ∗ | 2.33 (1.71–3.11) | 2.11 (1.54–2.73) | 0.172 |
| Total cholesterol (mg/dl) | 177 (39) | 194 (47) | 0.028 |
| TG (mg/dl) | 155 (92) | 152 (95) | 0.816 |
| HDL (mg/dl) | 46 (21) | 51 (23) | 0.259 |
| LDL (mg/dl) | 101 (35) | 112 (34) | 0.073 |
| Creatinine (mg/dl) ∗ | 0.81 (0.70–0.96) | 0.78 (0.65–0.95) | 0.112 |
| HOMA2%B | 66.15 (48.12) | 72.69 (33.20) | 0.437 |
| HOMA2-IR | 2.18 (1.27) | 1.88 (0.90) | 0.177 |
| Combination therapy | |||
| Metformin (n, %) | 76 (90.5) | 47 (92.2) | > 0.999 |
| Sulfonylurea (n, %) | 41 (48.8) | 31 (60.8) | 0.214 |
| TZD (n, %) | 11 (13.1) | 3 (5.9) | 0.249 |
| AGI (n, %) | 13 (15.5) | 5 (9.8) | > 0.999 |
| Insulin (n, %) | 8 (9.5) | 14 (27.5) | 0.008 |
† analyzed by the two-sample t-test for normally distributed variables, and by the Mann Whitney U-test for continuous variables with skewed distributions.
BMI, body mass index;SBP, systolic blood pressure; DBP, diastolic blood pressure; FPG, fasting plasma glucose; PP1, postprandial 1-hr glucose; HbA1c, glycated hemoglobin; TG, triglyceride; HDL, high-dense lipoprotein, HOMA2%B, homeostasis model assessment of pancreatic beta-cell function; HOMA2-IR, homeostasis model assessment of insulin resistance; TZD, thiazolidinedione; AGI, alpha-glucosidase inhibitor.


 PDF
PDF ePub
ePub Citation
 Print
Print


 XML Download