Abstract
Objective:
We conducted a study to investigate the normal range for TSH and within-individual variations of TSH according to temperat䴸re and aging.
Patients and Methods:
We enrolled patients who underwent periodic medical examinations five times over a six year period (2007.8~2013.6). Anthropometric data and thyroid ultrasonography were evaluated, and serum TSH, T3, and T4 were assayed.
Results:
Subjects were 19-64 years old, 120 were female, and 208 were male. Reference ranges for TSH were 0.53-4.94 mlU/L in the first test, 0.49-5.61 mlU/L in the second test, 0.46-6.06 mlU/L in the third test, 0.48-5.99 mlU/L in the fourth test, and 0.52-6.3 mlU/L in the fifth test. When the TSH level was analyzed according to temperature and sex, mean TSH was higher in months in which the average monthly temperatures were below 100C in Jinju, Gyeongnam and female. The aging and low temperatures are associated with increased serum TSH concentrations in the within-individual.
REFERENCES
1.Vanderpump MPJ., Tunbridge WMG. The epidemiology of thyroid diseases. Wemer and Ingbar's the Thyroid. 1996. 474–82.
2.Ladenson PW., Singer PA., Ain KB., Bagchi N., Bigos ST., Levy EG, et al. American thyroid association guidelines for detection of thyroid dysfunction. Arch Intern Med. 2000. 160:1573–7.

3.Andersen S., Pedersen KM., Bruun NH., Laurberg P. Narrow individual variations in serum T4 and T3 in normal subjects: A clue to the understanding of subclinical thyroid disease. J Clin Endocrinol Metab. 2002. 87:1068–72.
4.Sailer B., Broda N., Heydarian R., Gorges R., Mann K. Utility of third generation thyrotropin assays in thyroid function testing. Experimental and Clinical Endocrinology and Diabetes. 1998. 106:S29–33.
5.Hollowell JG., Staehling NW., Dana Flanders W., Harry Hannon W., Gunter EW., Spencer CA, et al. Serum TSH, T4, and thyroid antibodies in the United States population (1988 to 1994): National Health and Nutrition Examination Survey (NHANES ΙΠ). J Clin Endocrinol Metab. 2002. 87:489–99.
6.Wartofsky L., Dickey RA. The evidence for a narrower thyrotropin reference range is compelling. J Clin Endocrinol Metab. 2005. 90:5483–8.

7.Surks MI., Goswami G., Daniels GH. The thyrotropin reference range should remain unchanged. J Clin Endocrinol Metab. 2005. 90(9):5489–96.

8.American association of clinical endocrinologists medical guidelines for clinical practice for the evaluation and treatment of hyperthyroidism and hypothyroidism. Endocrine Practice. 2002. 8:457–69.
9.Vanderpump MPJ., Tunbridge WMG., French JM., Appleton D., Bates D., Clark F, et al. The incidence of thyroid disorders in the community: A twenty-year follow-up of the Whickham Survey. Clin Endocrinol (Oxf). 1995. 43:55–68.

10.Reed HL. Circannual changes in thyroid hormone physiology: the role of cold environmental temperatures. Arctic Med Res. 1995. 54:9–15.
11.Konno N., Morikawa K. Seasonal variation of serum thyrotropin concentration and thyrotropin response to thyrotropin-releasing hormone in patients with primary hypothyroidism on constant replacement dosage of thyroxine. J Clin Endocrinol Metab. 1982. 54:1118–24.

12.Leppaluoto J., Sikkila K., Has si J. Seasonal variation of serum TSH and thyroid hormones in males living in subarctic environmental conditions. Int J Circumpolar Health. 1998. 57:383–5.
13.Weeke J., Gundersen HJG. Circadian and 30 minutes variations in serum TSH and thyroid hormones in normal subjects. Acta Endocrinol. 1978. 89:659–72.

14.Parker DC., Pekary AE., Hershman JM. Effect of normal and reversed sleep wake cycles upon nyctohemeral rhythmicity of plasma thyrotropin: evidence suggestive of an inhibitory influence in sleep. J Clin Endocrinol Metab. 1976. 43:318–29.
15.Danel T., Touitou Y. Alcohol decreases the nocturnal peak of TSH in healthy volunteers. Psychopharmacology (Berl). 2003. 170:213–4.

16.Surks MI., Hollowell JG. Age-specific distribution of serum thyrotropin and antithyroid antibodies in the U.S. population: Implications for the prevalence of subclinical hypothyroidism. J Clin Endocrinol Metab. 2007. 92:4575–82.

18.Weeke A., Weeke J. The 24-hour pattern of serum TSH in patients with endogenous depression. Acta Psychiatr Scand. 1980. 62:69–74.

19.Haugen BR. Drugs that suppress TSH or cause central hypothyroidism. Best Practice and Research: Clinical Endocrinology and Metabolism. 2009. 23:793–800.

20.Nyrnes A., Jorde R., Sundsfjord J. Serum TSH is positively associated with BMI. Int J Obes. 2006. 30:100–5.

21.Chung GE., Kim D., Kim W., Yim JY., Park MJ., Kim YJ, et al. Non-alcoholic fatty liver disease across the spectrum of hypothyroidism. J Hepatol. 2012. 57:150–6.

22.YW C. Clinical implication od serum TSH concentration. Endocrinologyy and Metabolism. 2007. 22:87–94.
23.Jang YY., Kim CY., Hwang TY., Kim KD., Lee CH. Reference interval of serum thyroid hormones in healthy Korean adults. Journal of preventive medicine and public health = Yebang? ihakhoe chi. 2008. 41:128–34.

24.Lingjaerde O. Thyroid function in Seasonal Affective Disorder. J Affect Disord. 1995. 33:39–45.
25.Kim TH., Kim KW., Ahn HY., Choi HS., Won H., Choi Y, et al. Effect of seasonal changes on the transition between sub-clinical hypothyroid and euthyroid status. J Clin Endocrinol Metab. 2013. 98:3420.

26.Mariotti S., Franceschi C., Cossarizza A., Pinchera A. The aging thyroid. Endocr Rev. 1995. 16:686–715.

27.Atzmon G., Barzilai N., Hollow ell JG., Surks MI., Gabriely I. Extreme Longevity is associated with increased serum thyrotropin. J Clin Endocrinol Metab. 2009. 94:1251–4.

28.Boucai L., Surks MI. Reference limits of serum TSH and free T4 are significantly influenced by race and age in an urban outpatient medical practice. Clin Endocrinol (Oxf). 2009. 70:788–93.

29.Surks MI., Boucai L. Age- and race-based serum thyrotropin reference limits. J Clin Endocrinol Metab. 2010. 95:496–502.

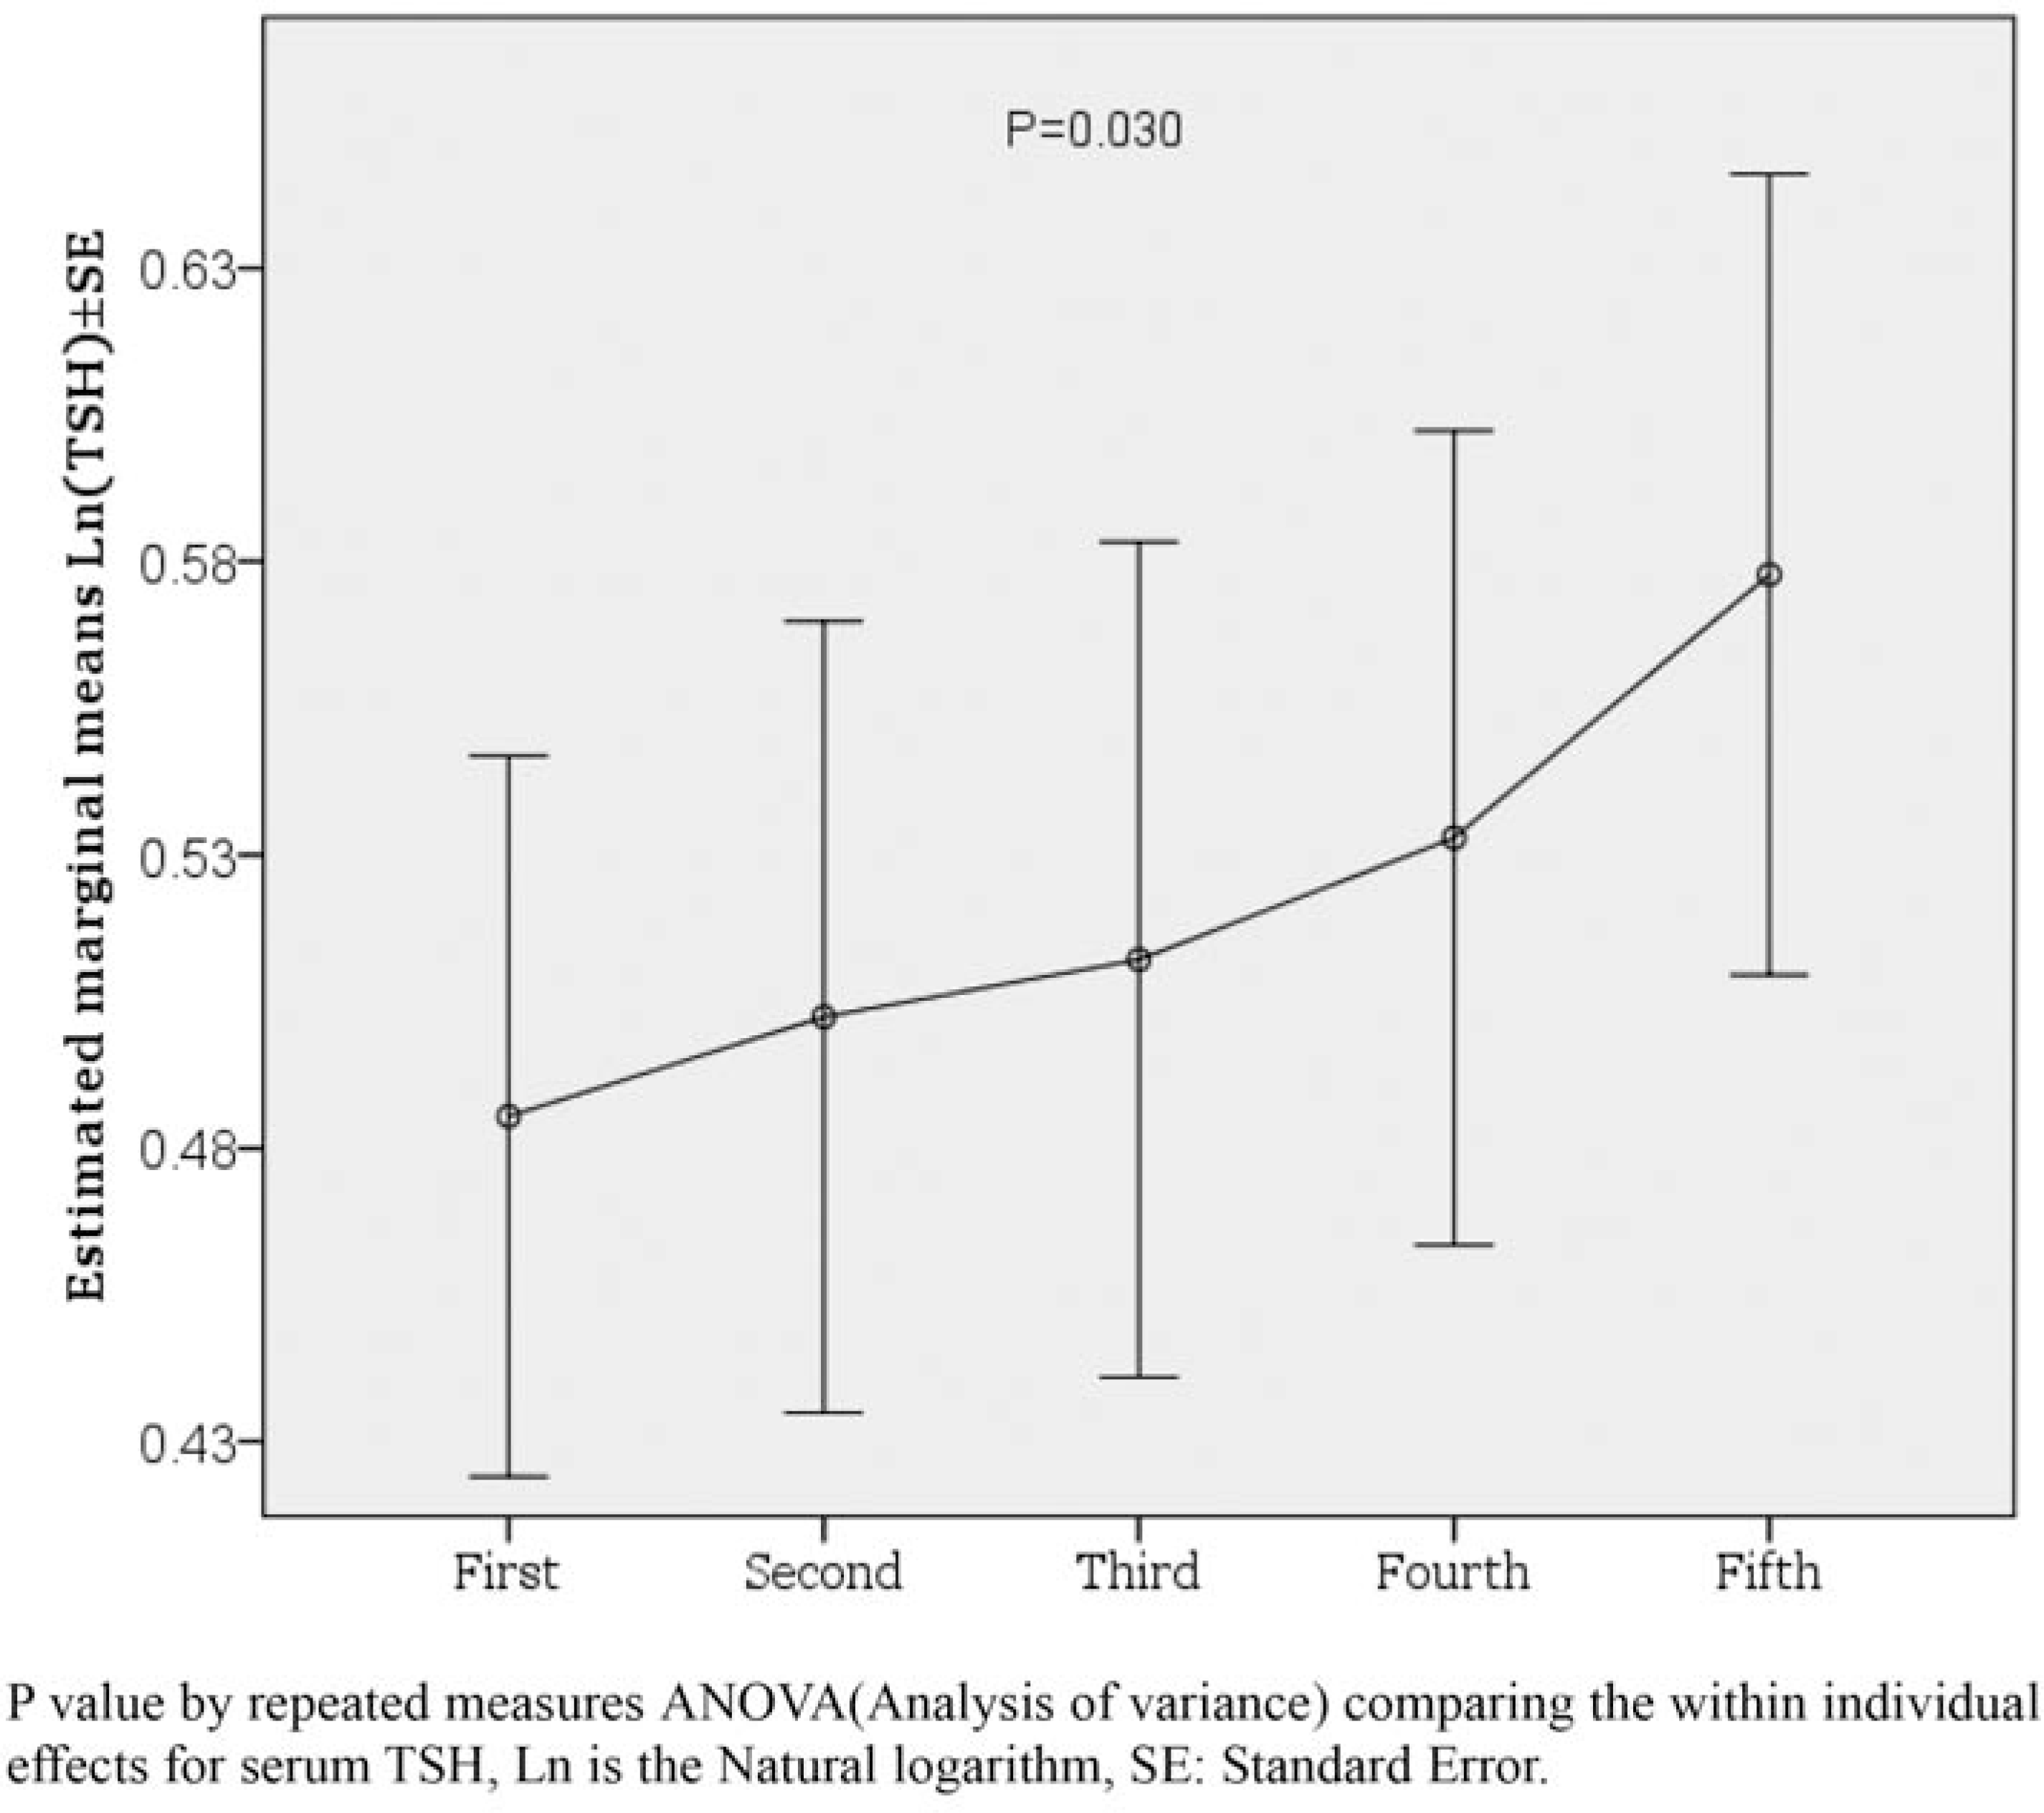
Fig.2
Estimated marginal means natural logarithm(TSH) 士 SE that was checked five times for six years

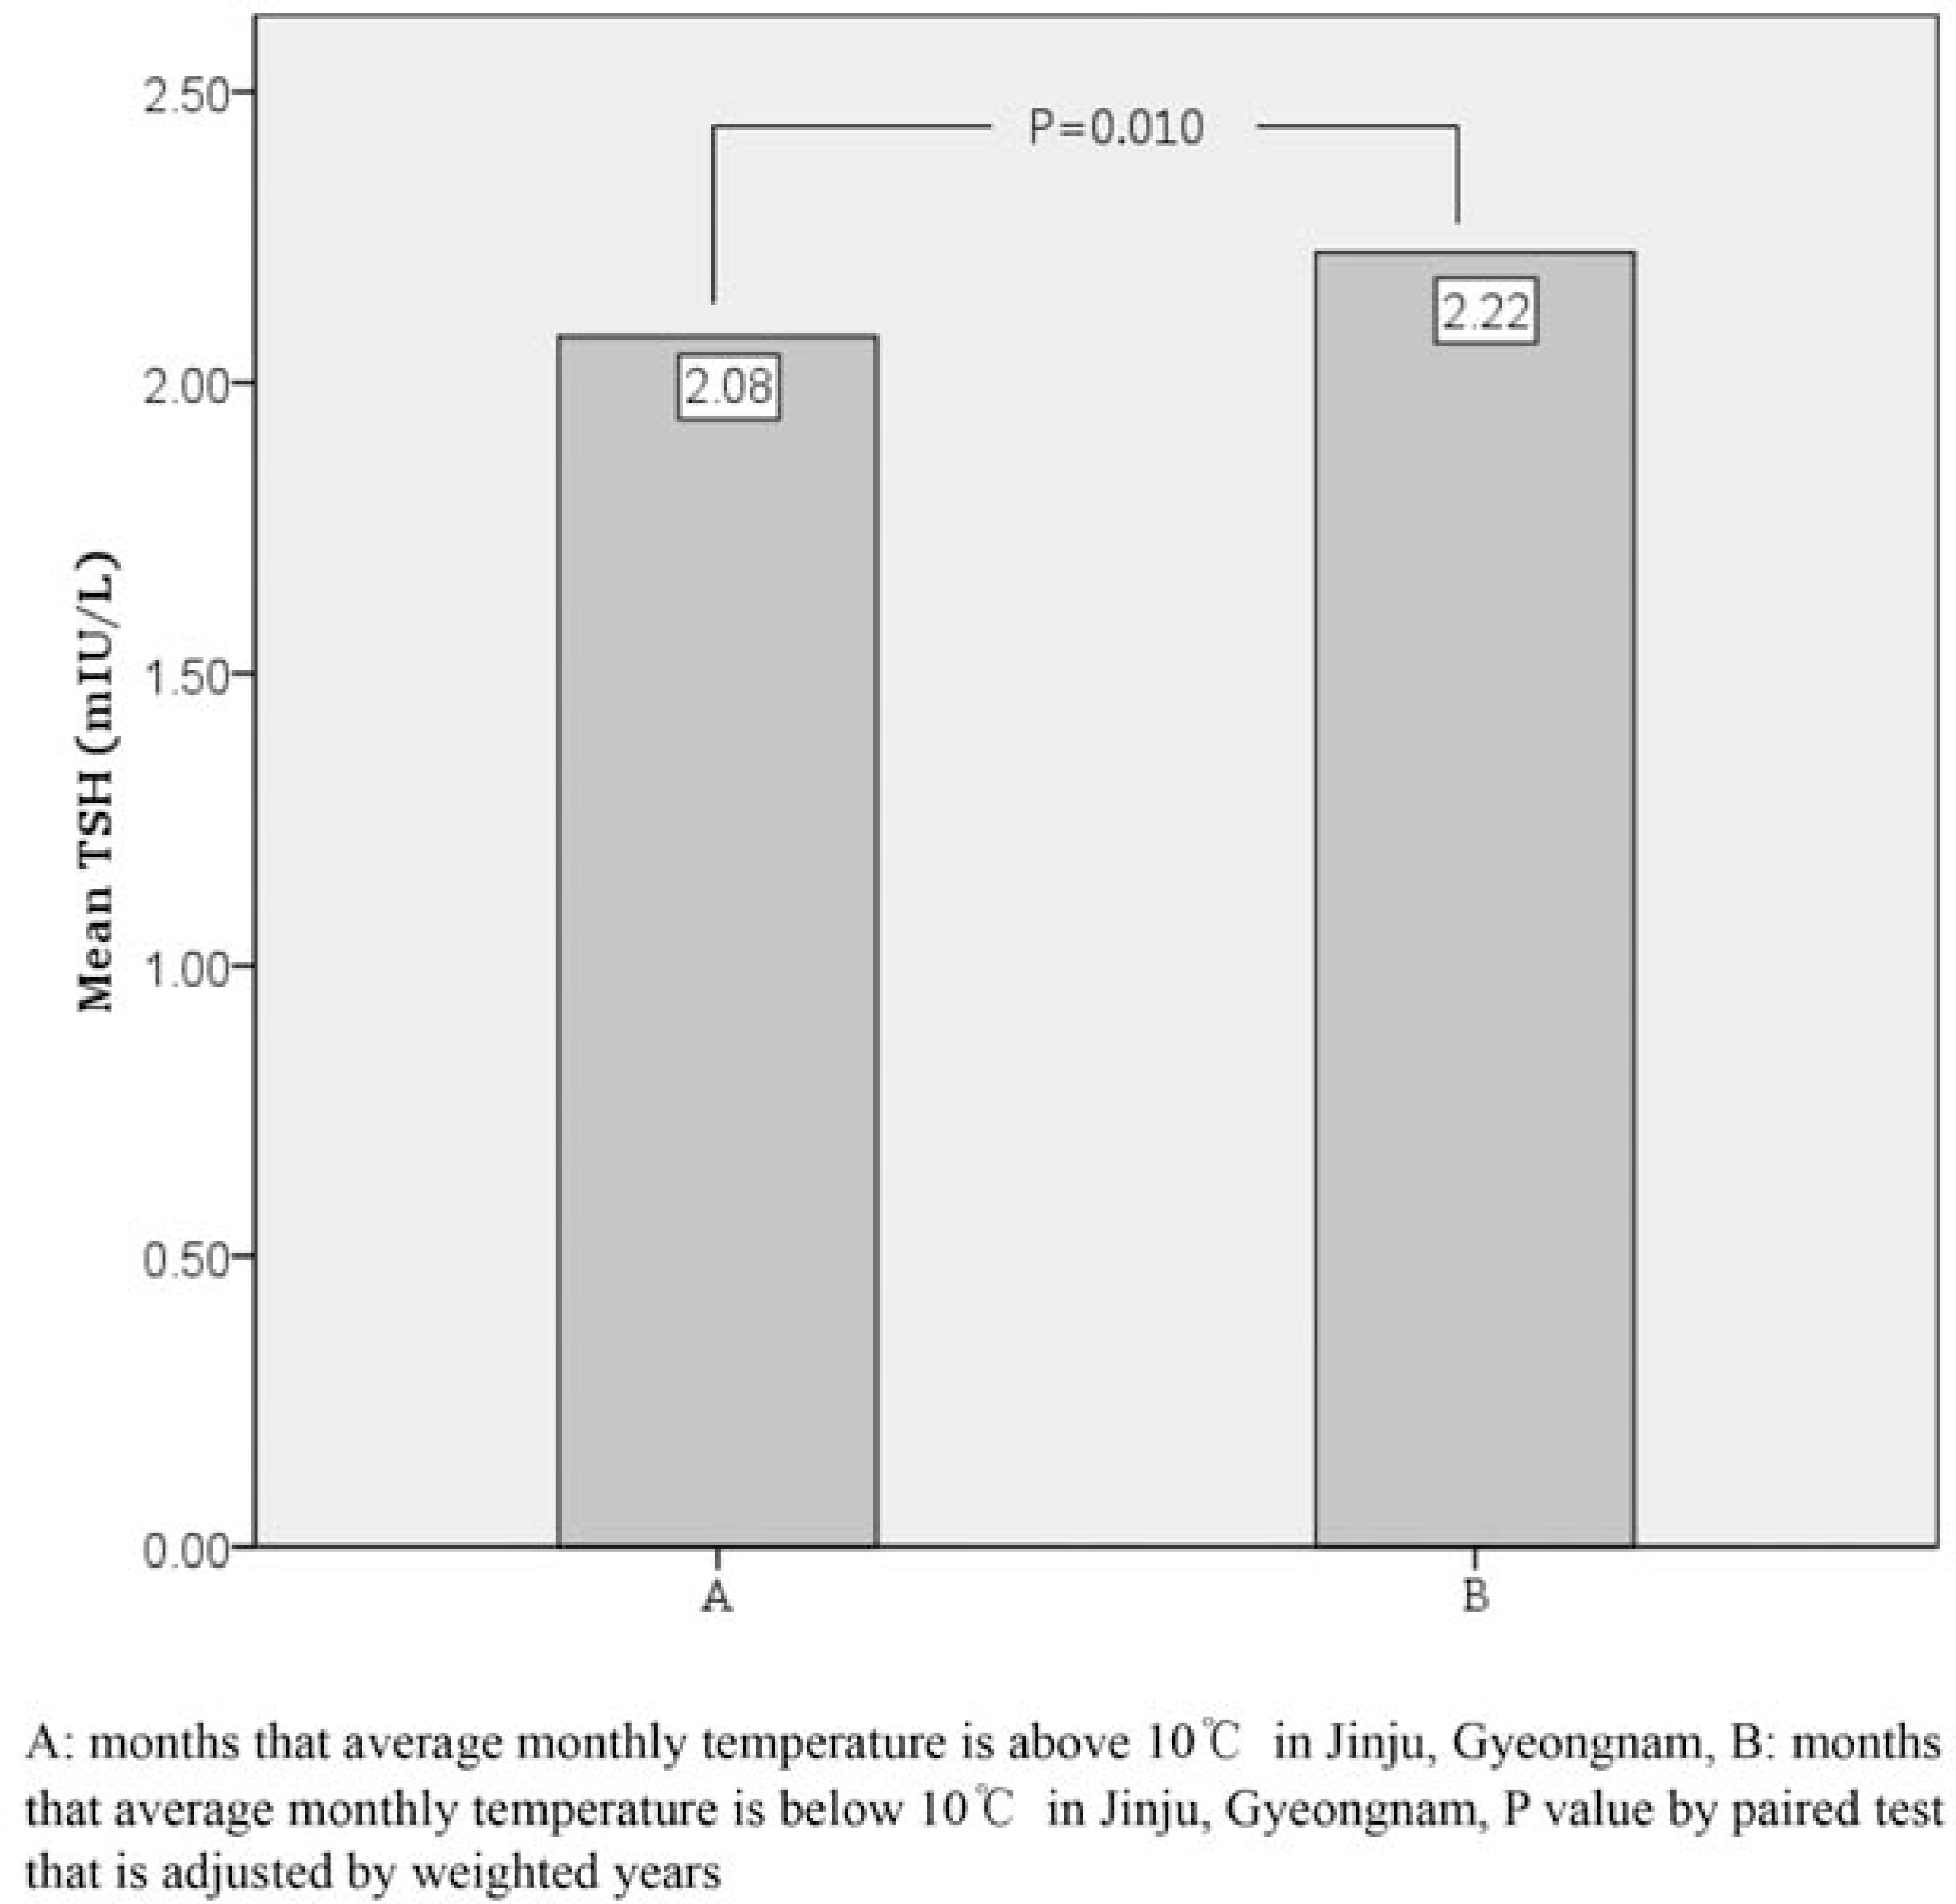
Fig, 3
Within-individual TSH levels separated by average monthly temperature(10iC) for 146 subjects.

Table 1.
Baseline characteristics of subjects in first check-up
Table 2.
Mean TSH and thyroid hormones values for each subject check-up.
| Sequence of tests | TFT(n=328) | ||
|---|---|---|---|
| T3(ng/dL) | T4(ug/dL) | T4(ng/dL) | |
| First | 107.2±15.6 | 7.55±1.24 | 1.29±0.16∗ |
| Second | 109.3±15.2 | 7.44±1.14 | 1.32±0.18† |
| Third | 109.5±16.9 | 7.54±1.18 | 1.32±0.17 |
| Fourth | 110.3±15.8 | 7.34±1.24 | 1,30±0.18 |
| Fifth | 108.2±15.9 | 7.67±1.29 | 1.29±0.15 |
Table 3.
Reference range of TSH values according to the serial check-ups.
| Sequence of tests | TSH reference range(mIU/L) | ||
|---|---|---|---|
| Lower limit | Mean | Upper limit | |
| First | 0.53 | 1.62 | 4.94 |
| Second | 0.49 | 1.65 | 5.61 |
| Third | 0.46 | 1.67 | 6.00 |
| Fourth | 0.48 | 1.70 | 5.99 |
| Fifth | 0.52 | 1.78 | 6.13 |
Table 4.
Mean TSH value according to gender, age stratum, thyroid nodules, alcohol intake, fatty liver, temperature, and BMI.
| Factors | TSH(mIU/L) | ||||
|---|---|---|---|---|---|
| First | Second | Third | Fourth | Fifth | |
| Age, year | 42.1±8.09 | 43.3±8.11 | 44.6±8.14 | 45.8±8.12 | 47.1±8.18 |
| Female(120) | 1.98±1.15 | 2.06±1.11 | 2.08±1.18 | 2.15±1.33 | 2.29±1.30∗ |
| Male(208) | 1.83±1.02 | 1.87±1.04 | 1.93±1.20 | 1.95±1.20 | 2.00±1.76∗ |
| Age stratum | |||||
| 30 내이하(131) | 1.86±0.95 | 1.87±1.03 | 1.88±1.04 | 1.92±1.03 | 2.01±0.98 |
| 40 내(139) | 1.89±1.16 | 1.99±1.05 | 2.05±1.30 | 2.05±1.23 | 2.09±1.27 |
| 50 내이성(58) | 1.94±1.11 | 1.96±1.21 | 2.08±1.26 | 2.20±1.22 | 2.38±1.59 |
| Nodule(-) | 1.90± 1.07(307) | 1.97±1.04(298) | 2.01±1.20(300) | 2.05±1.22(301) | 2.14±1.23(298) |
| Nodule(+) | 1.67± 1.06(21) | l.66±0.73(29) | 1.71±1.15(28) | 1.67±1.24(27) | 1.83± 1.22(30) |
| Alcohol | |||||
| Not intake(H7) | 1.B6±1.10 | 1.97±1.08 | 1.96±1.13 | 2.05±1.31 | 2.16±1.25 |
| <20g/day(102) | 1.90±1.07 | 1.90±1.05 | 1.97±1.16 | 2.08±1.27 | 2.09±1.18 |
| ≥20g/day(109) | 1.90±1.04 | 1.94±1.08 | 2.03±1.30 | 1.94±1.07 | 2.08±1.27 |
| Fatty Liver | |||||
| (-) | 1.90±1.07(277) | 1.97±1.09(259) | 2.02±1.24(259) | 2.06±1.20(24S) | 2.15±1.26(234) |
| (+) | 1.82±1.07(51) | 1.82±0.97(68) | 1.85±1.01{69) | 1.91±1.28(80) | 2.01±1.13(94) |
| 월평균 기온 | |||||
| A | 1.81±1.02†(239) | 1.84±1.04‡(231) | 1.95±1.18(237) | 2.05±1.27(230) | 2.06±1.21(228) |
| B | 2.10±1.16†(89) | 2.17±1.11‡(97) | 2.09±1.23(91) | 1.96±1.08(98) | 2.22±1.28(100) |
| BMI | |||||
| <23kg/m2 | 1.88±1.06(172) | 1.93±1.16(155) | 2.05±1.18(151) | 1.97±1.06(141) | 2.13±1.13(146) |
| 23-24 | 1.80±94(54) | 1.71±0.75(76) | 1.83±1.06(79) | 2.06±1.22(85) | 2.07±132(71) |
| ≥25kg/m2 | 1.96±1.14(100) | 2.12±1.17(95) | 2.01±1.31(97) | 2.10±1.22(102) | 2.10±1.23(110) |


 PDF
PDF ePub
ePub Citation
 Print
Print


 XML Download