

 PDF
PDF ePub
ePub Citation
 Print
Print


Abstract
There are considerable in vitro and in vivo evidences for remineralization and demineralization occurring simultaneously in incipient enamel caries. In order to "heal"the incipient dental caries, many experiments have been carried out to determine the optimal conditions for remineralization. It was shown that remineralization is affected by different pH, lactic acid concentrations, chemical composition of the enamel, fluoride concentrations, etc.
Eighty specimens from sound permanent teeth without demineralization or cracks, 0.15 mm in thickness, were immersed in lactic acid buffered demineralization solutions for 3 days. Dental caries with a surface zone and subsurface lesion were artificially produced. Groups of 10 specimens were immersed for 10 or 12 days in lactic acid buffered remineralization solutions consisting of pH 4.3 or pH 6.0, and 100, 50, 25, or 10 mM lactic acid. After demineralization and remineralization, images were taken by polarizing microscopy (x100) and micro-computed tomography. The results were obtained by observing images of the specimens and the density of the caries lesions was determined.
As the lactic acid concentration of the remineralization solutions with pH 4.3 was higher, the surface zone of the carious enamel increased and an isotropic zone of the subsurface lesion was found. However, the total decalcification depth increased at the same time.
In the remineralization solutions with pH 6.0, only the surface zone increased slightly but there was no significant change in the total decalcification depth and subsurface zone.
In the lactic acid buffer solutions with the lower pH and higher lactic acid concentration, there were dynamic changes at the deep area of the dental carious lesion.
Figures and Tables
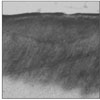
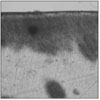
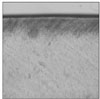
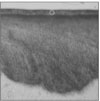 | Figure 1Polarizing microscopic observation of demineralized enamel. (Group 1, ×100)
The white circle indicates surface zone.
|
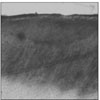
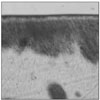
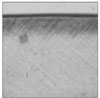
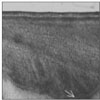 | Figure 2Polarizing microscopic observation of remineralized enamel with 100 mM lactic acid buffer. (pH 4.3 :Group 1)The white arrow indicates isotropic zone.
|
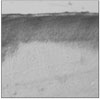
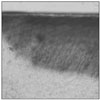
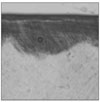
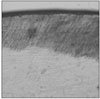
 | Figure 4Polarizing microscopic observation of remineralized enamel with 50 mM lactic acid buffer. (pH 4.3 : Group 2)
|
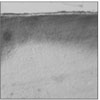
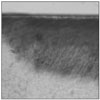
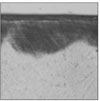
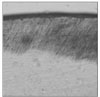
 | Figure 6Polarizing microscopic observation of remineralized enamel with 25 mM lactic acid buffer. (pH 4.3 : Group 3)
|
 | Figure 8Polarizing microscopic observation of remineralized enamel with 10 mM lactic acid buffer. (pH 4.3 : Group 4)
|
 | Figure 10Polarizing microscopic observation of remineralized enamel with 100 mM lactic acid butter. (pH 6.0:Group 5)
|
 | Figure 12Polarizing microscopic observation of remineralized enamel with 50 mM lactic acid buffer. (pH 6.0 : Group 6)
|
 | Figure 14Polarizing microscopic observation of remineralized enamel with 25 mM lactic acid buffer. (pH 6.0 : Group 7)
|
 | Figure 16Polarizing microscopic observation of remineralized enamel with 10 mM lactic acid buffer. (pH 6.0 : Group 8)
|
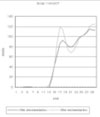
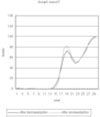
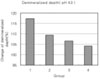 | Figure 17Demineralized depth at pH 4.3 solutions. (demineralized depth after remineralization/demineralized depth after demineralization) × 100 (%)
|
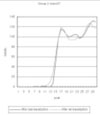
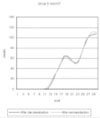
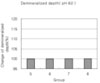 | Figure 18Demineralized depth at pH 6.0 solutions. (demineralized depth after remineralization/demineralized depth after demineralization) × 100 (%)
|
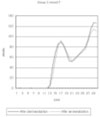
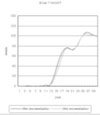
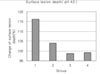 | Figure 19Surface lesion depth of dental carious in enamel at pH 4.3 solutions.(depth of surface lesion after remineralization/depth of surface lesion after demineralization) × 100 (%)
|
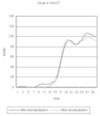
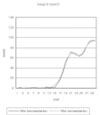
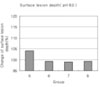 | Figure 20Surface lesion depth of dental carious in enamel at pH 6.0 solutions.-(depth of surface lesion after remineralization/depth of surface lesion after demineralization) × 100 (%)
|
 | Figure 21Comparison of density in enamel before and after remineralization with 100 mM lactic acid buffer by micro-CT. (pH 4.3 : Group 1)
|
 | Figure 22Comparison of density in enamel before and after remineralization with 50 mM lactic acid buffer by micro-CT. (pH 4.3 : Group 2)
|
 | Figure 23Comparison of density in enamel before and after remineralization with 25 mM lactic acid buffer by micro-CT. (pH 4.3 : Group 3)
|
 | Figure 24Comparison of density in enamel before and after remineralization with 10 mM lactic acid buffer by micro-CT. (pH 4.3 : Group 4)
|
 | Figure 25Comparison of density in enamel before and after remineralization with 100 mM lactic acid buffer by micro-CT. (pH 6.0 : Group 5)
|
 | Figure 26Comparison of density in enamel before and after remineralization with 50 mM lactic acid buffer by micro-CT. (pH 6.0 : Group 6)
|
 | Figure 27Comparison of density in enamel before and after remineralization with 25 mM lactic acid buffer by micro-CT. (pH 6.0 : Group 7)
|
References
1. Head JA. A study of saliva and its action on tooth enamel in reference to its hardening and softening. J Am Med Assoc. 1912. 59:2118–2122.

2. Anderson BG. Clinical study of arresting dental caries. J Dent Res. 1938. 17:443–452.
3. Backer Dirks O. Posterupted changes in dental enamel. J Dent Res. 1966. 45:503–511.
4. Brudevold F, McCann HG. Enamel solubility tests and their significance in regard to dental caries. Ann N Y Acad Sci. 1968. 153:20–51.
5. Christoffersen J, Arends J. Progress of artificial carious lesions in enamel. Caries Res. 1982. 16:433–439.
6. Aoba T, Okazaki M, Takahashi J, Moriwaki Y. X-ray diffraction study on remineralization using systhetic hydroxyapatite pellets. Caries Res. 1978. 12:223–230.
7. Sperber GH, Buonocore MG. Enamel surface in white spot formation. J Dent Res. 1963. 42:724–731.
8. Moreno EC, Zahradnik RT. Chemistry of enamel subsurface demineralization in vitro. J Dent Res. 1974. 53:226–235.
9. Featherstone JDB, Duncan JF, Cutress TW. A Mechanism for dental caries based on chemical process and diffusion phenomena during in-vitro caries simulation on human tooth enamel. Arch Oral Biol. 1979. 24:101–112.
10. Feagin F, Patel PR, Koulourides T, Pigman W. Study of the effect of calcium, phosphate, fluoride and hydrogen ion concentrations on the remineralization of partially demineralized human and bovine enamel surfaces. Arch Oral Biol. 1971. 16:535–548.
11. Featherstone JDB, Mellerg JR. Relative rates of progress of artificial caries lesions in bovine, ovine and human enamel. Caries Res. 1981. 15(1):109–114.
12. Margolis HC, Moreno EC, Murphy BJ. Effect of low levels of fluoride in solution on enamel demineralization. J Dent Res. 1986. 65:23–29.
13. Darling AI. Studies of the early lesions of enamel caries its nature, mode of spread and points of entry. Br Dent J. 1958. 8:119–135.
14. Silverstone LM, Wefel JS, Zimmerman BF, Clarkson BH, Featherstone MJ. Re-mineralization of natural and artificial lesions in human dental enamel in vitro effect of calcium concentration of the calcific fluid. Caries Res. 1981. 15:138–157.
15. Park JW, Hur B, Lee CY. The Effects of the Degree of Saturation of Acidulated Buffer Solutions in Enamel and Dentin Remineralization and AFM Observation of Hydroxyapatite Crystals. J Korean Acad Conserv Dent. 2000. 25:459–473.
16. Oh HS, Keum KY, Noh BD, Lee CY. The Influence of pH on the Formation of Artificial Root Caries in Acid Buffer Solution. J Korean Acad Conserv Dent. 1999. 24:495–502.
17. Lee CY. Artificial Caries Formation in Acid Buffering Solution. Yonsei Dent J. 1992. 7:34–41.
18. Gray JA, Francis MD. Physical chemistry of enamel dissolution, Mechanism of hard tissue distruction. 1963. Washington: American Association of Advances in Science;213. Publ, No 75.
19. Featherstone JDB, Duncan JF, Cutress TW. Crystallographic changes in human tooth enamel during in vitro caries simulation. Arch Oral Biol. 1978. 23:405–413.
20. Featherstone JDB, Rodgers BE, Smith MW. Physicochemical requirements for rapid remineralization of early carious lesions. Caries Res. 1981. 15:221–235.
21. Moreno EC, Margolis HC. Composition of Human plaque fluid. J Dent Res. 1988. 67:1181–1189.
22. Nikiforuk G. Fluoride dentifrices and fluoride rinses. Understanding dental caries. 1985. Vol. 11. Basel and New York: Karger;87–112. Prevention.
23. Han WS, Keum KY, Lee CY. The Influence of Fluoride on Remineralization of Artificial Dental Caries. J Korean Acad Conserv Dent. 1996. 21:161–173.
24. Kim MK, Keum KY, Lee CY. The Influence of pH on Remineralization of Artificial Dental Caries. J Korean Acad Conserv Dent. 1997. 22:193–208.
 XML Download