

 PDF
PDF ePub
ePub Citation
 Print
Print


I. INTRODUCTION
Proper performance of light curing unit is prerequisite to produce resin restorations with optimal physical properties and clinical results. The most common light-curing source used in dentistry is the Quartz Tungten Halogen (QTH) light1). Halogen light bulbs generate light by electrically heating tungsten thread to temperatures of some thousands of degrees centigrade2). Even though QTH lights have some reliability from their long history of clinical usage, their inherent drawbacks have been pointed out by numerous authors2-5,7). For example, the halogen bulbs have a limited life time of approximately 40 to 100 hours. In addition, reflector and filter degrade over time due to the high operating temperatures and the large quantity of heat which is produced during the duty cycles3).
To overcome the problems inherent to QTH, solid state light emitting diode (LED) technology has been proposed for curing light-activated dental materials4). The spectral output of gallium nitride blue LEDs falls conveniently within the absorption spectrum of the camphorquinone photoinitiator (400 - 500 nm) present in light-activated dental materials, so no filters are required in LED light curing unit (LCU)s. Furthermore, LEDs have an expected lifetime of several thousand hours without significant degradation of light emission over time5). However, LEDs can only polymerize the products utilizing camphorquinone as the photoinitiator since the spectral distribution of all currently available LEDs, except some third generation LEDs like Ultralume 5 which has wider spectral range, is narrow6,7). Also, speed of cure using LED is still inferior to Plasma Arc Curing (PAC) light.
Instead of a filament, PAC lights contain two tungsten electrodes separated by a small gap. High voltage is generated between electrodes. The resulting spark ionizes the gaseous environment (Xenon) and creates a conductive gas known as plasma8). Even with the optical losses of the waveguide, necessary because of the high voltage present at the bulb, higher light intensities can be obtained with PAC light2). The advent of the PAC light brought criticism from some researchers who felt that it cured resin too fast, and that subsequent damage to tooth structure and resin would result. However, PAC's speed of cure and the resultant immediate continuity of steps in any resin placement procedure are unequaled by other types of currently popular lights9).
There are numerous studies on PAC lights. Unfortunately however, there are few studies on bond strength of dentin bonding agents cured with PAC lights in restorative dentistry. Therefore, the purpose of this study was to analyze optical properties of PAC lights compared with Halogen and LED lights and to evaluate curing effectiveness of PAC lights by comparing shear bond strengths of dentin bonding agents cured with either PAC or LED lights. The hypothesis was that the bond strength of dentin bonding agents cured with PAC for 3 seconds would be lower than those of dentin bonding agents cured with either PAC for 6 seconds or LED for 10 seconds.
II. MATERIALS AND METHODS
1. Optic characterisitcs
Three commercially available lights were evaluated for their optic characteristics. Apollo 95E (DMT Systems, CA, USA), Elipar FreeLight 2 (3M ESPE, MN, USA) and VIP junior (Bisco, IL, USA) were selected to represent PAC, LED and QTH light, respectively. The guide tip diameter of Apollo 95E and Elipar Free Light 2 was 8 mm whereas that of VIP junior was 10 mm. The power outputs of each LCU were measured using EPM 1000 power meter with PM30 thermopile sensor (Molectron Detector Inc., Oregon, USA) which has a measuring wavelength range of 190 - 11,000 nm and a calibration uncertainty of 1%. The power output values were converted to the power density values (in mW/cm2) by dividing it with the area of the LCU light guide tip. The power densities obtained with EPM 1000 power meter were compared with the values reported by manufacturers and those measured with portable radiometers. Optilux (Kerr, CA, USA) was used as simple radiometer for Elipar FreeLight 2 and VIP Junior, and EFOS hand-held radiometer (EFOS Inc., Ontario, Canada) was used for Apollo 95E because Optilux could measure light intensity only up to 1000 mW/cm2.
The spectral distributions of the LCUs were obtained using MS 257 monochromator with Andor CCD array detector (Oriel Ins., CT, USA). The y-axis unit value of each LCU was determined by the equations between total irradiance value obtained by Molectron EPM 1000 and the integrated sum of the LCU's spectrum. The power densities in the ranges of 410 - 500 nm and 450 - 490 nm were obtained by integration of the spectrum in each range. Integration of the spectrum was performed using an Origin 7.0 program (Orignal lab Corporation, MA, USA). The calculation procedures are shown below.:
2. Shear bond strength test
135 freshly extracted caries free human third molars were collected, stored at 4℃ in 0.5% chloramine-T solution for 1 week and then in distilled water for no longer than 3 months until performing shear bond test. Cylinder shape acrylic molds were prefabricated. The dimensions for the mold were 25 mm in outer diameter and in height, and the dimensions for inner hole of the mold to accommodate tooth were 15 mm (diameter) and 10 mm (height). After the embedding procedure, the specimen (tooth in the mold) was allowed to sit for five minutes for exothermic reactions and stored in the distilled water.
The embedded teeth were sectioned through mid-crown parallel to their occlusal surface to expose the dentin surface using a low-speed diamond saw (Isomet, Buehler, IL, USA) under running water. The exposed dentin surface was polished with 500 grit silicon carbide papers under water irrigation using an automatic polishing machine (Rotopol-V, Struers, Glasgo, UK).
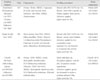
135 prepared specimens were randomly divided into 9 groups of 15 teeth. The 9 groups consists of 3 Dentin Bonding Agent(DBA)s cured with 3 curing modes. The 3 DBAs used in this study were a 3-step total etching DBA system, Scotchbond Multipurpose (MP, 3M ESPE, USA); a 2-step total etching DBA system, Single Bond 2 (SB, 3M ESPE, USA); and a 2-step self-etching DBA system, Clearfil SE Bond (SE, Kuraray Medical, Japan). The information and bonding procedures for each DBA are listed in Table 1 and the assignment for 9 groups is shown in Table 2.
Each DBA was applied on the middle of the exposed dentin surface according to manufacturer's recommendation, trying to confine the bonded area to be less than 6 mm diameter which is the outer diameter of the metal iris and cured with either Apollo 95E for 3 seconds, Apollo 95E for 6 seconds or Elipar FreeLight 2 for 10 seconds at a distance of 1 mm from the light guide tip. A Teflon-coated metal iris with a 3 mm internal diameter, 6 mm outer diameter and 1.5 mm height was used as a mold for composite. The metal iris, which was held in an acrylic cap, was pressed against the bonded dentin surface and the cavity made by iris was filled with the same manufacturer's composite corresponding to each DBA. This composite placed on the top of the previously cured DBA was cured with either Apollo 95E for 3 seconds, Apollo 95E for 6 seconds or Elipar FreeLight 2 for 20 seconds, with the light guide tip in direct contact with the metal iris. This specimen was allowed to sit for additional 4 minutes and stored in distilled water at room temperature for 24 hours before testing.
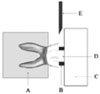
The specimens were loaded in shear mode to failure in a universal testing machine (LF Plus, Lloyd Instruments Ltd., Hampshire, UK) at a crosshead speed of 2 mm/minute by using a knife edged chisel that was pressed as close as possible to the edge of the metal iris adjacent to the bonded tooth surface. This technique is shown schematically in Figure 1. The shear bond strength was calculated in MPa by dividing the maximum load (Newtons) by the cross sectional area of the bonded surface. Following the shear bond strength test, all the fractured dentin surfaces were observed under Operating microscope (OPMI 111, Carl Zeiss, Germany) at × 21 magnification to determine their fracture modes. Some specimens were randomly selected, placed on the fielde-mission scanning electron microscopy (FE-SEM) stub followed by gold-sputter coating and were observed under FE-SEM (S-4700, Hitachi, Japan) to show illustrative FE-SEM shapes of the fractured dentin surfaces. Failure mode was classified into 4 types:
After the residual analysis which revealed the equality of variance, two-way analysis of variance was used to analyze whether there are differences in the shear bond strength. Differences among the groups were assessed using Bonferroni's multiple comparison tests. A probability value of < 0.05 was considered significant.
III. RESULTS
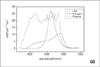
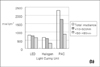
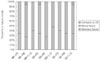
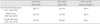
The light irradiance of the LCUs reported by manufacturers and measured in this study with hand-held radiometer and EPM 1000 is shown in Table 3. The spectral distributions of LCUs obtained with MS 257 monochromator are shown in Figure 2(a). The total area and the area in the region of 450 - 490 nm and 410 - 500 nm under each curve represent the total irradiance and irradiance in the corresponding region. The irradiance in each region is shown as graph in Figure 2(b).
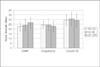
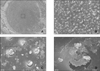
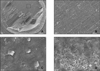
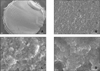
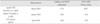
The means of shear bond strength were shown in Table 4 and Figure 3. There were significant differences in the mean values of shear bond strength among different DBAs (p < 0.001). However, there were no significant differences among the different LCUs (p > 0.05). The interaction between DBA and LCU was not significant. Failure modes of the fractured dentin surfaces are shown in Figure 4. The FE-SEM shapes of fractured specimens were shown in Figure 5(a), 5(b) and 5(c). Mixed failure was the most predominant failure mode followed by adhesive failure. There were only 3 cases of composite cohesive failures and no extensive dentin cohesive failure.
IV. DISCUSSION
There were some differences in measurements among those reported by manufacturers, read by hand-held radiometers and obtained by EPM 1000 as shown in Table 3. According to the measurements obtained by EPM 1000, the total irradiance of Apollo 95E was 2307 mW/cm2 which is 2.86 times higher than 805 mW/cm2 of Elipar FreeLight 2 and 3.42 times higher than 674 mW/cm2 of VIP Junior. The irradiances of Apollo 95E in the range of 410 - 500 nm and 450 - 490 nm were still higher than those of Elipar FreeLight 2 and VIP Junior in the respective regions even though the differences were smaller compared to those in total irradiance. LED is generally accepted to be wavelength efficient because it produces a narrower spectrum in an approximate wavelength range of 450 - 490 nm, delivering the greatest irradiance centered on a wavelength of approximately 470 nm which is close to absorption peak of camphorquinone3,10). However, since camphorquinone (most commonly used photoinitiators) has maximum absorbance at 470 nm but shows a somewhat broader absorption spectrum (400 - 500 nm) than a typical LED emission spectrum11,12), QTH curing may be more advantageous by allowing additional curing from wavelengths not present in LED units12). PAC may also have the advantage of curing photoinitiators other than camphorquinone since it shows a broad emission spectrum comparable to that of QTH. It is not yet fully understood what is the optimum wavelength range of the curing lights.
The shear bond strength test results in this study showed that light curing DBAs with either PAC for 3 seconds, PAC for 6 seconds or LED for 10 seconds did not make significant differences (P > 0.05). It was expected that the shear bond strength of DBAs cured with PAC for 3 seconds would be lower than those of DBAs cured with either PAC for 6 seconds or LED for 10 seconds because curing with PAC for 3 seconds produces the lowest energy density and because several studies13,14) reported that curing resin products with PAC for short time such as 3 seconds could produce improper cure. However, this study showed that even 3 second cure with PAC produced similar shear bond strength compared with LED for 10 seconds. The possible negative effect from polymerization shrinkage stress resulting from fast curing of PAC has been raised by some authors13,14). In this study the thickness of DBAs applied is thin enough and shrinkage stress could have been directed to bonded dentin surface thus minimizing negative effect to bond strength. The composite placed on top of DBA bonded to dentin was also not more than 1.5 mm thick, which the light from LCUs could penetrate without losing much effectiveness.
The optimum curing time and energy density to properly cure resin based products is not clearly established yet. Recently, Lindberg et al.15,16) reported that for resin composite, the exposure time per 2 mm increment may be reduced from 60 seconds to 20 seconds, and that with a 40 second exposure time, the increment thickness can be increased to 3.5 mm. With the advancements in light curing units and resin formulations including photoinitiators, it may be the right time to set a new standard for optimal curing time and energy density. Based on the shear bond strength test results of this study, it may be possible that as long as the energy density is above certain level, the increase of curing time does not substantially affect physical properties of cured resin products such as bond strength and that curing some resin based products including dentin bonding agents with PAC lights for 3 seconds is acceptable if careful precautions such as incremental layering not more than 1.5 mm are strictly followed.
SE Bond showed the highest shear bond strength in all three curing modes. However, it should be noted that all three DBAs used in this study showed shear bond strength more than 20 MPa which is considered clinically acceptable.
Although shear bond strength test method has been criticized for its uneven stress distribution and frequent dentin pull-out17-20), the popularity of this widely used test method remains unchanged owing to its relative simplicity20). In this test, modified chisel-on-iris method has been employed to produce reproducible results and minimize dentin pull-out as reported by Dickens and Milos21). Applying true shear force in shear test may not be possible. However, the "chisel-on-iris supported with the Teflon wall" design employed in this study seemed to be effective because it did produce reproducible results and no extensive dentin pull-out.
V. CONCLUSION
The shear bond strength test results in this study showed that light curing DBAs with either PAC for 3 seconds, PAC for 6 seconds or LED for 10 seconds did not make significant differences (P > 0.05).
Further studies on mechanical properties and clinical performance of DBAs cured with PAC light will be needed to determine minimum exposure time and proper curing method specifically with PAC lights.

 XML Download