

 PDF
PDF ePub
ePub Citation
 Print
Print


Abstract
In microradiograghic analysis, as the pH increased, the amount of remineralization in decalcified dentin tended to increase significantly. As the pH decreaced, deeper decalcification, however, occurred along with remineralization. The group of pH 5.5 had a tendency to be remineralized without demineralization (p < 0.05).
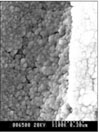
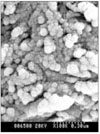
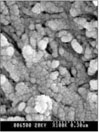
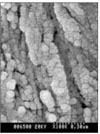
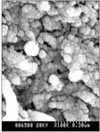
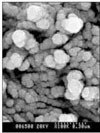
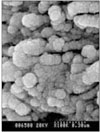
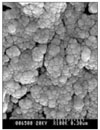
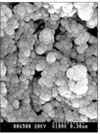
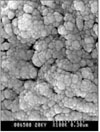
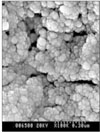
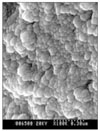
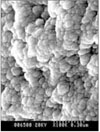
In SEM view, the remineralization in dentine caries occurred from the hydroxyapatite crystal surface surrounding the mesh of organic matrix, and eventually filled up the demineralized area.
5 days after remineralization, hydroxyapatite crystal grew bigger with deposition of inorganic substance in pH 4.3 and 5.0 group, and the crystal in the remineralized area appeared to return to normal. After 10 days, the crystals in group of pH 4.3 and 5.0, which grew bigger after 5 days of remineralization, turned back to their normal size, but in group of pH 5.5, some crystals were found to double their size.
Figures and Tables
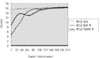 | Figure 1Quantitative mineral density change of dentin during de- & remineralization of pH 4.3 group.
|
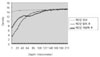 | Figure 2Quantitative mineral density change of dentin during de- & remineralization of pH 5.0 group.
|
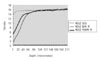 | Figure 3Quantitative mineral density change of dentin during de- & remineralization of pH 5.5 group.
|
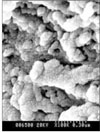
 | Figure 6SEM micrograph of the remineralizeddentin of pH 4.3 group at 30 µm area from the surface layer (× 100,000).
|
 | Figure 7SEM micrograph of the demineralized dentin of pH 4.3 group at 70 µm area from the surface layer (× 100,000).
|
 | Figure 8SEM micrograph of the remineralized dentin of pH 5.0 group at 50 µm area from the surface layer (× 100,000).
|
 | Figure 9SEM micrograph of the demineralized dentin of pH 5.0 group at 70 µm area from thesurface layer (× 100,000).
|
 | Figure 10SEM micrograph of the remineralized dentin of pH 5.5 group at 40 µm area from the surface layer (× 100,000).
|
 | Figure 11SEM micrograph of the remineralized dentin of pH 5.5 group at 70 µm area from the surface layer (× 100,000).
|
 | Figure 12SEM micrograph of the remineralized dentin of pH 4.3 group at 30 µm area from the surface layer (× 100,000).
|
 | Figure 13SEM micrograph of the remineralized dentin of pH 4.3 group at 70 µm area from the surface layer (× 100,000).
|
 | Figure 14SEM micrograph of the remineralized dentin of pH 5.0 group at 50 µm area from the surface layer (× 100,000).
|
 | Figure 15SEM micrograph of the remineralized dentin of pH 5.0 group at 70 µm area from the surface layer (× 100,000).
|
 | Figure 16SEM micrograph of the remineralized dentin of pH 5.5 group at 40 µm area from the surface layer (× 100,000).
|
 XML Download