Abstract
Background:
Voglibose is an α-glucosidase inhibitor. The purpose of this study was to evaluate the pharmacodynamic characteristics of voglibose for determining the appropriate study design and parameters for a pharmacodynamic equivalence study of voglibose.
Methods:
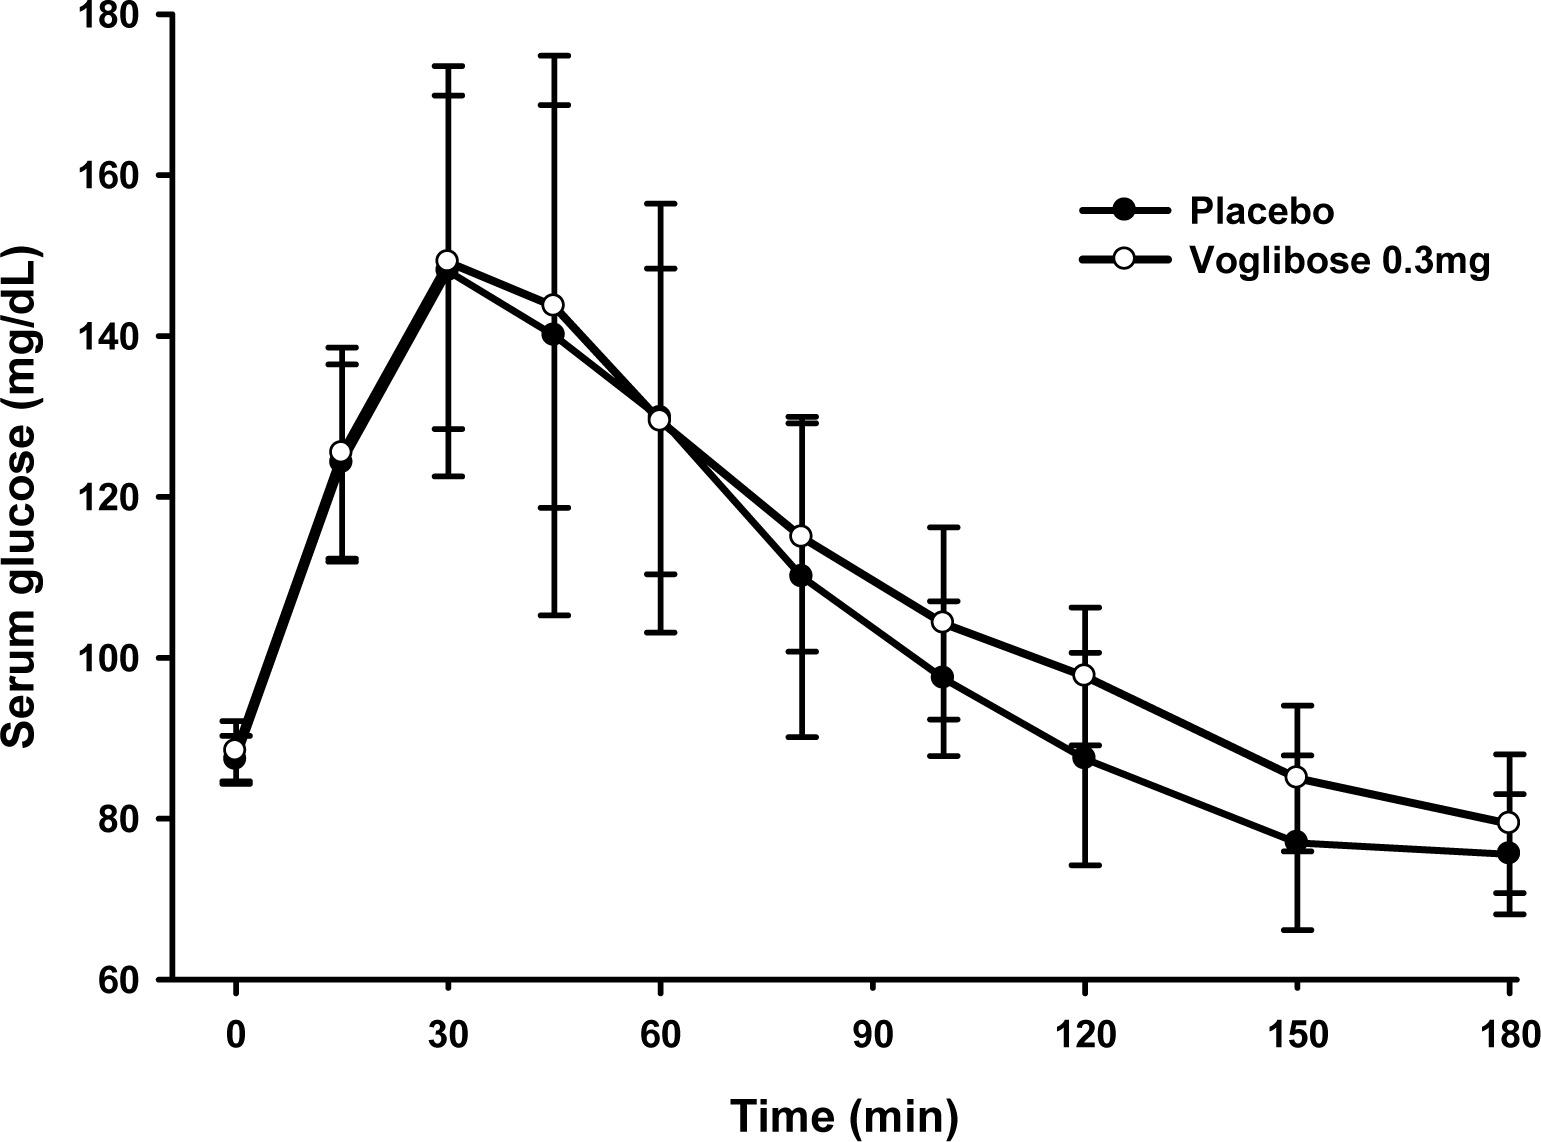
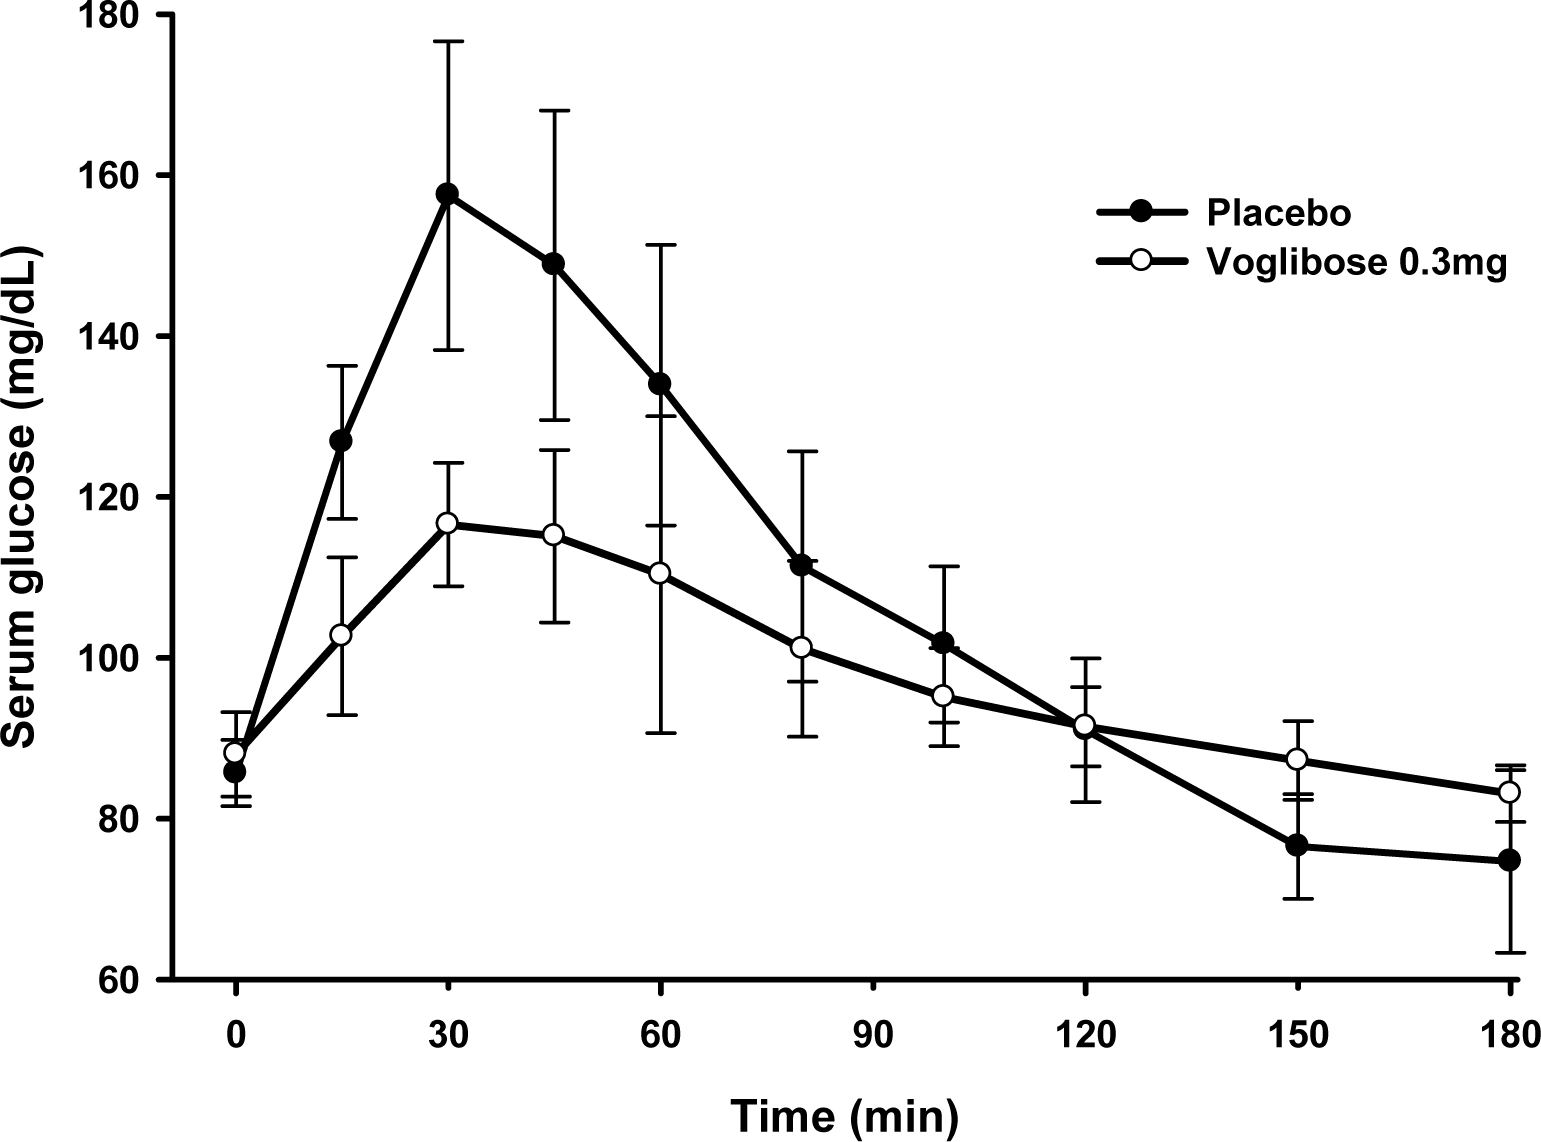
This study consisted of two studies. The single dose study had an open and single sequence design. Nineteen subjects received placebo and then one tablet of voglibose on two consecutive days with sucrose. The multiple dose study was performed with the similar design, except that it was a multiple dose of the single dose study. Nine subjects who showed an effective response in the single dose study received placebo three times and then voglibose 4 times on two consecutive days. Serial blood samples for pharmacodynamic parameters were taken until 180 mins after each administration. The baseline adjusted maximum serum glucose level (Gmax) and area under the serum glucose level-time profiles were determined and compared.
Results:
In the single dose study, the difference in Gmax was -10.6 ± 28.7 mg/dL. The area under the serum glucose concentration-time curve (AUGC0-1h) of placebo and voglibose were 7825.0 ± 1145.3 mg • min/dL, 7907.5 ± 917.2 mg • min/dL, respectively. In the multiple dose study, the difference in Gmax was 46.6 ± 16.1 mg/dL. The AUGC0-1h of placebo and voglibose were 8138.6 ± 721.9 mg • min/dL and 6499.7 ± 447.2 mg • min/dL, respectively. The Gmax and AUGC0-1h of the multiple dose study was significantly different between placebo and voglibose in paired t-test.
Go to : 
REFERENCES
1. Kim S.G., Choi D.S.The Present State of Diabetes Mellitus in Korea. J Korean Med Assoc. 2008; 51(9):791–798. (Korean).

2. Monnier L.Is postprandial glucose a neglected cardiovascular risk factor in type 2 diabetes? Eur J Clin Invest. 2000; 30(2):3–11.

3. Ishida H.[alpha-Glucosidase inhibitor]. Nihon Rinsho. 1999; 57(3):669–74.
4. Ryuzo Kawamori, Naoko Tajima, Yasuhiko Iwamoto, Atsunori Kashiwagi, Kazuaki Shimamoto, Kohei Kaku. Voglibose for prevention of type 2 diabetes mellitus: a randomised, double-blind trial in Japanese individuals with impaired glucose tolerance. Lancet. 2009; 373(9675):1607–1614.
5. KFDA, KFDA web sites on Bioequivalence test information. http://drug.mfds.go.kr/html/menuLinkBody.jsp?p_menuId=0201#1.[Online] (last visited 01 May 2013).
6. Ahr HJ, Boberg M, Krause HP, Maul W, Müller FO, Ploschke HJ, Weber H, Wünsche C. Pharmacokinetics of acarbose. Part I: Absorption, concentration in plasma, metabolism and excretion after single administration of [14C]acarbose to rats, dogs and man. Arzneimittel-Forschung. 1989; 39(10):1254–1260.
7. H. Fuder, P. Kleist, M. Birkel, A. Ehrlich, S. Emeklibas, W. Maslak, E. Stridde, N. Wetzelsberger, G. Wieckhorst, P.W. Lucker. The α-glucosidase inhibitor voglibose (AO-128) dose not change pharmacodynamics or pharmacokinetics of warfarin. Eur J Clin Pharmacol. 1997; 53:153–157.
8. Food and Drug Administration, Center of Drug Evaluation and Research (CDER). Guidance for Industry: Bioavailability and Bioequivalence Studies for Orally Administered Drug Products - General Considerations. 2003.
9. Food and Drug Administration. Center of Drug Evaluation and Research (CDER). Draft Guidance on Acarbose. 2009.
10. Bae JW, Jang CG, Lee SY. Methods for pharmacodynamic analysis and proposed protocols for bioequivalence study of acarbose. Yakhak Hoeji. 2007; 51(6):440–446.
11. Min Zhang, Jin Yang, Lei Tao, Lingjun Li, Pengcheng Ma, John Paul Fawcett. Acarbose Bioequivalence: Exploration of New Pharmacodynamic Parameters. AAPS J. 2012; 14(2):345–351.

12. Lee S, Chung JY, Hong KS, Yang SH, Byun SY, Lim HS, Shin SG, Jang IJ, Yu KS. Pharmacodynamic comparison of two formulations of Acarbose 100-mg tablets. J Clin Pharm Ther. 2012; 37(5):553–557.

13. Kageyama S, Nakamichi N, Sekino H, Nakano S. Comparison of the effects of acarbose and voglibose in healthy subjects. Clin Thera. 1997; 19(4):720–729.

14. kageyama S, Nakamichi N, Sekino H, Fujita H, Nakano S. Comparison of the effects of acarbose and voglibose on plasma glucose, endogenous insulin sparing, and gastrointestinal adverse events in obese subjects: a randomized, placebo-controlled, double-blind, three-way crossover study. Curr Ther Res. 2000; 61(9):630–645.

15. Food and Drug Administration. Center of Drug Evaluation and Research (CDER). Guidance for Industry. Diabetes Mellitus: Developing Drugs and Therapeutic Biologics for Treatment and Prevention (Draft). 2008.
16. John WG, Hillson R, Alberti SG. Use of haemoglobinA1c (HbA1c) in the diagnosis of diabetes mellitus. The implementation of World Health Organisation WHO guidance 2011. Practical Diabetes. 2012; 29(1):12–12a.
Go to : 
 | Figure 1.Mean (SD) serum glucose concentration-time curve after single administration of placebo and voglibose. |
 | Figure 2.Mean (SD) serum glucose concentration-time curve after multiple administration of placebo and voglibose. |
Table 1.
Demographic data of subjects
| Single administration (N=19) | Multiple administration (N=9) | |
|---|---|---|
| Age, years | 24.7 ± 3.5 | 24.4 ± 4.4 |
| Height, cm | 176.0 ± 4.8 | 173.8 ± 3.0 |
| Weight, kg | 71.2 ± 11.6 | 66.6 ± 14.0 |
Table 2.
Pharmacodynamic parameters after single administration (N=19)
Table 3.
Pharmacodynamic parameters after multiple administration (N=9)


 PDF
PDF ePub
ePub Citation
 Print
Print


 XML Download