

 PDF
PDF ePub
ePub Citation
 Print
Print


Abstract
Background:
Methods:
Results:
REFERENCES
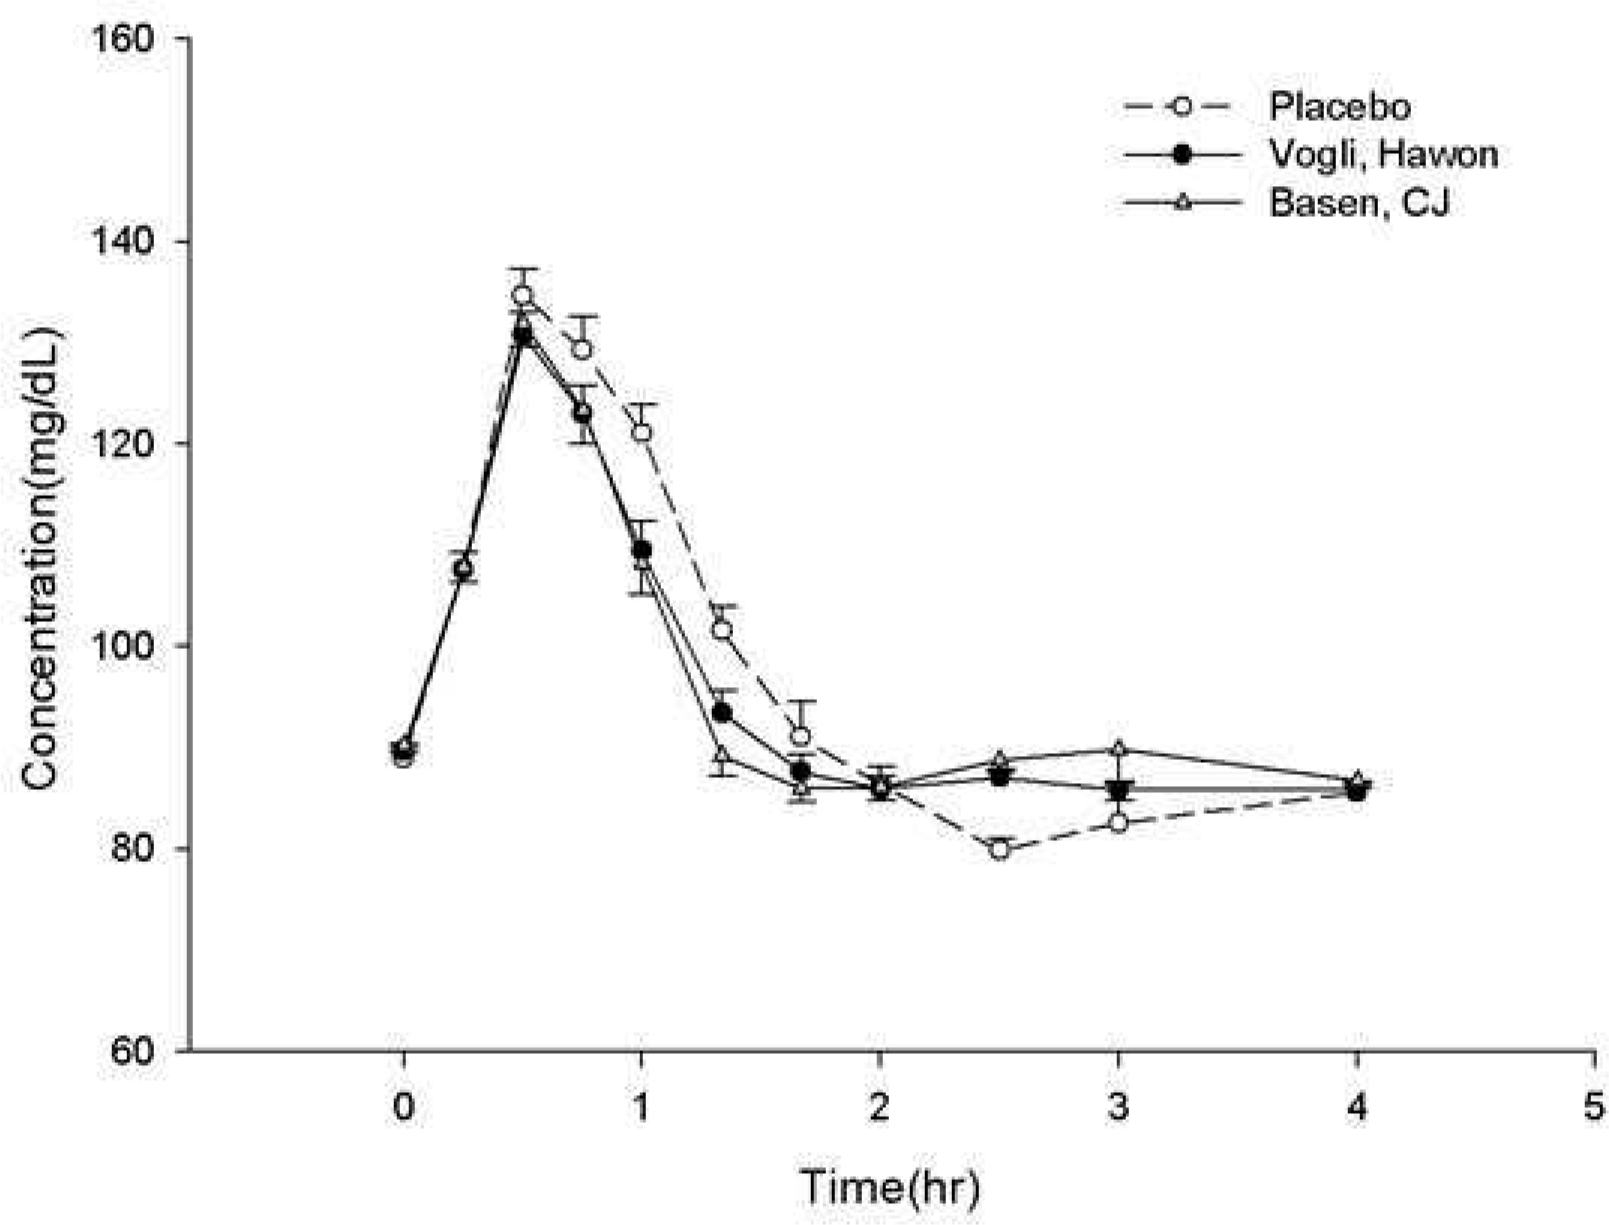
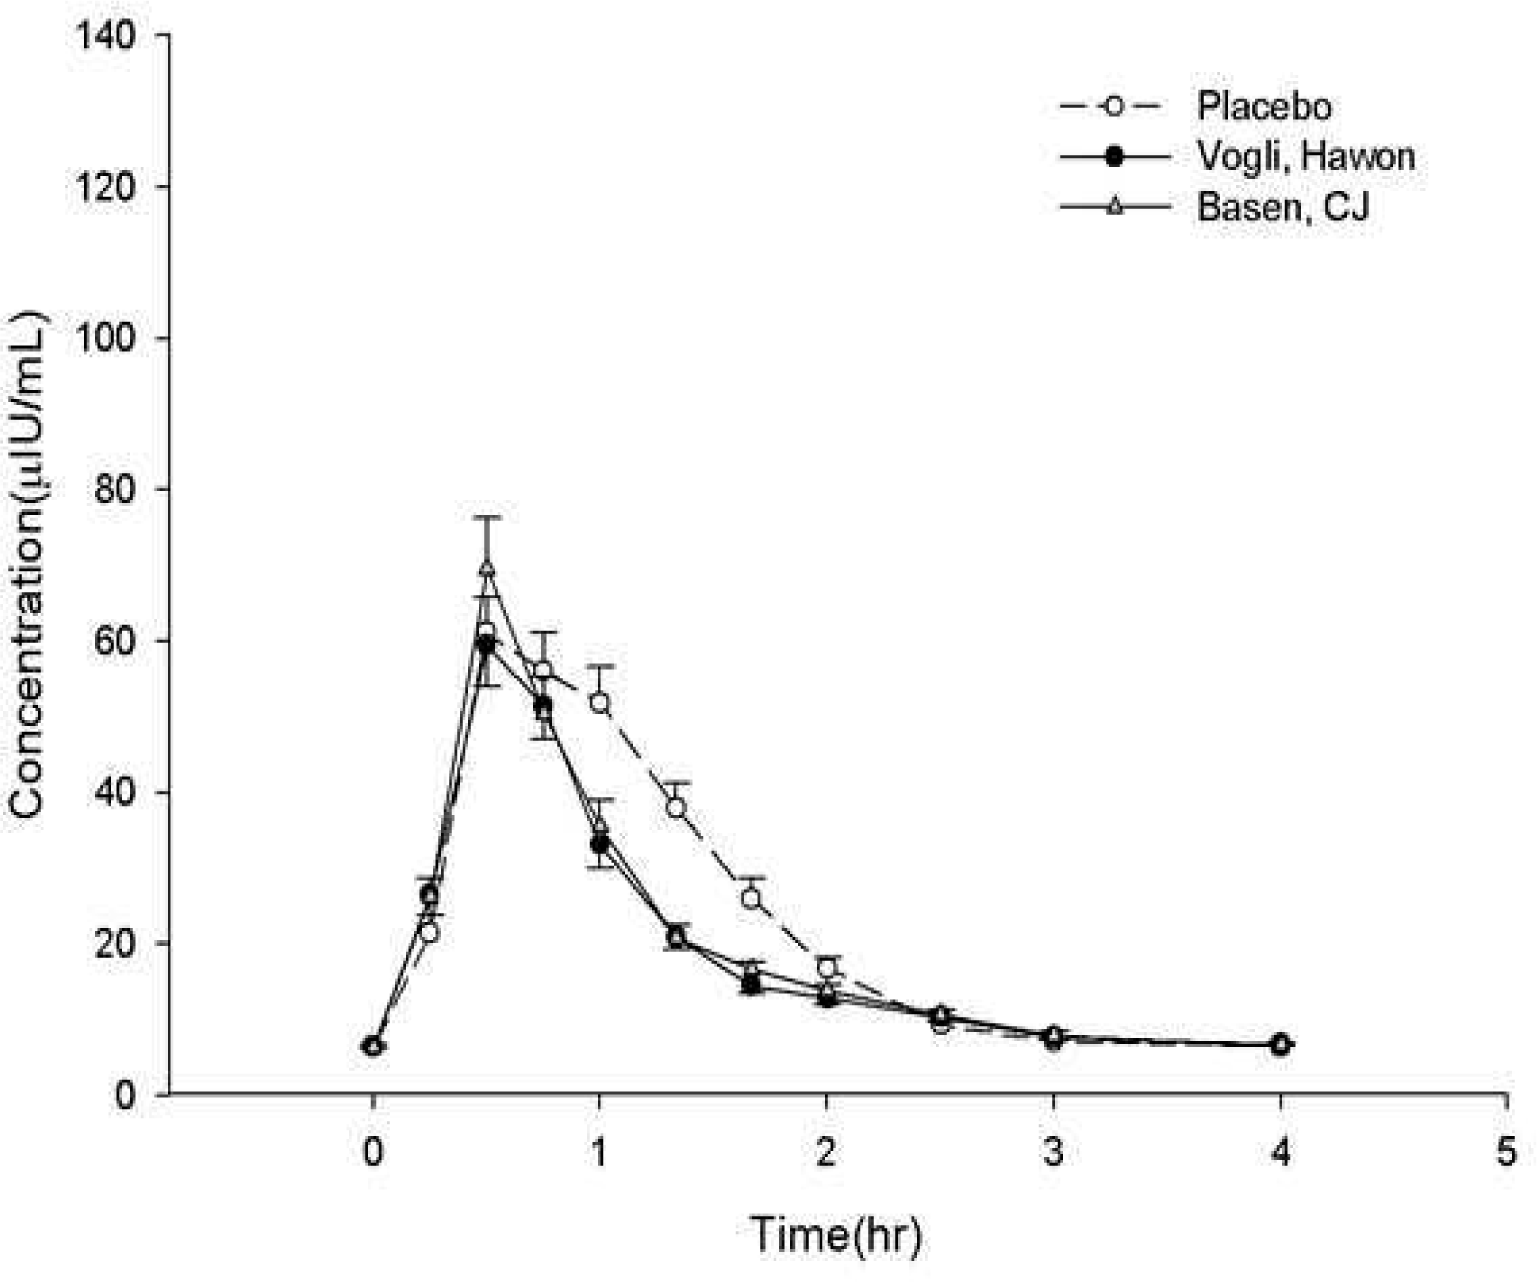
Table 1.
Table 2.
Table 3.
* Maximum serum glucose concentration. †Area under the serum glucose versus time curve from dosing to 2 hours post-dose. ‡ Area under the serum glucose versus time curve from dosing to 4 hours post-dose. § Maximum serum insulin concentration. ¶ Area under the serum insulin versus time curve from dosing to 2 hours post-dose. ¶ Area under the serum insulin versus time curve from dosing to 4 hours post-dose.
Table 4.
* Maximum serum glucose concentration. † Area under the serum glucose versus time curve from dosing to 2 hours post-dose. ‡ Area under the serum glucose versus time curve from dosing to 4 hours post-dose. § Maximum serum insulin concentration. ¶ Area under the serum insulin versus time curve from dosing to 2 hours post-dose. ¶ Area under the serum insulin versus time curve from dosing to 4 hours post-dose.
 XML Download