Abstract
Background:
Erlotinib is a tyrosine kinase inhibitor prescribed for the treatment of non-small cell lung cancer and pancreatic cancer. The aim of this study was to compare the safety and pharmacokinetics (PK) of a generic (test) formulation of erlotinib with those of a reference formulation in healthy volunteers.
Methods:
A randomized, open-label, single-dose two-treatment, two-period, two-sequence, crossover study was conducted in Clinical Trials Center, Chungnam National University Hospital with 40 healthy men. Subjects orally received either one 150 mg tablet of the test or the corresponding dose of the reference, and crossover phases were separated by 14-day washout. Plasma samples were collected up to 72 hr post-dose. Plasma erlotinib concentrations were determined by liquid chromatography-tandem mass spectrometry. PK parameters were calculated by non-compartmental analysis. The safety was monitored throughout the study.
Results:
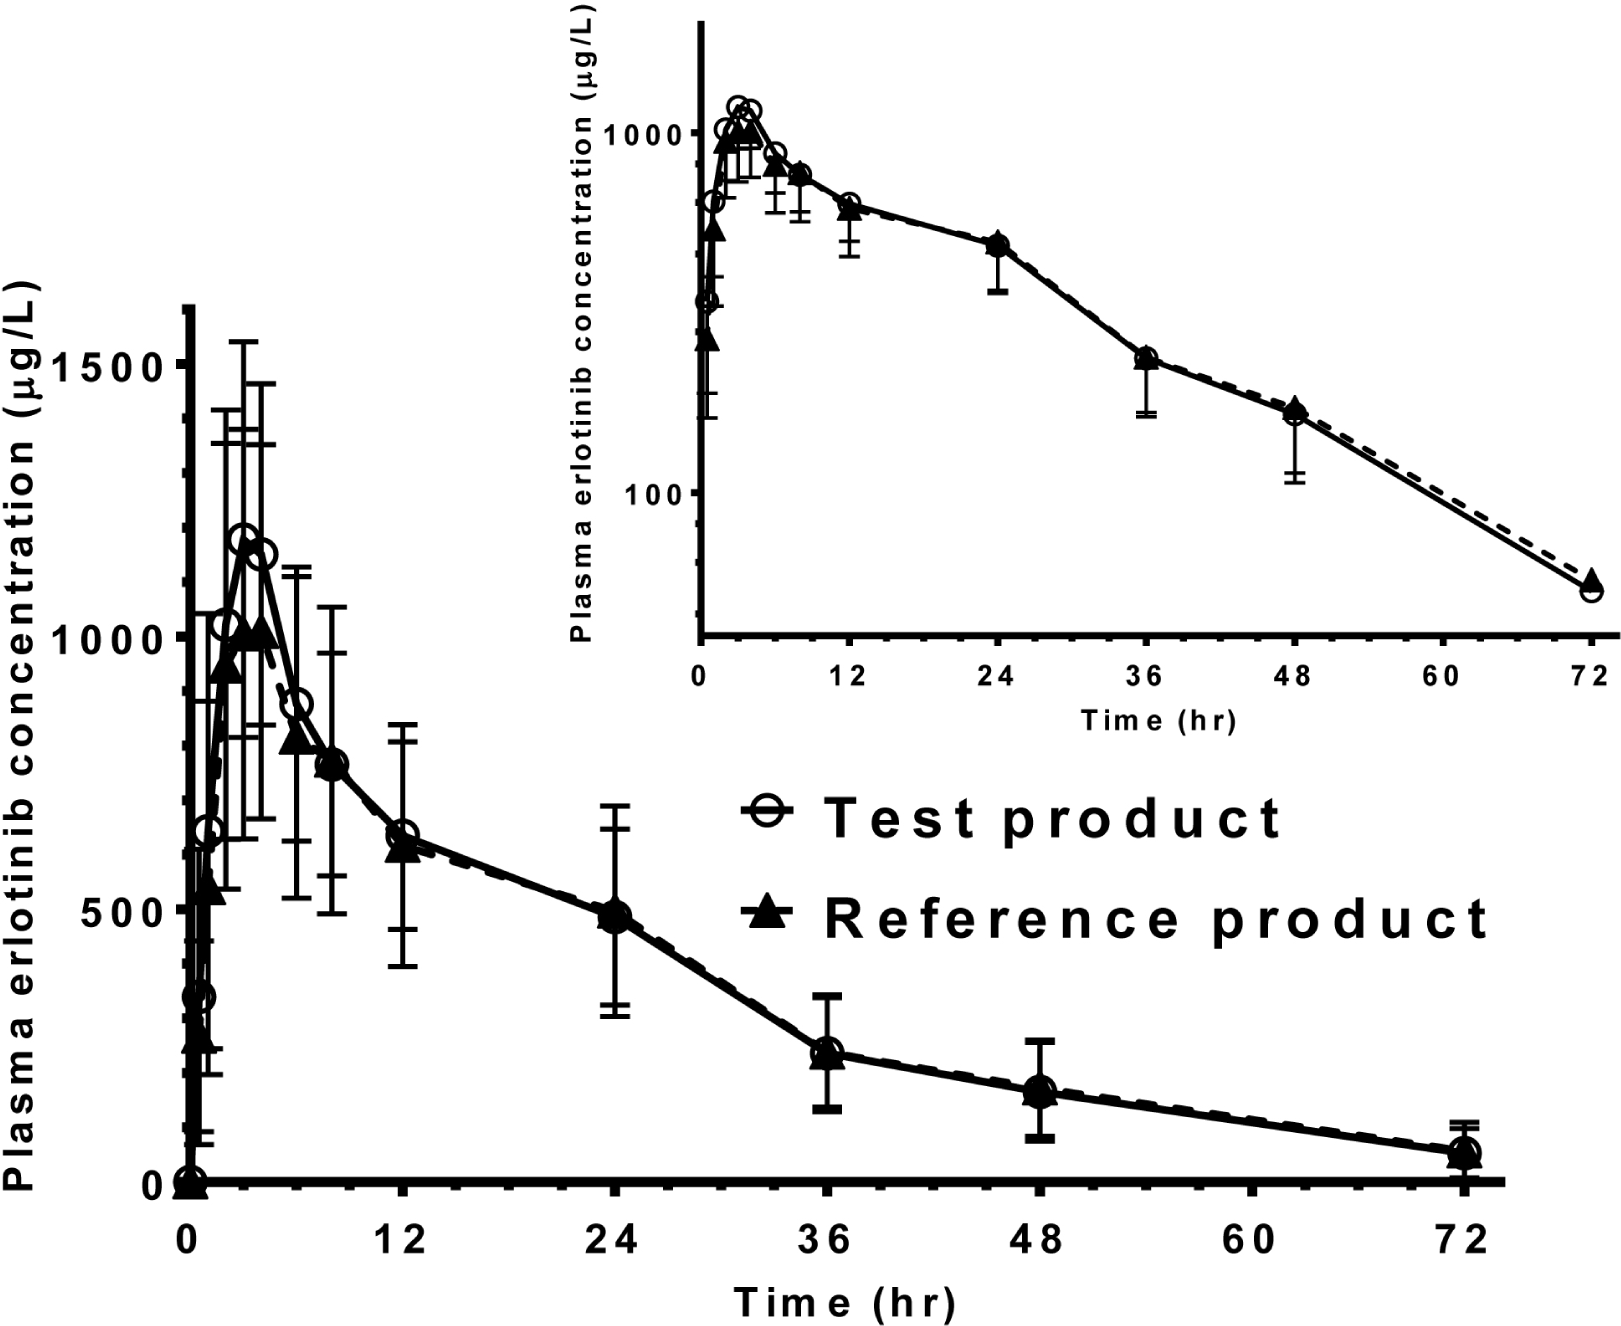
A total of 21 cases of adverse events were reported. They are mild and relieved without an intervention. There was no serious adverse event. Median times to peak concentration of two formulations were 3.0. Means [SD] for peak concentration (Cmax) and area under the plasma concentration-time curve (AUC) of the test were 1,298 [346] µg/L and 25,318 [7,668] hr×µg/L. Those of the reference were 1,193 [378] µg/L and 24,853 [8,419] hr×µg/L. Geometric mean ratios (90 % confidence intervals) for the test to the reference were 1.10 (1.02 - 1.18) for Cmax and 1.02 (0.97 - 1.09) for AUC.
Go to : 
REFERENCES
1. TARCEVA (erlotinib) Prescribing Information. 2013. Astellas Pharma US, Inc., and Genetech, Inc..
2. Cassidy J, Twelves C, Cameron D, Steward W, O’Byrne K, Jodrell D, Banken L, Goggin T, Jones D, Roos B, Bush E, Weidekamm E, Reigner B. Bioequivalence of two tablet formulations of capecitabine and exploration of age, gender, body surface area, and creatinine clearance as factors influencing systemic exposure in cancer patients. Cancer Chemother Pharmacol. 1999; 44(6):453–460.

3. Frohna P, Lu J, Eppler S, Hamilton M, Wolf J, Rakhit A, Ling J, Kenkare-Mitra SR, Lum BL. Evaluation of the absolute oral bioavailability and bioequivalence of erlotinib, an inhibitor of the epidermal growth factor receptor tyrosine kinase, in a randomized, crossover study in healthy subjects. J Clin Pharmacol. 2006; 46(3):282–290.

4. Nikolova Z, Peng B, Hubert M, Sieberling M, Keller U, Ho YY, Schran H, Capdeville R. Bioequivalence, safety, and tolerability of imatinib tablets compared with capsules. Cancer Chemother Pharmacol. 2004; 53(5):433–438.

5. Parrillo-Campiglia S, Ercoli MC, Umpierrez O, Rodriguez P, Marquez S, Guarneri C, Estevez-Parrillo FT, Laurenz M, Estevez-Carrizo FE. Bioequivalence of two film-coated tablets of imatinib mesylate 400 mg: a randomized, open-label, single-dose, fasting, two-period, two-sequence crossover comparison in healthy male South American volunteers. Clin Ther. 2009; 31(10):2224–2232.

6. Cantarini MV, McFarquhar T, Smith RP, Bailey C, Marshall AL. Relative bioavailability and safety profile of gefitinib administered as a tablet or as a dispersion preparation via drink or nasogastric tube: results of a randomized, open-label, three-period crossover study in healthy volunteers. Clin Ther. 2004; 26(10):1630–1636.

7. Cantarini MV, Macpherson MP, Marshall AL, Robinson AV, Bailey CJ. A phase I study to determine the effect of tamoxifen on the pharmacokinetics of a single 250 mg oral dose of gefitinib (IRESSA) in healthy male volunteers. Cancer Chemother Pharmacol. 2005; 56(6):557–562.
8. Chhun S, Verstuyft C, Rizzo-Padoin N, Simoneau G, Becquemont L, Peretti I, Swaisland A, Wortelboer R, Bergmann JF, Mouly S. Gefitinib-phenytoin interaction is not correlated with the C-erythromycin breath test in healthy male volunteers. Br J Clin Pharmacol. 2009; 68(2):226–237.
9. Draft Guidance on Bioequivalence Studies for Anticander Agents. 2011. Pharmaceutical Safety Bureau, Korea Food & Drug Administration.
10. Hsuan FC. Estimating treatment means in a mixed-effect ANOVA model for bioequivalence studies. Biometrics. 1993; 49(3):703–713.

Go to : 
 | Figure 1.Mean plasma erlotinib concentration versus time profiles after single oral administration of test products (open circles) and reference products (closed triangles) made of erlotinib 150 mg to 37 healthy volunteers (lower left: linear scale, upper right: log-linear scale). |
Table 1.
Subject demography
Table 2.
Comparison of pharmacokinetic parameters by formulation


 PDF
PDF ePub
ePub Citation
 Print
Print


 XML Download