

 PDF
PDF ePub
ePub Citation
 Print
Print


Abstract
Background:
Levodropropizine is non-opioid agent whose peripheral antitussive action may result from its modulation of sensory neuropeptide levels. Currently, levodropropizine 60 mg is taken three-times daily. A controlled release formulation of levodropropizine (levodropropizine CR) 90 mg was developed, which can be taken twice daily. The aim of this study was to evaluate the safety and pharmacokinetic characteristics after multiple oral administrations of levodropropizine CR 90 mg tablets in healthy male volunteers.
Methods:
A randomized, open-label, cross-over study was conducted in 24 healthy male volunteers. Each subject received levodropropizine syrup 60 mg three times daily or levodropropizine CR 90 mg twice daily for 3 days. Blood samples for pharmacokinetic analysis were collected pre-dose and up to 24 hours on day 4. Pharmacokinetic analysis was conducted by non-compartmental method. Safety assessments including monitoring adverse events, laboratory tests, vital signs, physical examinations and ECGs were performed throughout the study.
Results:
A total of 20 male volunteers completed the study. The maximum steady-state plasma concentration (Css,max) of levodropropizine syrup and levodropropizine CR were 313.28 ng/mL and 285.31 ng/mL and time to reach Css,max (Tmax,ss) were 0.48 hr and 0.88 hr, respectively. The area under the concentration-time curve to the last measured concentration of two groups were 2345.36 hr × ng/mL and 2553.81 hr × ng/mL, respectively. There was no serious adverse event.
Conclusion:
Levodropropizine CR 90 mg tablet was safe and well-tolerated when administered twice daily for 3 days. No statistically significant differences were seen in Css,max and AUCss,24hr between the two formulations. This study provided pharmacokinetic evidences that the twice-daily dosing regimen of levodropropizine 90 mg may substitute the conventional 3-times-daily regimen of levodropropizine 60 mg.
Go to : 
REFERENCES
1. Daffonchio L, Clavenna G, Fedele G, Omini C. Levodropropizine. Drugs Today. 1995; 31(31):299–305.
2. Folkerts G, van der Linde HJ, Omini C, Nijkamp FP. Virus-induced airway inflammation and hyperresponsiveness in the guinea-pig is inhibited by levodropropizine. Naunyn Schmiedebergs Arch Pharmacol. 1993; 348(2):213–219.

3. Schildmann EK, Rémi C, Bausewein C. Levodropropizine in the Management of Cough Associated with Cancer or Nonmalignant Chronic Disease-A Systematic Review. J Pain Palliat Care Pharmacother. 2011; 25(3):209–218.
4. Tang Y, Zhao L, Wang Y, Fawcett JP, Gu J. Rapid and sensitive liquid chromatography - tandem mass spectrometry method for the quantitation of levodropropizine in human plasma. J Chromatogr B Analyt Technol Biomed Life Sci. 2005; 819(1):185–189.
5. Yan L, Li T, Zhang R, Xu X, Zheng P. HPLC determination and steady-state bioavailability study of levodropropizine sustained-release tablets in dogs. Arch Pharm Res. 2006; 29(6):514–519.
6. Fumagalli G, Cordaro CI, Vanasia M, Balzarotti C, Camusso L, Caiazzo G, Maghini L, Mazzocchi M, Zennaro M. A comparative study of the antitussive activity of levodropropizine and dropropizine in the citric acid-induced cough model in normal subjects. Drugs Exp Clin Res. 1992; 18(7):303–309.
Go to :
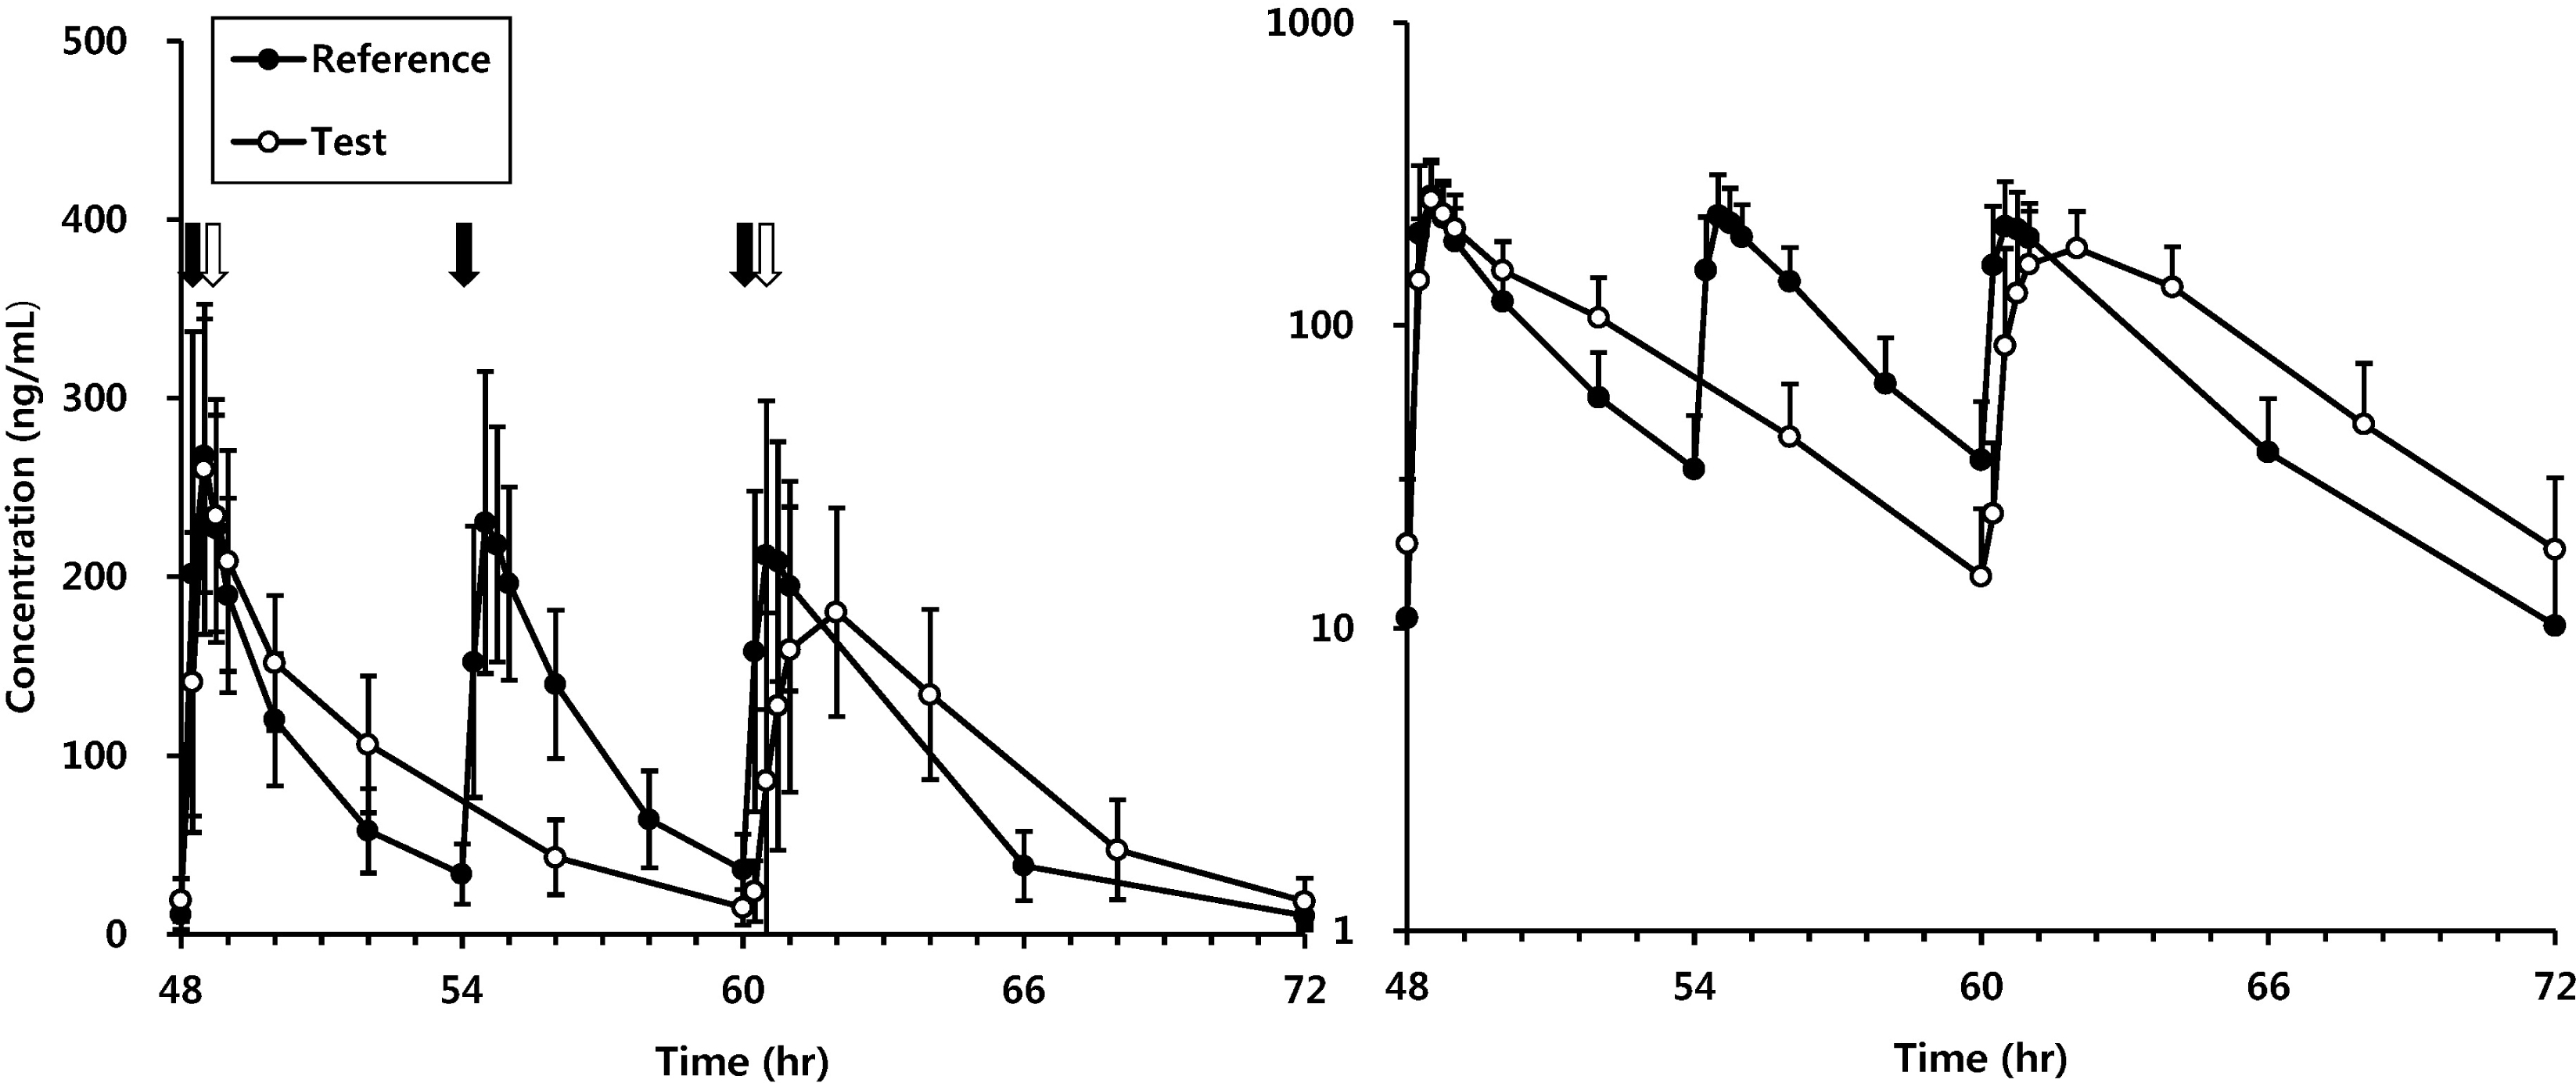 | Figure 1.Mean plasma concentrations of levodropropizine. Left and right panel are normal and semi-logarithmic plot of concentration-time curves, respectively. Black and white arrows mean dosing events of reference and test drug, respectively (Reference drug: Levodropropizine syrup 60 mg, Test drug: Levodropropizine CR 90 mg). |
Table 1.
Demographic data of subjects (Mean ± SD)
Table 2.
Pharmacokinetic parameters
*Css,max: maximum observed concentration at steady-state. Css,min: minimum observed concentration at steady-state. Css,av: average concentration at steady-state. AUCss,24hr: area under the concentration-time curve from 0 h to 24 h at steady-state. AUCss.inf: area under the concentration-time curve from 0 h to infinite at steady-state. Tmax,ss: time of maximum observed concentration. Tmax, ss is presented as median and range and calculated from time after dose. Fluctuation: peak trough fluctuation within one dosing interval at steady state. † Levodropropizine syrup 60 mg ‡ Levodropropizine CR 90 mg.
Table 3.
Analysis of Variance (ANOVA) of pharmacokinetic parameters for levodropropizine
 XML Download