Journal List > J Korean Soc Clin Pharmacol Ther > v.21(2) > 1055119

Rhee, Shin, Cha, Kim, Oh, Cho, Yu, Jang, Chung, and Lim: Pharmacokinetic Characteristics of Cefcapene Pivoxil Hydrochloride after Single Oral Administration in Healthy Korean Subjects

Abstract

Background:

Cefcapene pivoxil hydrochloride (CFPN-PI) is an oral ester cephalosporin antibiotic with a broad spectrum. In this study, we investigated the pharmacokinetics (PK) and tolerability of CFPN-PI following single oral administration in healthy Korean subjects.

Methods:

An open label, dose escalation, parallel group study was conducted in 18 healthy male volunteers. A single dose of CFPN-PI was administered to 6 subjects in each treatment group of 100, 150 and 200 mg. Serial blood and urine samples were collected up to 12 h and 24 h after dosing, respectively. Plasma and urine concentrations of cefcapene were measured by HPLC-UV. PK parameters were estimated using non-compartmental analysis. For the safety evaluation, adverse event monitoring, clinical laboratory tests and physical examination were performed throughout the study.

Results:

Median values of time to peak plasma concentration were observed around 1.5 to 2.0 h. Maximum plasma concentrations (Cmax) were 1.04 ± 0.22, 1.24 ± 0.46 and 1.56 ± 0.43 mg/L (mean ± SD), and area under the plasma concentration time curve (AUCinf) were 2.94 ± 0.46, 3.97 ± 1.28 and 4.70 ± 1.19 h*mg/L in 100, 150 and 200 mg dose groups, respectively. The differences of dose normalized Cmax and AUCinf among three groups were not statistically significant. The fractions of drug excreted in urine unchanged were 31.5 % - 42.9 %. There were no serious adverse events or clinically significant abnormalities related to CFPN-PI.

Conclusion:

CFPN-PI was well tolerated with single oral administration and showed a linear PK property within 100 - 200 mg in healthy Korean male subjects.

REFERENCES

1. Cazzola M. Novel oral cephalosporins. Exper Opin Investig Drugs. 2000; 9(2):237–246.
crossref
2. Totsuka K, Shimizu K, Konishi M, Yamamoto S. Metabolism of S-1108, a new oral cephem antibiotic, and metabolic profiles of its metabolites in humans. Antimicrob Agents Chemother. 1992; 36(4):757–761.
crossref
3. Neu HC, Gu JW, Fang W, Chin NX. In vitro activity and susceptibility to hydrolysis of S-1006. Antimicrob Agents Chemother. 1992; 36(6):1336–1341.
crossref
4. Speciale A, Caccamo F, Blandino G, Giacchi GT, Aleo G, Nicoletti G. Cefetamet pivoxil: comparable evaluation with other orally available antibiotics against selected species of respiratory pathogens. Chemotherapy. 1996; 42(1):1–10.
crossref
5. Choo EJ, Kwak YG, Lee MS, Jeong J-Y, Choi S-H, Kim NJ, Kim YS, Woo JH, Ryu J. In vitro antimicrobial activity of cefcapene against clinical isolates. Infect Chemother. 2005; 37(3):133–137. (Korean).
6. Kuwahara K, Yokota T. S-1006, the active form of S-1108: its in vitro antibacterial activity. Japanese Journal of Chemotherapy. (in Japanese). 1993; 41(S-1):30–39.
7. Nomura K, Doi M, Yoshida T. S-1108, a new oral cephem antibiotic: stability against β -lactamases and affinity for penicillin-binding proteins. Jpn J Chemother. 1993; 41(S-1):102–108.
8. Saito A, Hiraga Y, Watanabe A, Saito A, Shimada K, Kobayashi H, Odagiri S, Miki F, Soejima R, Oizumi K, Hara K, Nakashima M, Sasaki S. Comparative clinical study of cefcapene pivoxil and cefteram pivoxil in chronic respiratory tract infections by a double-blind method. J Int Med Res. 2004; 32(6):590–607.
crossref
9. Lee JE, Han DH, Won TB, Rhee CS. A randomized, double-blinded, open label study of the efficacy and safety of cefcapene pivoxil and amoxicillin-clavulanate in acute presumed bacterial rhinosinusitis. Clin Exp Otorhinolaryngol. 2011; 4(2):83–87. (Korean).
crossref
10. Koga T, Rikimaru T, Tokunaga N, Higashi T, Nakamura M, Ichikawa Y, Matsuo K. Evaluation of short-term clinical efficacy of 3-day therapy with azithromycin in comparison with 5-day cefcapene-pivoxyl for acute streptococcal tonsillopharyngitis in primary care. J Infect Chemother. 2011; 17(4):499–503.
crossref
11. Sakata H. Comparative study of 5-day cefcapene-pivoxil and 10-day amoxicillin or cefcapene-pivoxil for treatment of group A streptococcal pharyngitis in children. J Infect Chemother. 2008; 14(3):208–212.
crossref
12. Nakashima M, Uematsu T. Phase I study of S-1108, a new ester-type oral cephem antibiotic. Jpn J Chemother. 1993; 41(S-1):109–125.
13. Hummel J, McKendrick S, Brindley C, French R. Exploratory assessment of dose proportionality: review of current approaches and proposal for a practical criterion. Pharm Stat. 2009; 8(1):38–49.
crossref
14. Kato K, Shirasaka Y, Kuraoka E, Kikuchi A, Iguchi M, Suzuki H, Shibasaki S, Kurosawa T, Tamai I. Intestinal absorption mechanism of tebipenem pivoxil, a novel oral carbapenem: involvement of human OATP family in apical membrane transport. Mol Pharm. 2010; 7(5):1747–1756.
crossref
15. Shiba K, Yoshida M, Kaji M, Hori S, Shimada J, Sakai O. Basic and clinical studies on S-1108. Jpn J Chemother. 1993; 41(S-1):264–271.
16. Aoki N, Usuda Y, Koda Y, Takasawa T, Wakabayashi N, Hayashi S, Nitta I, Kourakata Y, Watanabe K, Honma Y. Clinical pharmacology and efficacy of S-1108. Jpn J Antibiot. 1993; 46(12):1063–1074.
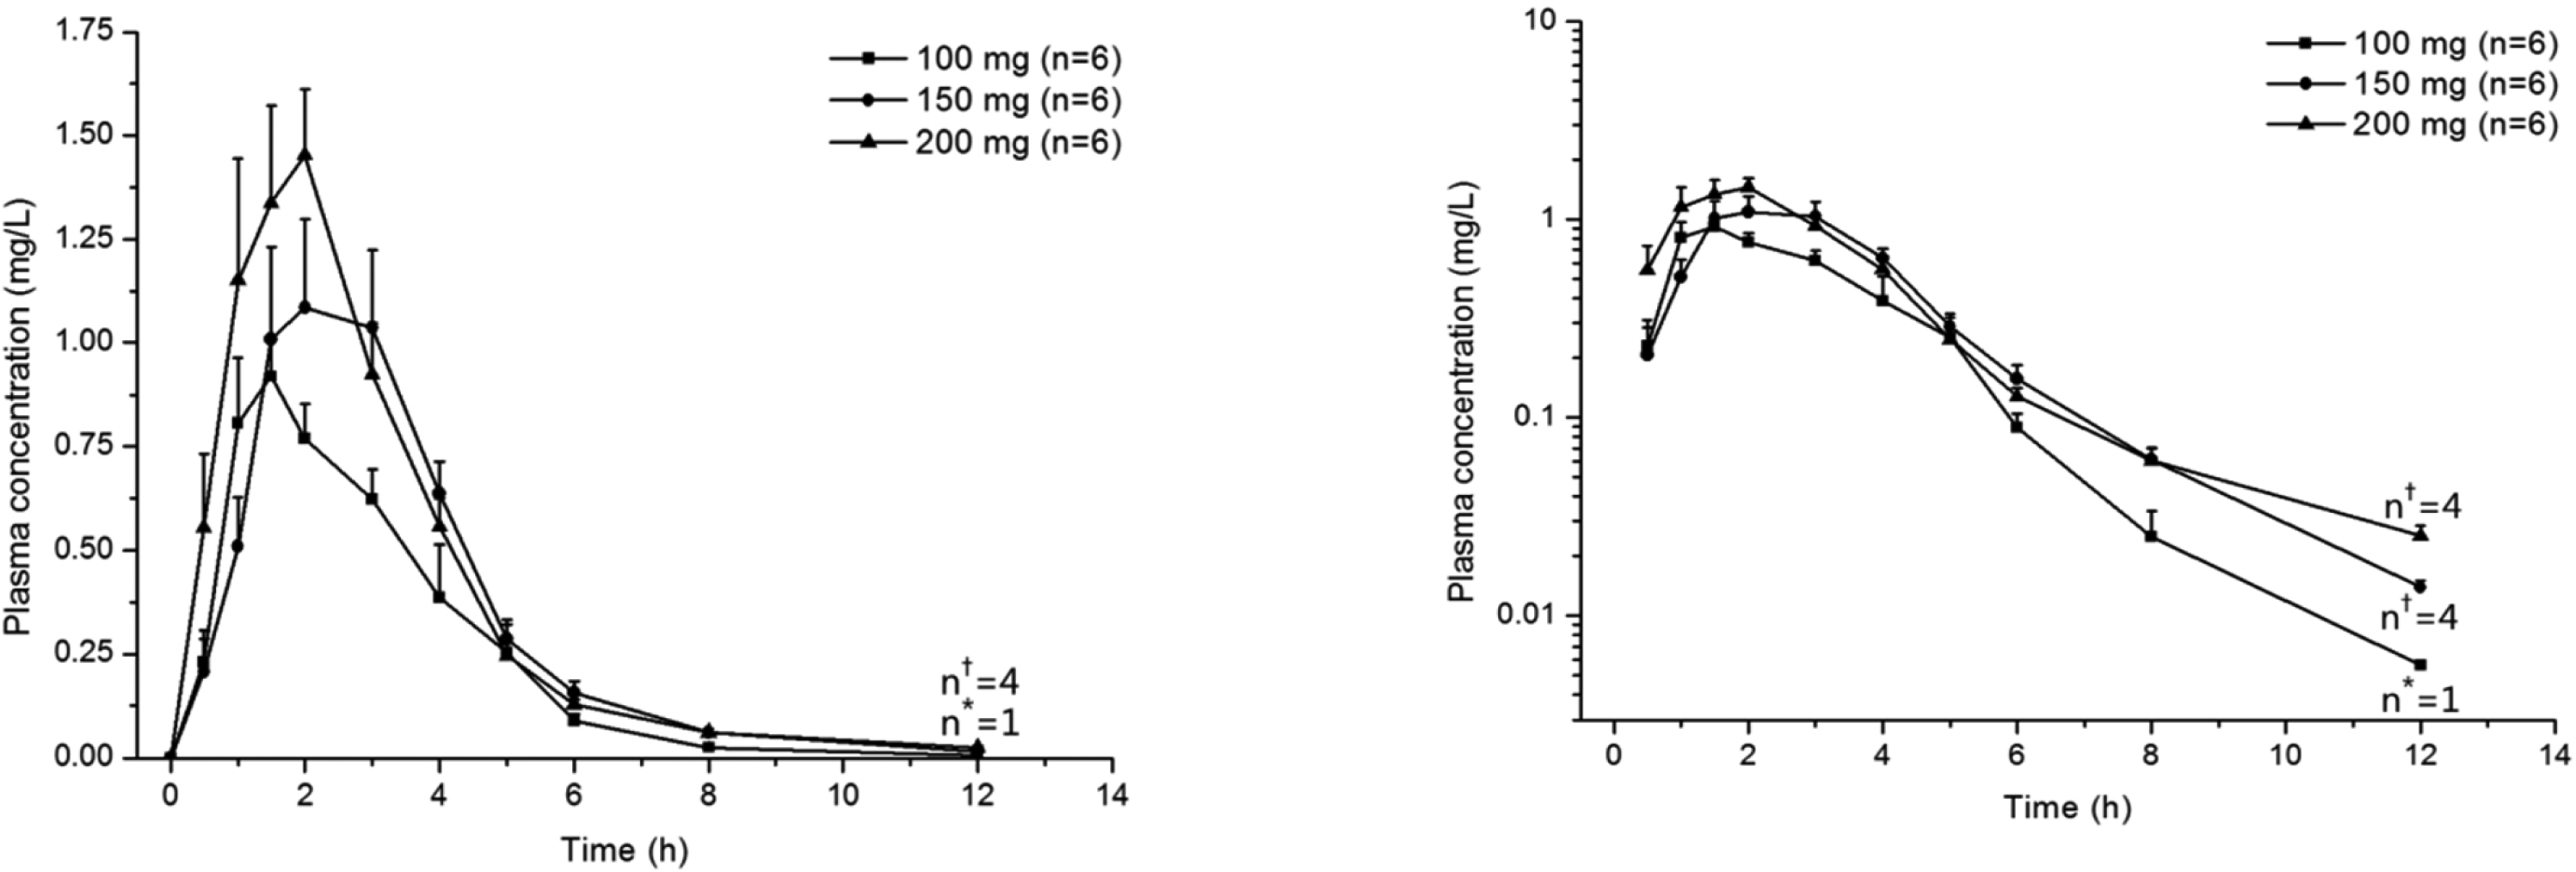
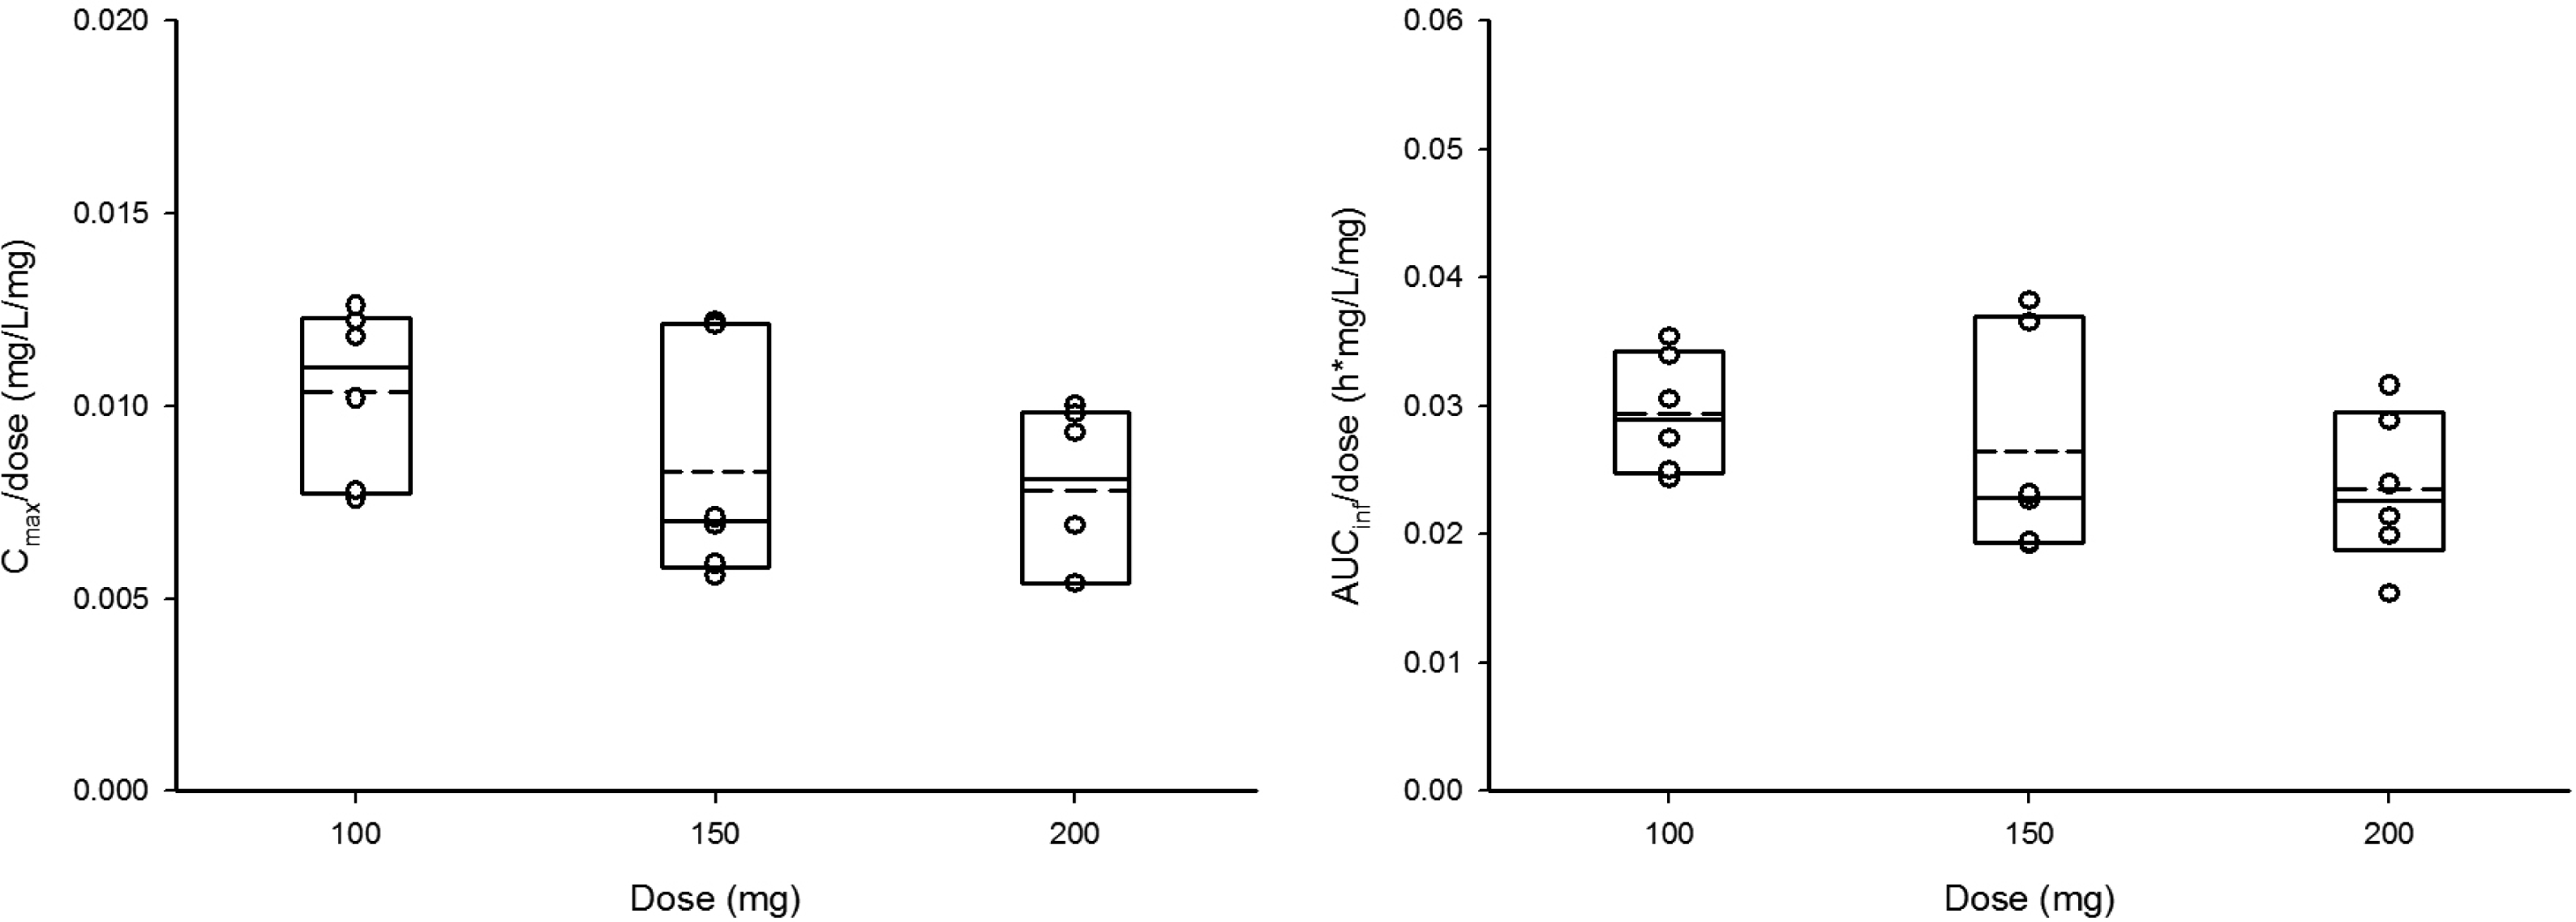
Figure 1.
Mean plasma concentration time profiles of cefcapene after single oral administration of 100, 150 and 200 mg (left: linear scale, right: log-linear scale). Error bars mean standard error. * 100 mg. 150 and 200 mg. Mean concentrations on 12 hours after dose include only plasma concentrations above lower limit of quantification.
jkscpt-21-104f1.tif
Figure 2.
Comparison of dose-normalized pharmacokinetic parameters among the dosing groups (100, 150 and 200 mg). The boxes represent 50 % of the values, and the horizontal lines correspond to the median(—) and the mean(—) (left: dose normalized Cmax, right: dose normalized AUCinf).
jkscpt-21-104f2.tif
Table 1.
Demographic data of subjects
Demography Treatment group
Total (n=18) P-value*
100 mg (n=6) 150 mg (n=6) 200 mg (n=6)
Age (years) 23.5 ± 2.6 28.0 ± 7.1 23.2 ± 1.7 24.9 ± 4.8 0.094
Height (cm) 172.8 ± 5.6 180.4 ± 5.6 170.7 ± 5.0 174.6 ± 4.7 0.030
Weight (kg) 68.1 ± 5.7 76.5 ± 9.8 65.2 ± 8.5 70.0 ± 9.1 0.071

Data are presented as mean ± standard deviation. *Kruskal-Wallis test.

Table 2.
Pharmacokinetic parameters of cefcapene after single oral administration
Pharmacokinetic parameter Treatment group
P-value*
100 mg (n=6) 150 mg (n=6) 200 mg (n=6)
  Tmax (h) 1.50 [1.00 - 4.00] 2.00 [1.50 - 3.00] 1.75 [1.00 - 3.00] 0.509
 Cmax (mg/L) 1.04 ± 0.22 (21.44) 1.24 ± 0.46 (36.63) 1.56 ± 0.43 (27.72) 0.073
AUCinf (h*mg/L) 2.94 ± 0.46 (15.67) 3.97 ± 1.28 (32.29) 4.70 ± 1.19 (25.37) 0.025
 AUCextra (%) 2.07 [1.42 - 5.48] 3.10 [1.35 - 4.49] 2.29 [1.14 - 4.49] 0.203
  t1/2 (h) 1.03 ± 0.21 (20.72) 1.31 ± 0.27 (20.71) 1.96 ± 0.96 (49.18) 0.091
 CL/F (L/h) 34.7 ± 5.4 (15.54) 40.8 ± 11.4 (27.96) 45.0 ± 12.1 (26.81) 0.250
  fe*F (%) 31.5 ± 8.7 (27.66) 39.7 ± 6.9 (17.28) 42.9 ± 15.8 (36.80) 0.220
  CLr (L/h) 11.0 ± 2.7 (24.31) 16.3 ± 3.7 (22.72) 18.2 ± 3.3 (17.85) 0.008

Data are presented as mean ± standard deviation (coefficient of variation, %) except for Tmax and AUCextra, for which median [minimum-maximum] are shown. Tmax: time of maximum observed plasma concentration. Cmax: maximum observed plasma concentration. AUCinf : area under the plasma concentration versus time curve from dosing to time infinity. AUCextra: percent of AUCinf extrapolated. t1/2: terminal elimination half life. CL/F: apparent clearance. fe*F: fraction of the non-intravenously administered drug excreted into the urine. CLr: renal clearance of the drug from plasma. * Kruskal-Wallis Test.

Table 3.
Comparison of dose normalized Cmax and AUCinf among three dosing groups
Pharmacokinetic parameter Treatment group
P-value*
100 mg (n=6) 150 mg (n=6) 200 mg (n=6)
Cmax/Dose (mg/L/mg)
0.0104 ± 0.0022 (21.44)
0.0083 ± 0.0030 (36.63)
0.0078 ± 0.0022 (27.72)
0.109
AUCinf/Dose (h*mg/L/mg) 0.0294 ± 0.0046 (15.67) 0.0265 ± 0.0086 (32.29) 0.0235 ± 0.0060 (25.37) 0.250

Data are presented as mean ± standard deviation (coefficient of variation, %). Cmax: maximum observed plasma concentration. AUCinf: area under the plasma concentration versus time curve from dosing to time infinity. *Kruskal-Wallis test.

Table 4.
Linear regression and power model for dose proportionality assessment of cefcapene
Dependent variable
Cmax AUCinf
Simple linear regression*
  Intercept of regression line 0.494 1.237
   (95 % CI) (-0.216 - 1.205) (-0.695 - 3.169)
  Slope of regression line 0.005 0.018
   (95 % CI) (0.001 - 0.010) (0.005 - 0.030)
Power model
  Intercept of regression line -2.576 -1.927
   (95 % CI) (-5.075 - -0.760) (-4.041 - 0.188)
  Slope of regression line 0.558 0.651
   (95 % CI) (0.056 - 1.060) (0.226 - 1.076)

Cmax: maximum observed plasma concentration. AUGinf: area under the plasma concentration versus time curve from dosing to time infinity. CI: confidence interval. *Y = α + β × (Dose), In(Y) = α + β × In (Dose), Y: dependent variable.

TOOLS
Similar articles