

 PDF
PDF ePub
ePub Citation
 Print
Print


Abstract
Background
Metformin is an effective oral antihyperglycaemic agent for type 2 diabetes mellitus, with a variety of metabolic effects. In addition to controlling blood glucose level, it has been appeared to decrease the long-period complications of diabetes, including macrovascular disease. Few reports have addressed the metabolite profiling of metformin. The study was to evaluate if targeted metabolic profiling approach is sensitive enough to predict the therapeutic effects of metformin after a single oral dose.
Methods
A randomized, open-label, single-dose study was conducted in twenty eight healthy Korean male volunteers. To determine the concentrations of endogenous metabolites in their pre-dose and post-dose plasma samples, blood samples were collected before and at 2 and 6 h after a single oral dose of 500 mg metformin. Both Modular P/Modular D analyzer and ultra-performance liquid chromatography tandem mass spectrometry (UPLC-MS/MS)-based metabolic profiling was performed.
Results
We quantified pre-dose and post-dose creatinine, blood urea nitrogen (BUN), lactic acid, 7 amino acids (lysine, glutamic acid, alanine, valine, leucine, phenylalanine, tryptophan), and 5 lysophosphatidylcholines (14:0, 16:0, 17:0, 18:0, and 18:1) using autoanalyser and UPLC-MS/MS. The postdose levels of alanine, lactic acid, glutamic acid, lysine, valine, leucine, phenylalanine, tryptophan, and lysoPC (18:1) were slightly decreased with statistical significance, but there is no clinical significance.
Figures and Tables
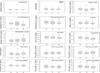 | Figure 2Comparison of targeted metabolite concentrations at 0 (predose), 2h and 6h after a single 500-mg oral dose of metformin. Boxes indicate interquantile range and whisker bars indicate 10th and 90th percentiles. Horizontal bars located in the middle of the boxes represent the median values. *P-value < 0.05, compared between baseline (predose) and 2h or 6h values by repeated measures ANOVA test.
|

References
1. United Kingdom Prospective Diabetes Study (UKPDS). Relative efficacy of randomly allocated diet, sulphonylurea, insulin, or metformin in patients with newly diagnosed non-insulin dependent diabetes followed for three years. BMJ. 1995. 310(6972):83–88.
2. United Kingdom Prospective Diabetes Study (UKPDS). A randomized trial of efficacy of early addition of metformin in sulfonylurea-treated type 2 diabetes. Diabetes Care. 1998. 21(1):87–92.
3. Glueck CJ, Fontaine RN, Wang P, Subbiah MT, Weber K, Illig E, Streicher P, Sieve-Smith L, Tracy TM, Lang JE, McCullough P. Metformin reduces weight, centripetal obesity, insulin, leptin, and low-density lipoprotein cholesterol in nondiabetic, morbidly obese subjects with body mass index greater than 30. Metabolism. 2001. 50(7):856–861.

4. United Kingdom Prospective Diabetes Study (UKPDS). Effect of intensive blood-glucose control with metformin on complications in overweight patients with type 2 diabetes (UKPDS 34). Lancet. 1998. 352(9131):854–865.
5. Liu F, Lu JX, Tang JL, Li L, Lu HJ, Hou XH, Jia WP, Xiang KS. Relationship of plasma creatinine and lactic acid in type 2 diabetic patients without renal dysfunction. Chin Med J (Engl). 2009. 122(21):2547–2553.
6. Tahrani AA, Varughese GI, Scarpello JH, Hanna FW. Metformin, heart failure, and lactic acidosis: is metformin absolutely contraindicated? BMJ. 2007. 335(7618):508–512.
7. Jeong BC. Metabolomics in disease researches. Mol Cell Biol News. 2006. 18:17–27. (Korean).
8. Graham GG, Punt J, Arora M, Day RO, Doogue MP, Duong JK, Furlong TJ, Greenfield JR, Greenup LC, Kirkpatrick CM, Ray JE, Timmins P, Williams KM. Clinical pharmacokinetics of metformin. Clin Pharmacokinet. 2011. 50(2):81–98.
9. Lipska KJ, Bailey CJ, Inzucchi SE. Use of metformin in the setting of mild-to-moderate renal insufficiency. Diabetes Care. 2011. 34(6):1431–1437.
10. Kruse JA. Metformin-associated lactic acidosis. J Emerg Med. 2001. 20(3):267–272.
11. Stades AM, Heikens JT, Erkelens DW, Holleman F, Hoekstra JB. Metformin and lactic acidosis: cause or coincidence? A review of case reports. J Intern Med. 2004. 255(2):179–187.
12. Chui W. Metformin and contrast media. Hong Kong Med Diary. 2006. 11(6):19–20.
13. Marchetti P, Masiello P, Benzi L, Cecchetti P, Fierabracci V, Giannarelli R, Gregorio F, Brunetti P, Navalesi R. Effects of metformin therapy on plasma amino acid pattern in patients with maturity-onset diabetes. Drugs Exp Clin Res. 1989. 15(11-12):565–570.
14. Johnson AB, Webster JM, Sum CF, Heseltine L, Argyraki M, Cooper BG, Taylor R. The impact of metformin therapy on hepatic glucose production and skeletal muscle glycogen synthase activity in overweight type II diabetes patients. Metabolism. 1993. 42(9):1217–1222.
15. Cai S, Huo T, Li N, Xiong Z, Li F. Lysophosphatidylcholine-biomarker of metformin action: studied using UPLC/MS/MS. Biomed Chromatogr. 2009. 23(7):782–786.
 XML Download