Abstract
Background
Hypoglycemia is an important obstacle in the treatment of diabetes. When diabetic patients experience hypoglycemia, thorough glycemic control is more difficult. We evaluated the factors associated with risk of hypoglycemia and identified whether the demographic and clinical characteristics or the medication pattern changed during the study period.
Methods
This study was conducted retrospectively with 7 years of data from one university hospital emergency department. We evaluated the medical records of 396 diabetic patients who visited the emergency room with hypoglycemia between January 2008 and December 2014. Hypoglycemia was defined as a serum glucose level less than 70 mg/dL or an event requiring the assistance of another person to actively corrective action.
Results
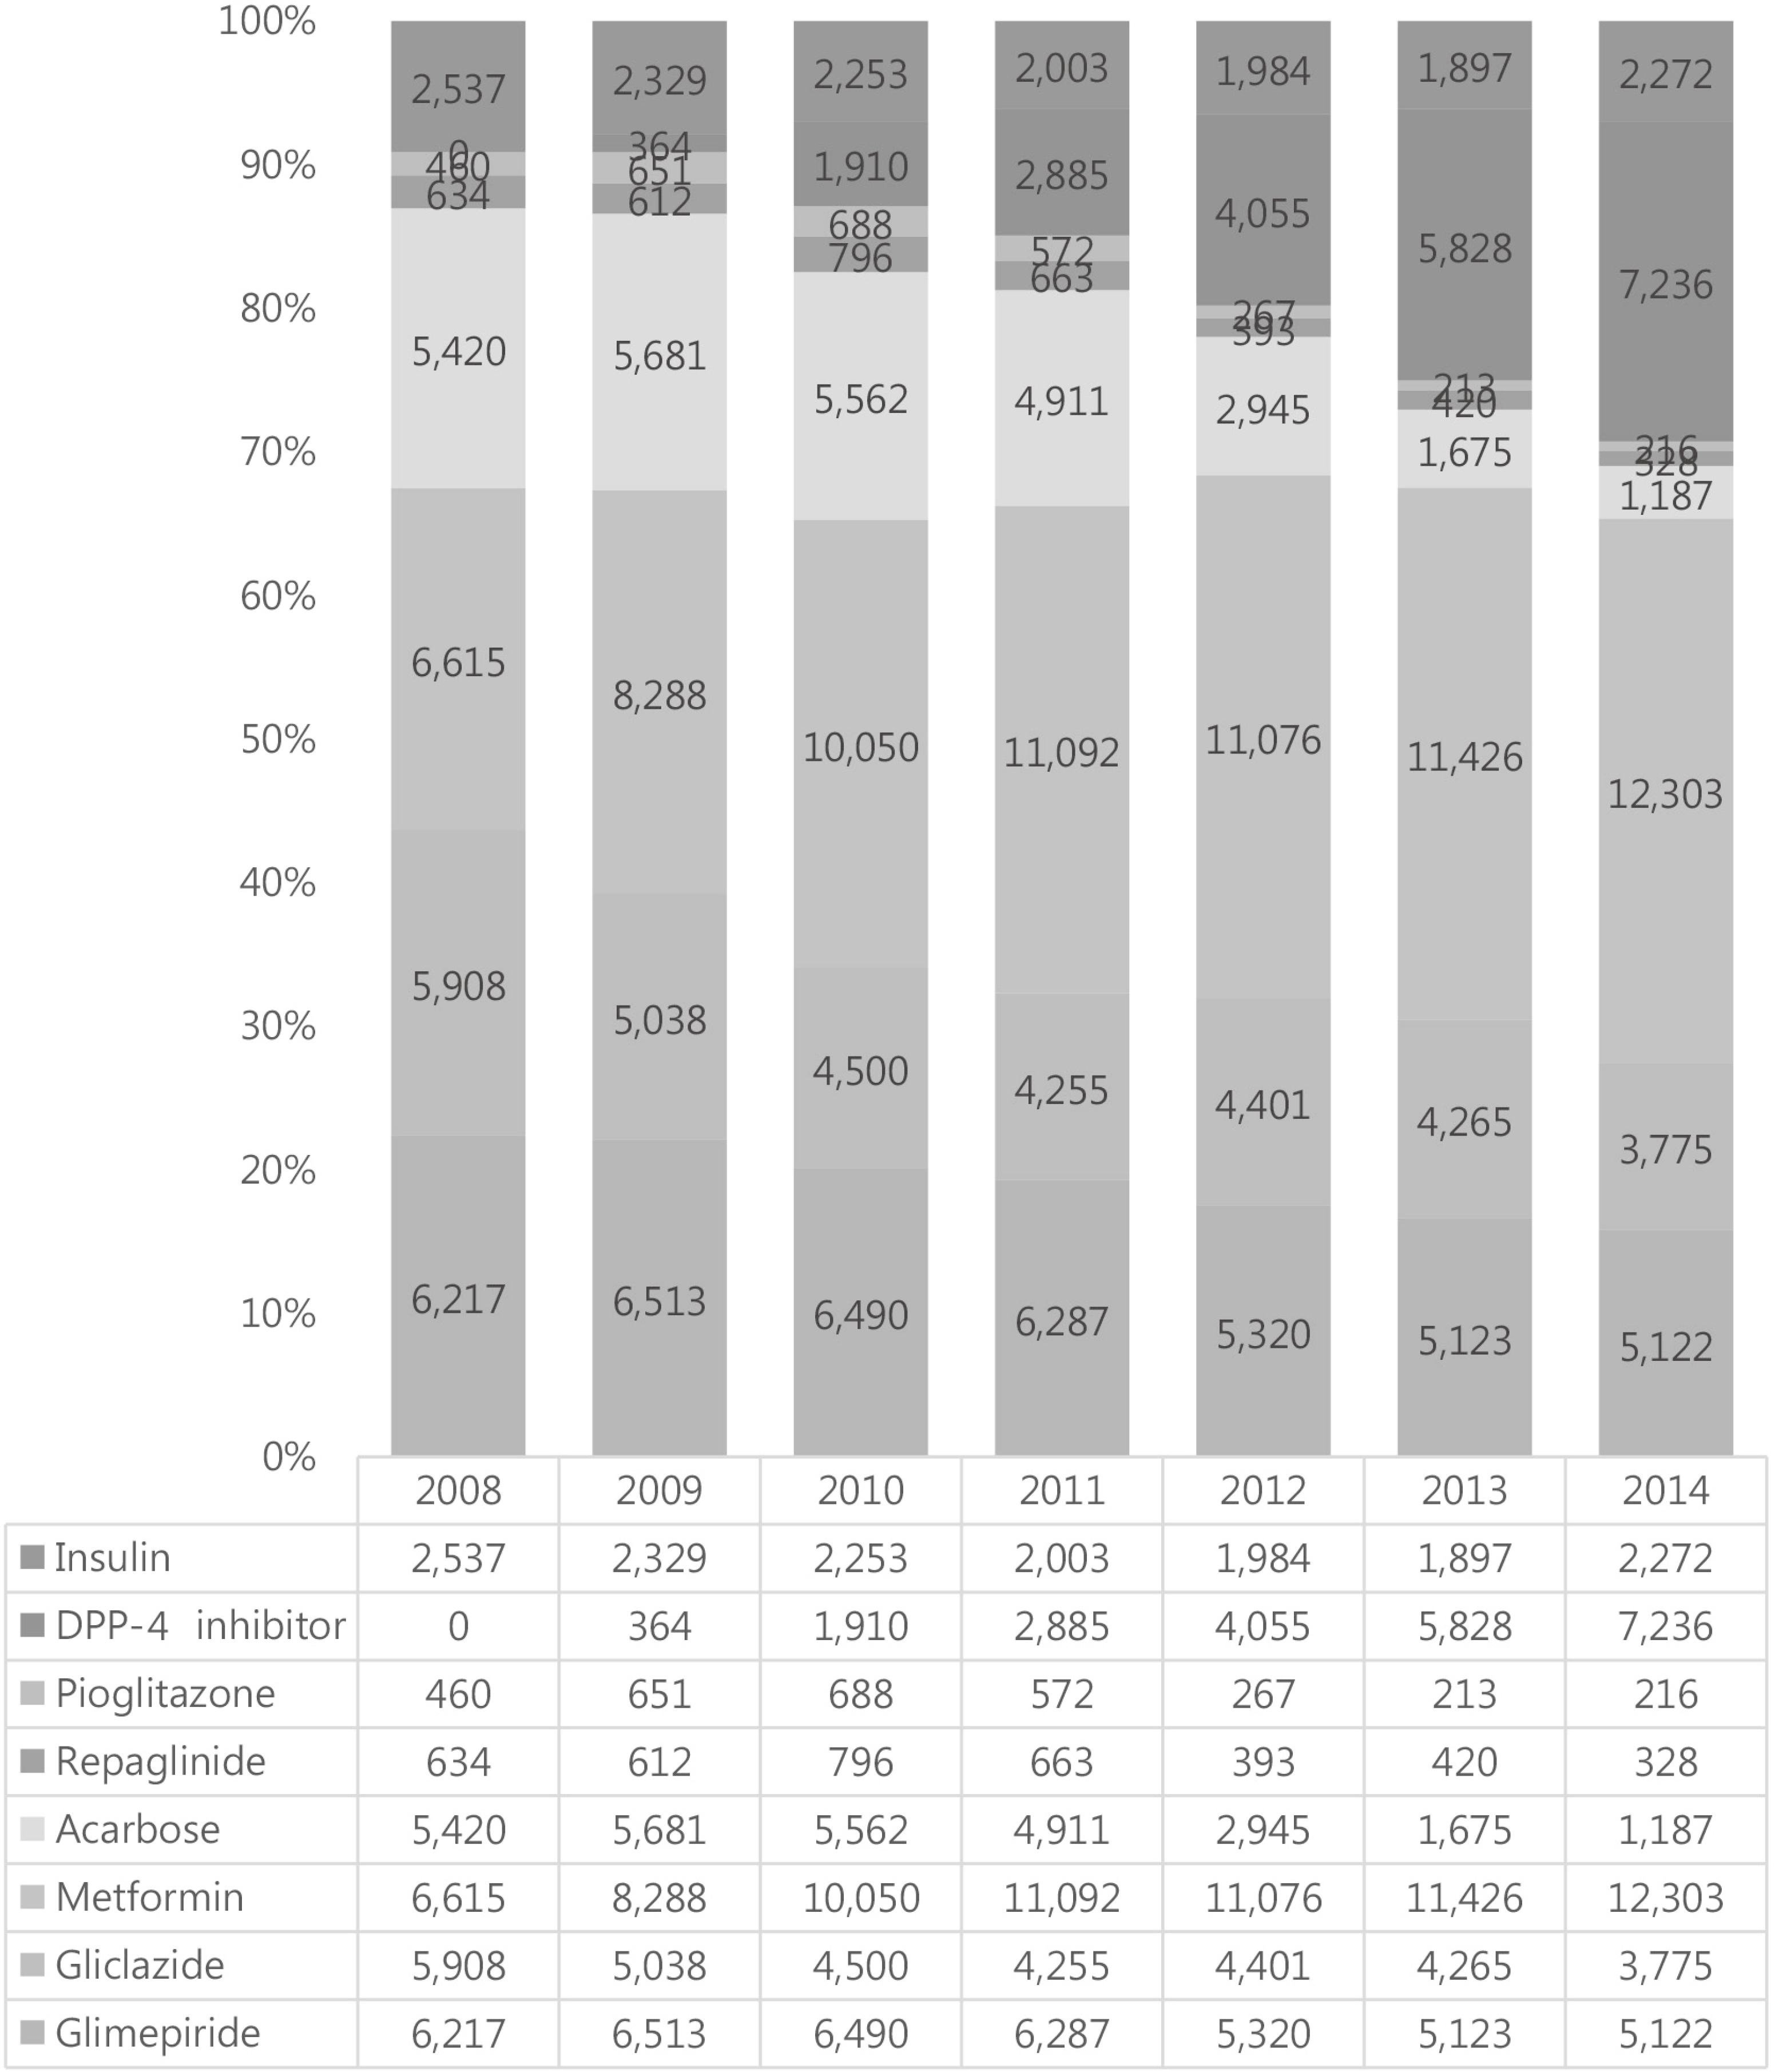
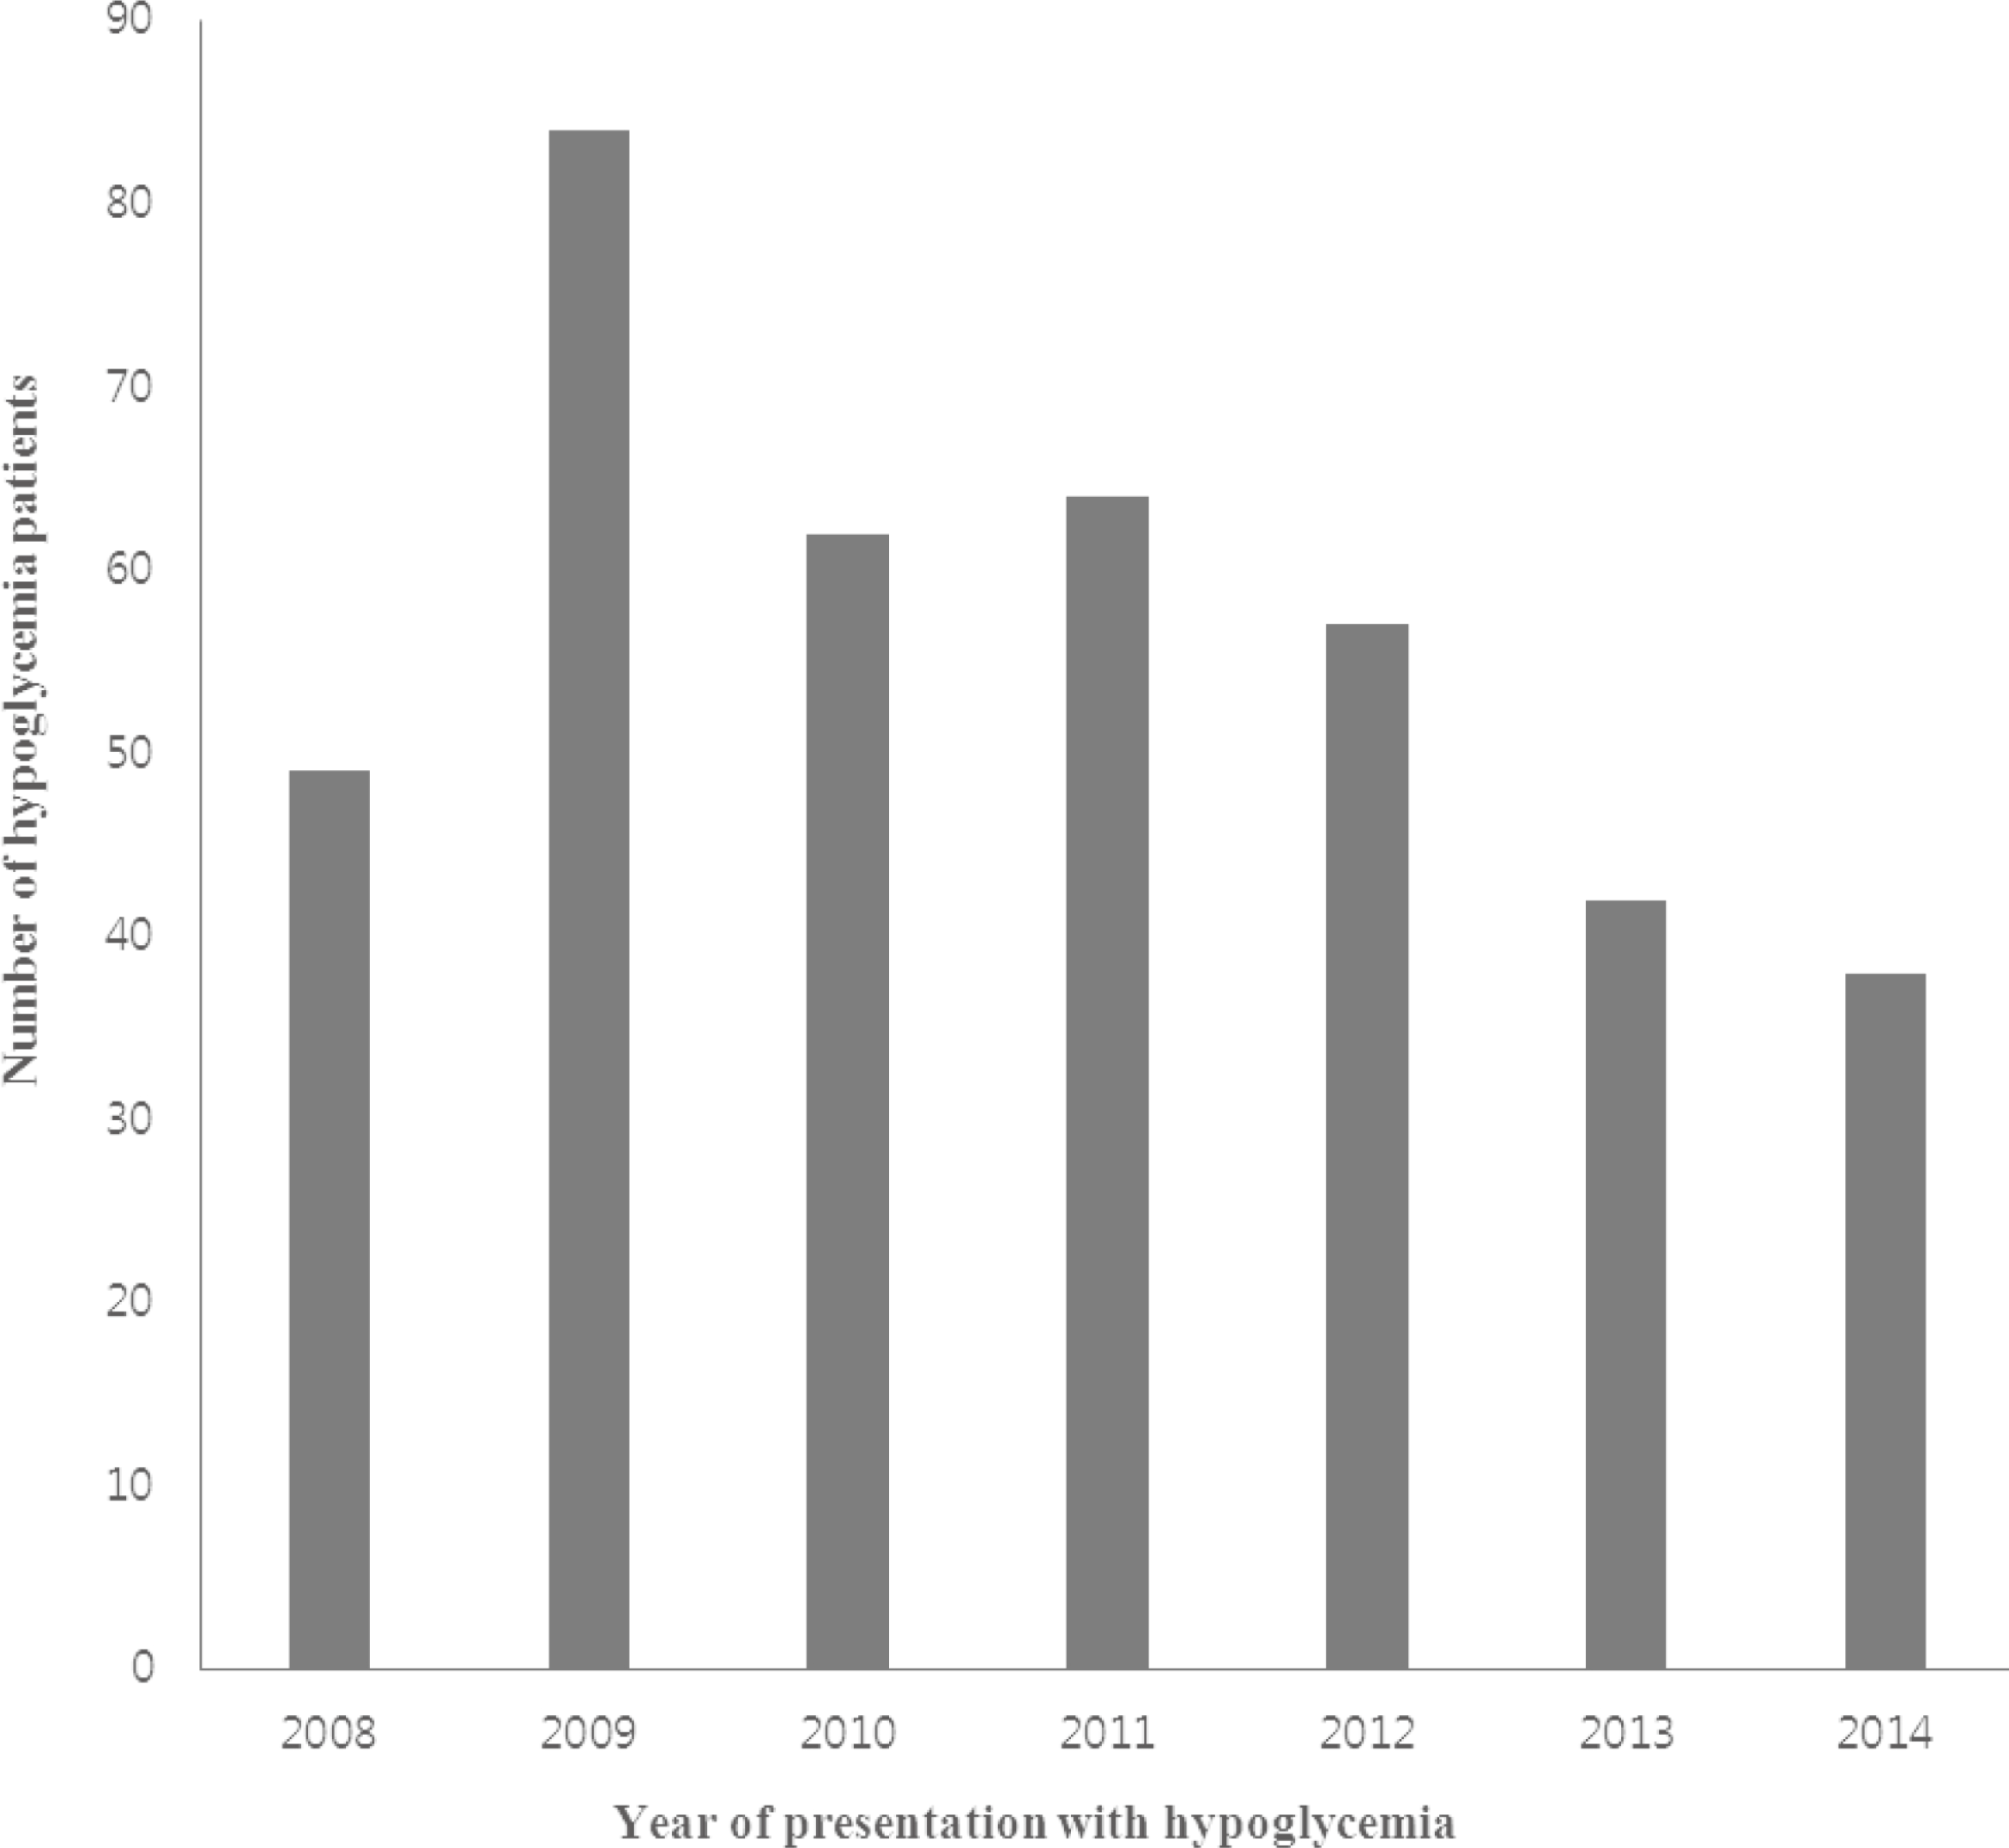
The mean age, duration of diabetes, and hemoglobin A1c (HbA1c) of the study subjects were 71 ± 12.2 years, 12.7 ± 8.8 years, and 6.7 ± 1.39%, respectively. Among the subjects, 55% had a HbA1c level lower than 6.5%. Two-thirds of the study subjects received sulfonylurea, and one-third were treated with insulin. We observed a decreasing trend in the number of hypoglycemia cases during the study period. This trend might be partly explained by the decrease in sulfonylurea use and increase in dipeptidyl peptidase 4 inhibitor prescription during the study period.
Go to : 
References
1. The Diabetes Control and Complications Trial Research Group. The effect of intensive treatment of diabetes on the development and progression of longterm complications in insulindependent diabetes mellitus. N Engl J Med. 1993; 329:977–86.
2. UK Prospective Diabetes Study (UKPDS) Group. Intensive blood-glucose control with sulphonylureas or insulin compared with conventional treatment and risk of complications in patients with type 2 diabetes (UKPDS 33). Lancet. 1998; 352:837–53.
3. Seufert J. [ACCORD (Action to Control Cardiovascular Risk in Diabetes trial) becoming "two-tone"]. Dtsch Med Wochenschr. 2008; 133:1068–70.
4. Cryer PE. Death during intensive glycemic therapy of diabetes: mechanisms and implications. Am J Med. 2011; 124:993–6.

5. American Diabetes Association. Standards of medical care in diabetes-2015 abridged for primary care providers. Clin Diabetes. 2015; 33:97–111.
6. Seaquist ER, Anderson J, Childs B, Cryer P, Dagogo-Jack S, Fish L, Heller SR, Rodriguez H, Rosenzweig J, Vigersky R. Hypoglycemia and diabetes: a report of a workgroup of the American Diabetes Association and the Endocrine Society. Diabetes Care. 2013; 36:1384–95.

7. James PA, Oparil S, Carter BL, Cushman WC, Dennison-Himmelfarb C, Handler J, Lackland DT, LeFevre ML, MacKenzie TD, Ogedegbe O, Smith SC Jr, Svetkey LP, Taler SJ, Townsend RR, Wright JT Jr, Narva AS, Ortiz E. 2014 evidence-based guideline for the management of high blood pressure in adults: report from the panel members appointed to the Eighth Joint National Committee (JNC 8). JAMA. 2014; 311:507–20.
8. Andrassy KM. Comments on ‘KDIGO 2012 clinical practice guideline for the evaluation and management of chronic kidney disease'. Kidney Int. 2013; 84:622–3.

9. Kim JT, Oh TJ, Lee YA, Bae JH, Kim HJ, Jung HS, Cho YM, Park KS, Lim S, Jang HC, Lee HK. Increasing trend in the number of severe hypoglycemia patients in Korea. Diabetes Metab J. 2011; 35:166–72.

10. UK Hypoglycaemia Study Group. Risk of hypoglycaemia in types 1 and 2 diabetes: effects of treatment modalities and their duration. Diabetologia. 2007; 50:1140–7.
11. Duckworth W, Abraira C, Moritz T, Reda D, Emanuele N, Reaven PD, Zieve FJ, Marks J, Davis SN, Hayward R, Warren SR, Goldman S, McCarren M, Vitek ME, Henderson WG, Huang GD. VADT Investigators. Glucose control and vascular complications in veterans with type 2 diabetes. N Engl J Med. 2009; 360:129–39.

12. ADVANCE Collaborative Group. Patel A, MacMahon S, Chalmers J, Neal B, Billot L, Woodward M, Marre M, Cooper M, Glasziou P, Grobbee D, Hamet P, Harrap S, Heller S, Liu L, Mancia G, Mogensen CE, Pan C, Poulter N, Rodgers A, Williams B, Bompoint S, de Galan BE, Joshi R, Travert F. Intensive blood glucose control and vascular outcomes in patients with type 2 diabetes. N Engl J Med. 2008; 358:2560–72.
13. Nichols GA, Joshua-Gotlib S, Parasuraman S. Glycemic control and risk of cardiovascular disease hospitalization and all-cause mortality. J Am Coll Cardiol. 2013; 62:121–7.

Go to : 
 | Fig. 2.The number of outpatient prescriptions of hypoglycemic agents at Chuncheon Sacred Heart Hospital by year. DPP-4 inhibitor, dipeptidyl peptidase 4 inhibitor. |
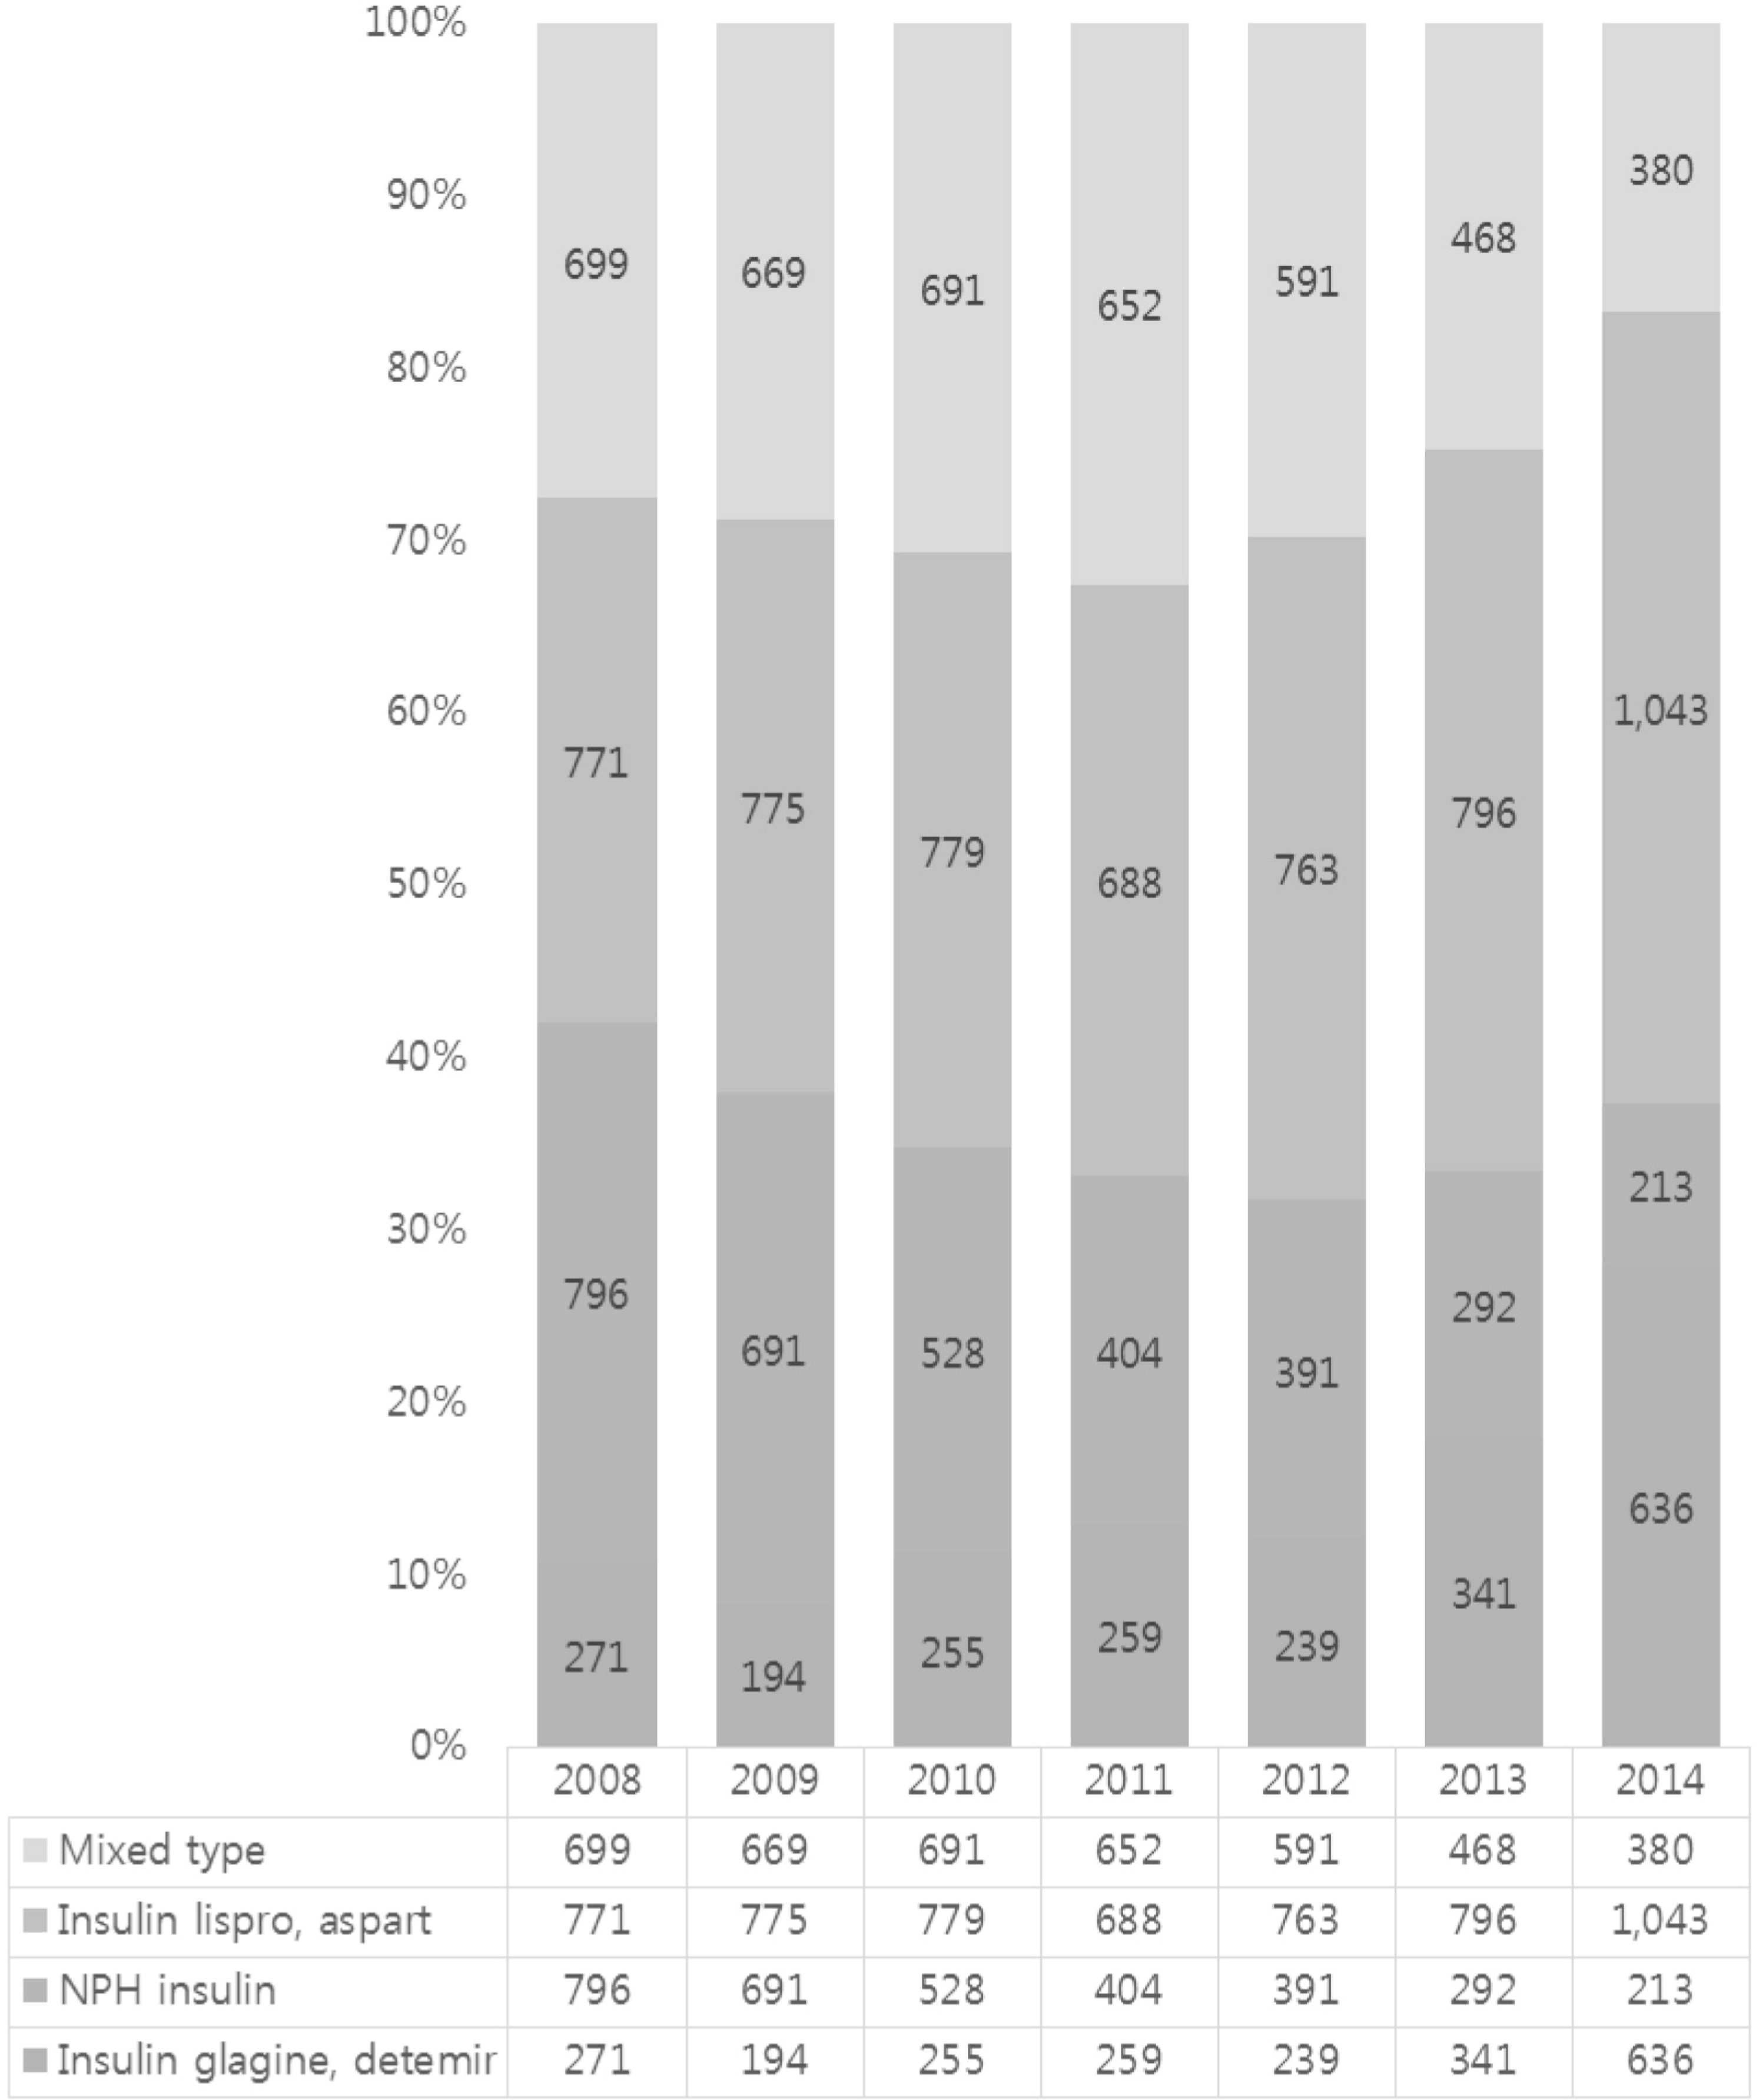
 | Fig. 3.The number of outpatient insulin prescriptions at Chuncheon Sacred Heart Hospital by year. NPH, Neutral Protamine Hagedorn Insulin. |
Table 1.
Characteristics of the enrolled diabetic hypoglycemic patients
Table 2.
Comparison of clinical characteristics according to the year of presentation with hypoglycemia
| Characteristic | 2008 | 2009 | 2010 | 2011 | 2012 | 2013 | 2014 |
|---|---|---|---|---|---|---|---|
| Patients | 49 (12.4) | 84 (21.2) | 62 (15.7) | 64 (16.2) | 57 (14.4) | 42 (10.6) | 38 (9.6) |
| Age (y) | 69.8 ± 8.9 | 70.7 ± 12.0 | 69.4 ± 12.4 | 70.9 ± 14.0 | 70.6 ± 14.0 | 75.0 ± 10.3 | 72.1 ± 11.3 |
| P-valuea | 0.615 | 0.52 | 0.932 | 0.943 | 0.053 | 0.555 | |
| Sex (male/female) | 27 (55.1) | 35 (41.7) | 28 (45.2) | 32 (50.0) | 20 (35.1) | 18 (42.9) | 23 (60.5) |
| /22 (44.9) | /49 (59.8) | /34 (54.8) | /32 (50.0) | /37 (64.0) | /24 (57.1) | /15 (39.5) | |
| P-valueb | 0.152 | 0.736 | 0.323 | 0.484 | > 0.99 | 0.078 | |
| Duration of diabetes mellitus (y) | 12.7 ± 8.4 | 11.9 ± 9.4 | 12.5 ± 8.7 | 14.3 ± 9.5 | 13.3 ± 9.1 | 11.9 ± 8.0 | 12.2 ± 6.9 |
| P-valuea | 0.613 | 0.714 | 0.141 | 0.393 | 0.977 | 0.89 | |
| Body mass index (kg/m2) | 21.9 ± 3.0 | 24.0 ± 3.9 | 24.2 ± 4.7 | 23.9 ± 3.7 | 23.4 ± 3.6 | 23.0 ± 3.7 | 24.3 ± 3.8 |
| P-valuea | 0.005 | 0.792 | 0.852 | 0.381 | 0.226 | 0.772 | |
| Smoking | 14 (28.6) | 15 (17.9) | 9 (14.5) | 8 (12.5) | 11 (19.3) | 7 (16.7) | 4 (10.5) |
| P-valueb | 0.192 | 0.656 | 0.243 | 0.131 | > 0.99 | 0.421 | |
| Alcohol | 11 (22.4) | 15 (17.9) | 6 (9.7) | 15 (23.4) | 10 (17.5) | 7 (16.7) | 11 (28.9) |
| P-valueb | 0.467 | 0.233 | 0.286 | 0.027 | >0.99 | 0.232 | |
| Hypertension | 40 (81.6) | 68 (81.0) | 48 (77.4) | 51 (79.7) | 44 (77.2) | 31 (73.8) | 28 (73.7) |
| P-valueb | > 0.99 | 0.68 | > 0.99 | 0.672 | 0.366 | 0.474 | |
| Dyslipidemia | 36 (73.5) | 63 (75.0) | 48 (77.4) | 51 (79.7) | 42 (73.7) | 31 (73.8) | 23 (60.5) |
| P-valueb | 0.84 | 0.845 | 0.558 | >0.99 | >0.99 | 0.2 | |
| Cardiovascular disease | 11 (22.4) | 15 (17.9) | 17 (27.4) | 14 (21.9) | 10 (17.5) | 9 (21.4) | 7 (18.4) |
| P-valueb | 0.651 | 0.224 | 0.676 | > 0.99 | 0.637 | > 0.99 | |
| Cerebrovascular disease | 12 (24.5) | 12 (14.3) | 9 (14.5) | 12 (18.8) | 8 (14.0) | 5 (11.9) | 10 (26.3) |
| P-valueb | 0.164 | > 0.99 | 0.505 | > 0.99 | 0.789 | 0.13 | |
| Stage 3∼5 chronic kidney disease | 16 (32.7) | 31 (36.9) | 21 (33.9) | 10 (15.6) | 13 (22.8) | 9 (21.4) | 12 (31.6) |
| P-valueb | 0.78 | 0.703 | 0.005 | 0.096 | 0.104 | 0.683 | |
| Cancer | 9 (18.4) | 17 (20.2) | 4 (6.5) | 7 (10.9) | 8 (14.0) | 5 (11.9) | 1 (2.6) |
| P-valueb | > 0.99 | 0.03 | 0.177 | 0.033 | 0.323 | 0.012 | |
| Hemoglobin A1c (%) | 6.6 ± 1.7 | 6.5 ± 0.9 | 7.2 ± 1.7 | 6.7 ± 1.3 | 6.9 ± 1.3 | 6.9 ± 1.7 | 6.3 ± 1.1 |
| P-valueb | 0.621 | 0.004 | 0.129 | 0.04 | 0.2799 | 0.348 | |
| Sulfonylurea user | 28 (57.1) | 55 (65.5) | 41 (66.1) | 40 (62.5) | 35 (61.4) | 32 (76.2) | 26 (68.4) |
| P-valueb | 0.359 | > 0.99 | 0.732 | 0.721 | 0.307 | 0.837 | |
| Insulin user | 19 (38.8) | 24 (28.6) | 22 (35.5) | 17 (26.5) | 17 (29.8) | 13 (31.0) | 13 (34.2) |
| P-valueb | 0.252 | 0.216 | > 0.99 | > 0.99 | 0.837 | 0.532 |


 PDF
PDF ePub
ePub Citation
 Print
Print


 XML Download