Journal List > J Korean Diabetes > v.12(1) > 1054778

Jekal and Jeon: Epidemiology of Physical Activity Participation and Type 2 Diabetes in Korea

Abstract

To date, numerous investigations have identified the role of exercise and physical activity in prevention and treatment of Type 2 diabetes and cardiovascular disease (CVD). This review paper analyzed epidemiological findings which investigated the effects of obesity, physical activity participation and the level of fitness levels on prevalence and risk factors of Type 2 diabetes and CVD. These studies showed that not only prevention of obesity, but also participation of physical activity and maintenance of good level of fitness are important to prevent and treat Type 2 diabetes and CVD. In addition, prevention of obesity and improvement of high fitness levels at early ages (childhood and adolescence) are important to prevent the prevalence and incidence of Type 2 diabetes and CVD.

REFERENCES

1. An KY, Kim ES, Jekal Y, Jeon JY. Association of muscular endurance and cardiopulmonary fitness to insulin resistance and the risk factors of CVD among male high school students. J Korean Soc Living Environ Sys. 2010; 17:477–86.
2. Boule NG, Haddad E, Kenny GP, Wells GA, Sigal RJ. Effects of exercise on glycemic control and body mass in type 2 diabetes mellitus: a meta-analysis of controlled clinical trials. JAMA. 2001; 286:1218–27.
crossref
3. Carnethon MR, Gulati M, Greenland P. Prevalence and cardiovascular disease correlates of low cardiorespiratory fitness in adolescents and adults. JAMA. 2005; 294:2981–8.
crossref
4. Centers for Disease Control and Prevention. Diabetes: disabling, deadly, and on the rise. Atlanta: US Department Of Health and Human Services;2004.
5. Church TS, Cheng YJ, Earnest CP, Barlow CE, Gibbons LW, Priest EL, Blair SN. Exercise capacity and body composition as predictors of mortality among men with diabetes. Diabetes Care. 2004; 27:83–8.
crossref
6. Church TS, LaMonte MJ, Barlow CE, Blair SN. Cardiorespiratory fitness and body mass index as predictors of cardiovascular disease mortality among men with diabetes. Arch Intern Med. 2005; 165:2114–20.
crossref
7. Jekal YS, Kim ES, Park JH, Jeon JY, Im JA. The relationship between fitness and insulin resistance and cardiovascular risk factors in Korean male adolescents. Korean J Phys Educ. 2008; 47:485–93.
8. Jekal Y, Kim ES, Im JA, Park JH, Lee MK, Lee SH, Suh SH, Chu SH, Kang ES, Lee HC, Jeon JY. Interaction between fatness and fitness on CVD risk factors in Asian youth. Int J Sports Med. 2009; 30:733–40.
crossref
9. Jekal Y, Lee MK, Park S, Lee SH, Kim JY, Kang JU, Naruse M, Kim SH, Kim SH, Chu SH, Suh SH, Jeon JY. Association between obesity and physical fitness, and hemoglobin A1c level and metabolic syndrome in Korean adults. Korean Diabetes J. 2010; 34:182–90.
crossref
10. Jekal Y, Yun JE, Park SW, Jee SH, Jeon JY. The relationship between the level of fatness and fitness during adolescence and the risk factors of metabolic disorders in adulthood. Korean Diabetes J. 2010; 34:126–34.
crossref
11. Jeon JY, Im JA, Kim SH, Chu SH, Suh SH, Kim SH, Jekal Y. Effects of fitness levels during high school on metabolic disease risk factors among subjects aged between 40 to 45 years. Management Center for Health Promotion Reports, Seoul, Korea. 2009.
12. Lee MK, Jekal YS, Kim ES, Lee SH, Jeon JY. BMI, muscular endurance, and cardiovascular disease risk factors in overweight and obese children. Korean J Phys Educ. 2009; 48:535–43.
13. McAuley PA, Myers JN, Abella JP, Tan SY, Froelicher VF. Exercise capacity and body mass as predictors of mortality among male veterans with type 2 diabetes. Diabetes Care. 2007; 30:1539–43.
crossref
14. Mokdad AH, Ford ES, Bowman BA, Dietz WH, Vinicor F, Bales VS, Marks JS. Prevalence of obesity, diabetes, and obesity-related health risk factors, 2001. JAMA. 2003; 289:76–9.
crossref
15. Nathan BM, Moran A. Metabolic complications of obesity in childhood and adolescence: more than just diabetes. Curr Opin Endocrinol Diabetes Obes. 2008; 15:21–9.
crossref
16. Nomura T, Ikeda Y, Nakao S, Ito K, Ishida K, Suehiro T, Hashimoto K. Muscle strength is a marker of insulin resistance in patients with type 2 diabetes: a pilot study. Endocr J. 2007; 54:791–6.
crossref
17. Statistics Korea. 2004 Annual report on the cause of death statistics. Daejeon: Statistics Korea;2005.
18. Wessel TR, Arant CB, Olson MB, Johnson BD, Reis SE, Sharaf BL, Shaw LJ, Handberg E, Sopko G, Kelsey SF, Pepine CJ, Merz NB. Relationship of physical fitness vs body mass index with coronary artery disease and cardiovascular events in women. JAMA. 2004; 292:1179–87.
crossref

Table 1.
Comparisons of anthropometrics, metabolic parameters and insulin resistance and cardiovascular disease risk score across the level of BMI among Korean adolescents (KAPHA study) (adapted from Jekal et al.-Int Sports Med 2009;30:733-40 [8])
Variables BMI < 23 23 ≤ BMI ≤ 26.9 BMI > 27 Total
No. 205 86 31 322
Height (cm) 174.01 ± 5.78 174.42 ± 4.86 173.37 ± 5.69666 174.06 ± 5.546
Weight (kg) 662.64 ± 7.58 674.96 ± 5.85 89.3 ± 10.29 668.49 ± 11.41
BMI (kg/m2) 620.73 ± 1.56 6624.59 ± 1.15a 29.58 ± 2.36a,b 22.62 ± 3.23
Percent body fat (%) 614.27 ± 3.79 6620.21 ± 3.73a 28.33 ± 4.82a,b 17.13 ± 5.95
SBP (mm Hg) 113.37 ± 9.17 66114.14 ± 10.716 124.45 ± 11.96a,b 114.62 ± 10.35
DBP (mm Hg) 673.80 ± 7.68 673.32 ± 8.80 81.61 ± 9.04a,b 74.42 ± 8.44
Glucose (mg/dL) 6674.4 ± 9.01 6677.04 ± 8.22a 75.06 ± 7.8266 75.17 ± 8.75
Insulin (µIU/mL) 665.61 ± 2.65 6668.29 ± 6.21a 13.09 ± 7.18a,b 67.04 ± 4.98
HOMA-IR 662.01 ± 1.00 6662.96 ± 2.08a 65.37 ± 3.48a,b 62.58 ± 1.97
TC (mg/dL) 6144.34 ± 23.06 6146.25 ± 24.24 160.13 ± 24.32a,b 146.37 ± 23.87
TG (mg/dL) 6665.46 ± 33.16 6674.02 ± 29.47 104.84 ± 42.03a,b 671.54 ± 35.02
HDL-C (mg/dL) 654.58 ± 8.89 6650.85 ± 9.52a 50.37 ± 9.48a,b 53.08 ± 9.28
LDL-C (mg/dL) 6676.66 ± 19.44 6680.60 ± 20.49 688.79 ± 22.18a,b 678.88 ± 20.26
hs-CRP (mg/dL) 660.15 ± 0.34 660.17 ± 0.33 0.10 ± 0.066 60.15 ± 0.33
CVD risk score 6-1.32 ± 2.36 6661.04 ± 2.52a 65.89 ± 4.62a,b 660.0 ± 3.48
IMT max (mm) 660.74 ± 0.08 660.73 ± 0.07 0.77 ± 0.076 60.75 ± 0.08
IMT average (mm) 660.60 ± 0.05 660.59 ± 0.06 60.63 ± 0.06a,b 60.61 ± 0.06

Values are presented as mean ± SD unless otherwise indicated. BMI, body mass index; DBP, Diastolic blood pressure; HDL-C, High density lipoprotein cholesterol; HOMA-IR, homeostasis model assessment of insulin resistance; hs-CRP, high sensitivity C-reactive protein; CVD risk score, cardiovascular disease risk score; IMT, intima media thickness; IMT average, 6 point average; LDL-C, low density lipoprotein cholesterol; SBP, systolic blood pressure; TC, total cholesterol; TG, triglyceride.

IMT was performed 131 participants

a P < 0.05 vs. BMI < 23

b P < 0.05 vs. 23 ≤ BMI ≤ 26.9.

Table 2.
Odd ratios of having cardiovasclar disease risk factors in US adolescents and adults with low level of physical fitness (NHANES 1999-2002)(adapted from Carnethon et al. JAMA 2005;294:2981-8 [3])
OR (95% CI)
Fitness status Female Male
Adolescents
 Overweight (BMI 25-30)a 2.27 (1.64-3.15) 2.88 (2.02-4.09)
 Obese (BMI ≥ 30)a 2.68 (1.86-3.86) 3.65 (2.32-5.75)
 Newly identified hypertension 1.35 (0.68-2.70) 1.03 (0.30-3.54)
 Hypercholesterolemiab 1.89 (1.12-3.17) 3.68 (2.55-5.31)
 Low HDL-C 1.03 (0.74-1.43) 1.25 (0.93-1.69)
 Impaired fasting glucosec 1.95 (0.71-5.37) 1.24 (0.79-1.95)
 The metabolic syndromed 2.72 (0.85-8.74) 4.20 (2.14-8.25)
Adults
 Overweight (BMI 25-30)a 2.94 (1.85-4.68) 3.41 (1.90-6.13)
 Obese (BMI ≥ 30)a 2.14 (1.37-3.34) 3.13 (1.96-4.99)
 Newly identified hypertension 2.12 (1.33-3.37) 1.83 (1.08-3.09)
 Hypercholesterolemiab 1.71 (1.19-2.47) 1.30 (0.76-2.25)
 Low HDL-C 1.76 (1.18-2.61) 1.87 (1.22-2.85)
 Impaired fasting glucosec 0.97 (0.46-2.05) 1.34 (0.67-2.68)
 The metabolic syndromed 1.76 (0.91-3.40) 2.00 (0.84-4.74)

BMI, body mass index; CI, confidence interval; HDL-C, High density lipoprotein cholesterol; NHANES, National Health and Nutrition Examination Survey; OR, odds ratio.

a Calculated as weight in kilograms divided by the square of height in meters.

b Defined as total cholesterol level > 200 mg/dL (5.2 mmol/L).

c Measured in a subset of 2,542 participants and defined as glucose level > 100 mg/dL (5.6 mmol/L).

d Defined in adults according to National Cholesterol Education Program Adult Treatment Panel III criteria21; in adolescents.

Table 3.
Correlation between the level of physical fitness and cardiovascular disease risk factor among male adolescents (adapted from KAPHA Study 1st year data unpublished)
Push-ups r P VO2max r P
Weight (kg) -.167 .013 -.739 .000
BMI -.179 .008 -.798 .000
Fat mass (kg) -.312 .000 -.775 .000
Body fat (%) -.312 .000 -.760 .000
WC (cm) -.246 .000 -.739 .000
SBP (mm Hg) .015 .827 -.036 .592
DBP (mm Hg) .013 .846 -.071 .297
Fasting glucose (mg/dL) -.034 .619 -.083 .222
TC (mg/dL) .007 .914 -.213 .002
TG (mg/dL) -.06 .372 -.253 .000
HDL-C (mg/dL) .037 .581 .183 .006
hs-CRP (mg/dL) .028 .678 -.026 .700
Fasting insulin (µIU/mL) -.167 .013 -.369 .000
HOMA-IR -.164 .015 -.368 .000
IGF-1 -.106 .117 -.146 .031
IGFBP-3 -.084 .213 -.128 .059
Average IMT -.253 .015 -.183 .080
Maximum IMT -.393 .000 -.229 .028

Values are presented as mean ± SE. BMI, body mass index; WC, waist circumference; SBP, systolic blood pressure; DBP, diastolic blood pressure; TC, total cholesterol; TG, triglycerides; HDL-C, high density Iipoprotein-cholesterol; hs-CRP, high sensitivity C-reactive protein; HOMA-IR, homeostasis model assessment-insulin resistance; PA, physical activity; IGF-1, insulin-like growth factor 1; IGFBP-3, insulin-like growth factor binding protein; IMT, intima-media thickness.

Table 4.
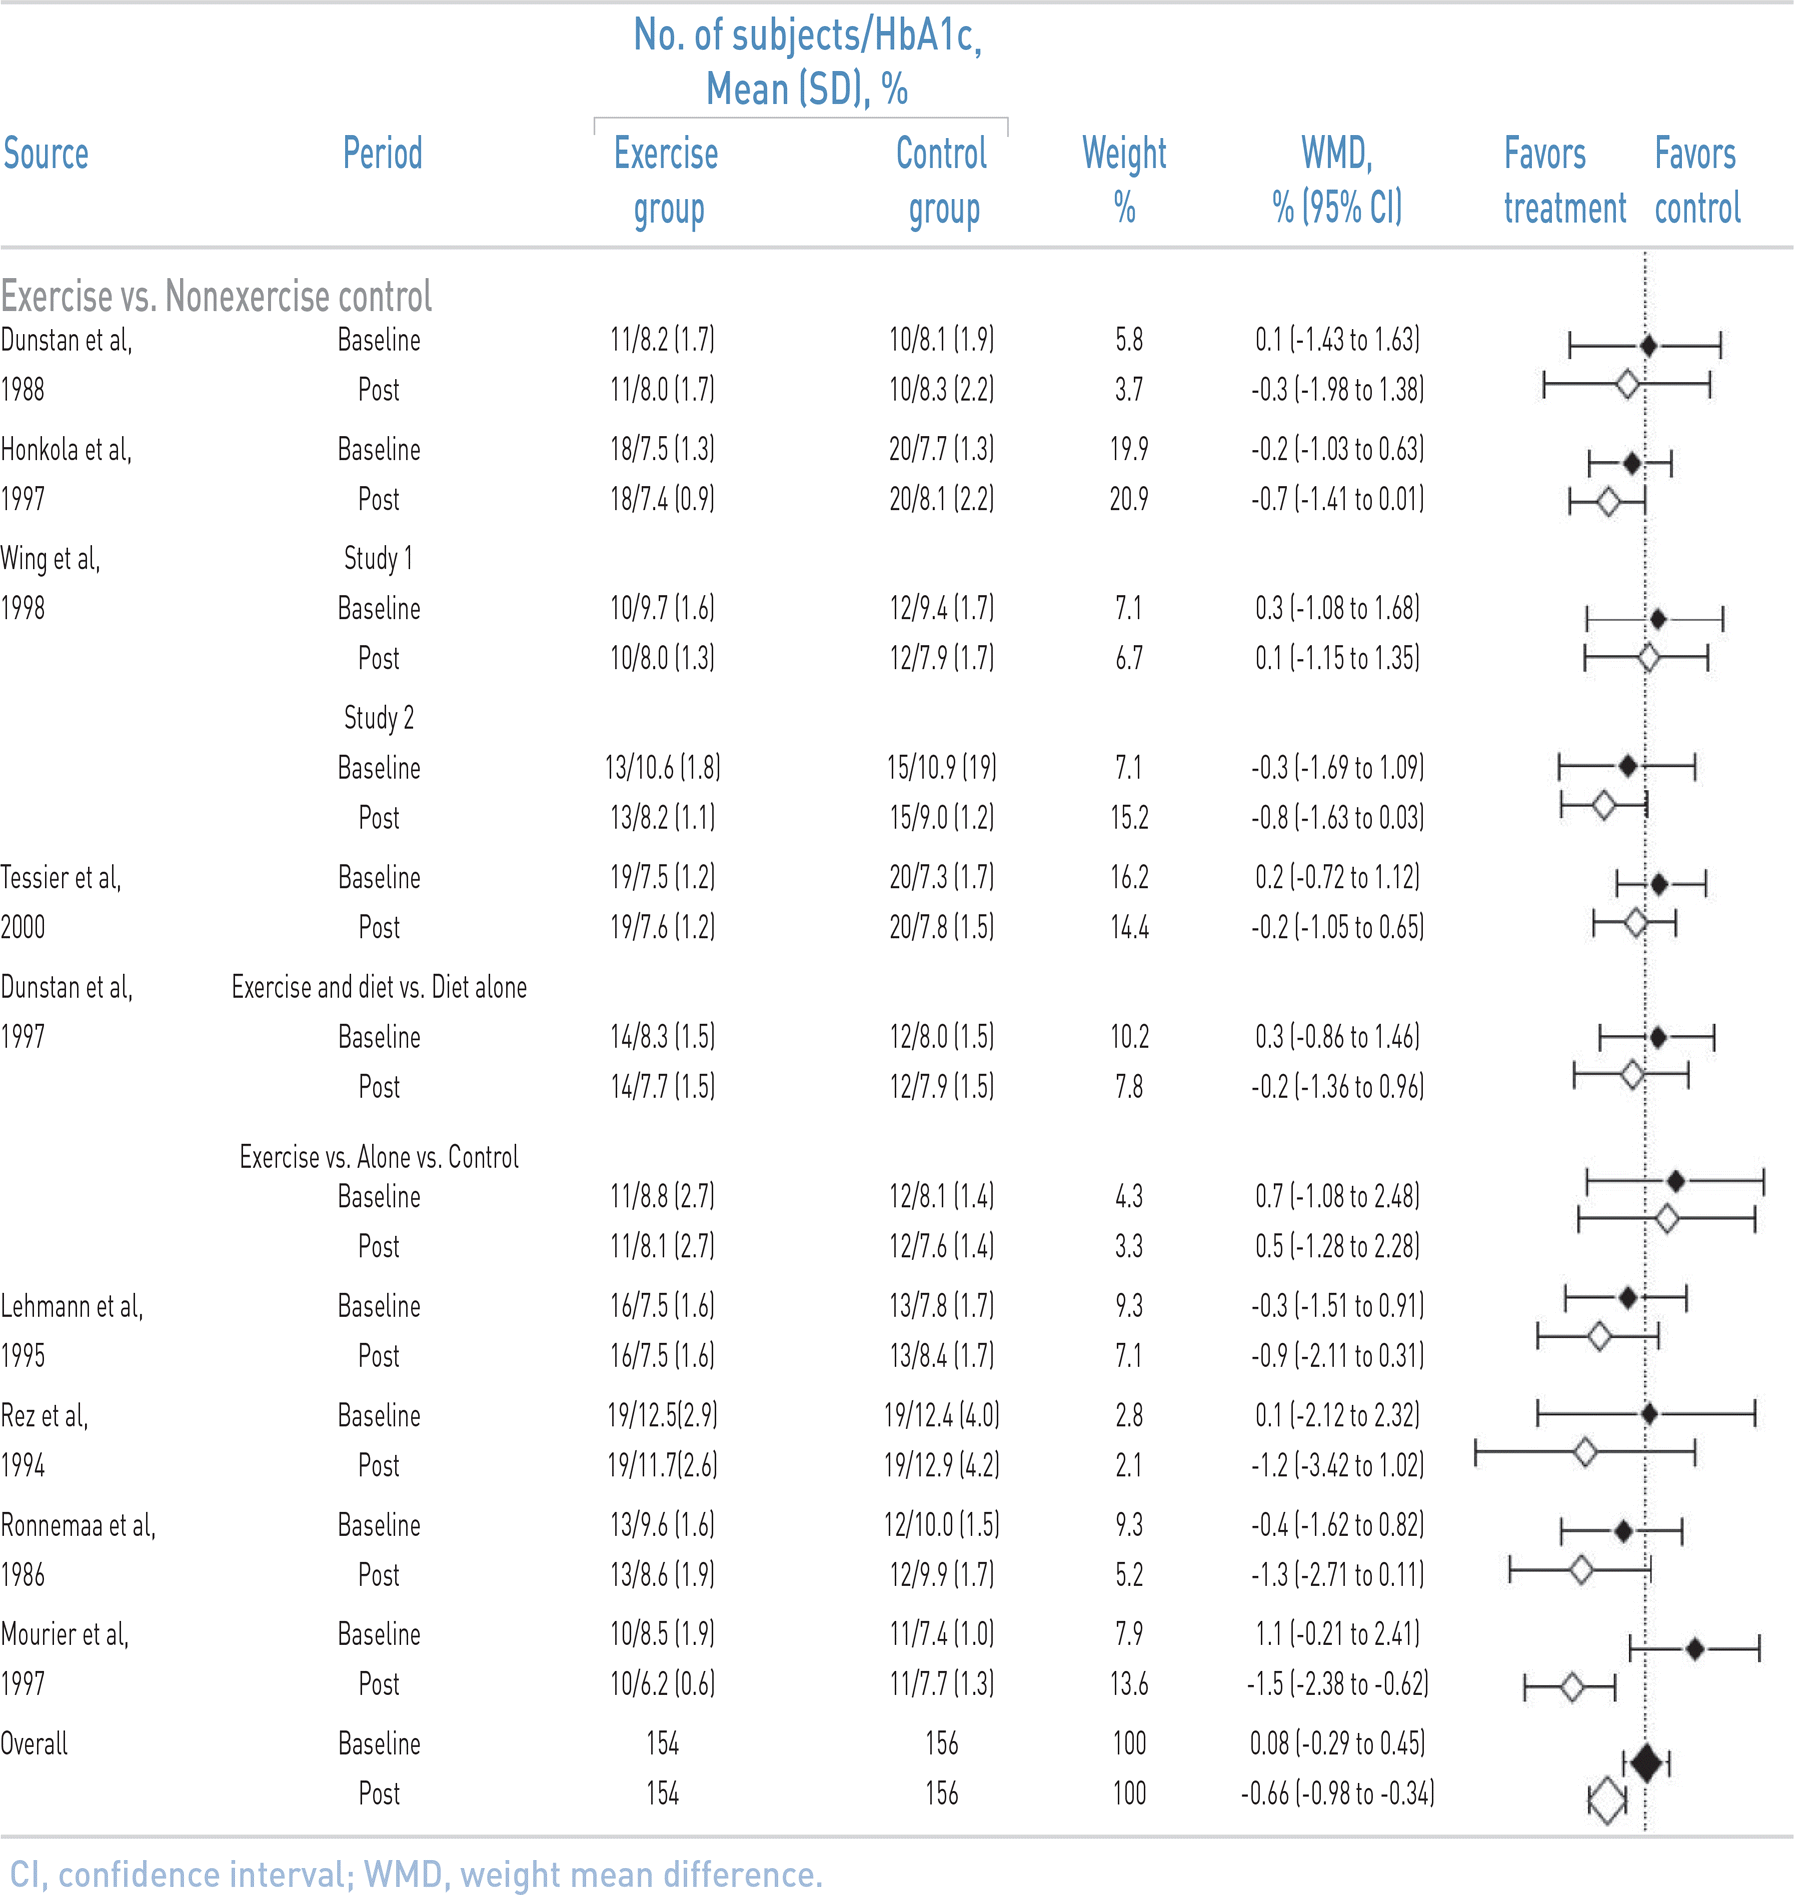
Meta-Analysis in physical activity participation and glucose control (HbA1c) (adapted from Boule et al. JAMA 2001;286:1218-27 [2])
jkd-12-13t4.tif
Table 5.
Relative risks for the abnormal values in blood pressure, glucose, total cholesterol and BMI in adulthood across the level of physical fitness during adolescence (adapted from Jekal et al. Korean Diabetes J 2010;34:126-34 [10])
1st group 2nd group 3rd group
Males
 No. 883 1,972 471
 FG (≥ 110) 1.00 1.02(0.78 to 1.32) 0.76(0.51 to 1.12)
 BP (SBP ≥ 130 or DBP ≥ 85) 1.00 1.03(0.87 to 1.21) 1.15(0.92 to 1.45)
 TC (≥ 200) 1.00 0.93(0.80 to 1.10) 0.91(0.73 to 1.14)
 BMI (≥ 25) 1.00 0.87(0.74 to 1.02) 1.30(1.04 to 1.63)
Females
 No. 208 377 51
 FG (≥ 110) 1.00 1.69(0.74 to 3.89) 3.11(1.00 to 9.65)
 BP (SBP ≥ 130 or DBP ≥ 85) 1.00 1.52(0.89 to 2.58) 2.09(0.92 to 4.72)
 TC (≥ 200) 1.00 1.01(0.69 to 1.49) 1.46(0.76 to 2.83)
 BMI (≥ 25) 1.00 1.27(0.79 to 2.05) 2.36(1.15 to 4.86)

Data presented as the relative risk (95% confidence interval). 1st group, most fit; 3rd group, least fit. FG, fasting glucose; BP, blood pressure; SBP, systolic blood pressure; DBP, diastolic blood pressure; TC, total cholesterol; BMI, body mass index.

TOOLS
Similar articles