Abstract
Self-monitoring of blood glucose (SMBG) and point-of-care testing are widely used in the management of diabetic outpatients. However, SMBG records are sometimes inaccurate, and may differ from glucose values measured in the hospital. Therefore, the aim of our study was to evaluate the effects of patient education regarding glucometer use on blood glucose levels and to compare the glucose values obtained by six different types of glucometers currently used in Korea. Fifty-six diabetic patients participated in the present study. Each patient visited the hospital in a fasting state. Fasting plasma glucose (FPG) levels in capillary blood samples were measured by doctors and by the patients themselves before and after patient education sessions. Then, glucose levels were measured with each of the six glucometers by doctors and by the patients themselves. The differences between FPG and glucose values measured using glucometers were compared, and their relationships with HbA1c were also assessed. There were no significant differences between glucose levels measured by patients regardless of glucometer education. We obtained similar results for differences between glucose levels measured by patients and doctors. Patient HbA1c levels were not correlated with differences in measurements between glucometers and FPG. Measurements of glucose levels by the six different glucometers did not differ significantly. Our study indicates that education about SMBG, including glucometer handling, is important to increase SMBG accuracy, but that errors in SMBG records are trivial for glucometer users and that the different glucometers used in Korea demonstrate similar accuracy.
Go to : 
REFERENCES
1. Goldstein DE, Little RR, Lorenz RA, Malone JI, Nathan D, Peterson CM. Tests of glycemia in diabetes. Diabetes Care. 1995; 18:896–909.

2. Cohen M, Boyle E, Delaney C, Shaw J. A comparison of blood glucose meters in Australia. Diabetes Res Clin Pract. 2006; 71:113–8.

3. Gan D. International Diabetes Federation: Diabetes Atlas. 2nd ed.Brussels: IDF;2003. p. 17–71.
4. Park IB, Baik SH. Epidemiologic characteristics of diabetes mellitus in Korea: current status of diabetic patients using Korean health insurance database. Korean Diabetes J. 2009; 33:357–62.

5. Lee SY, Lee NY, Kim JW. Evaluation of 6 glucose testing systems. Korean J Lab Med. 2003; 23:170–9.
7. Bergenstal R, Pearson J, Cembrowski GS, Bina D, Davidson J, List S. Identifying variables associated with inaccurate self-monitoring of blood glucose: proposed guidelines to improve accuracy. Diabetes Educ. 2000; 26:981–9.

9. Sarol JN Jr, Nicodemus NA Jr, Tan KM, Grava MB. Self-monitoring of blood glucose as part of a multicomponent therapy among non-insulin requiring type 2 diabetes patients: a meta-analysis (1966-2004). Curr Med Res Opin. 2005; 21:173–84.
10. Welschen LM, Bloemendal E, Nijpels G, Dekker JM, Heine RJ, Stalman WA, Bouter LM. Self-monitoring of blood glucose in patients with type 2 diabetes who are not using insulin: a systematic review. Diabetes Care. 2005; 28:1510–7.
11. The International Organization for Standardization. In vitro diagnostic test systems-requirements for blood glucose monitoring systems for self-testing in managing diabetes mellitus. ISO/TC 212/SC. International Standard ISO 15197. Geneva: ISO;2003.
Go to : 
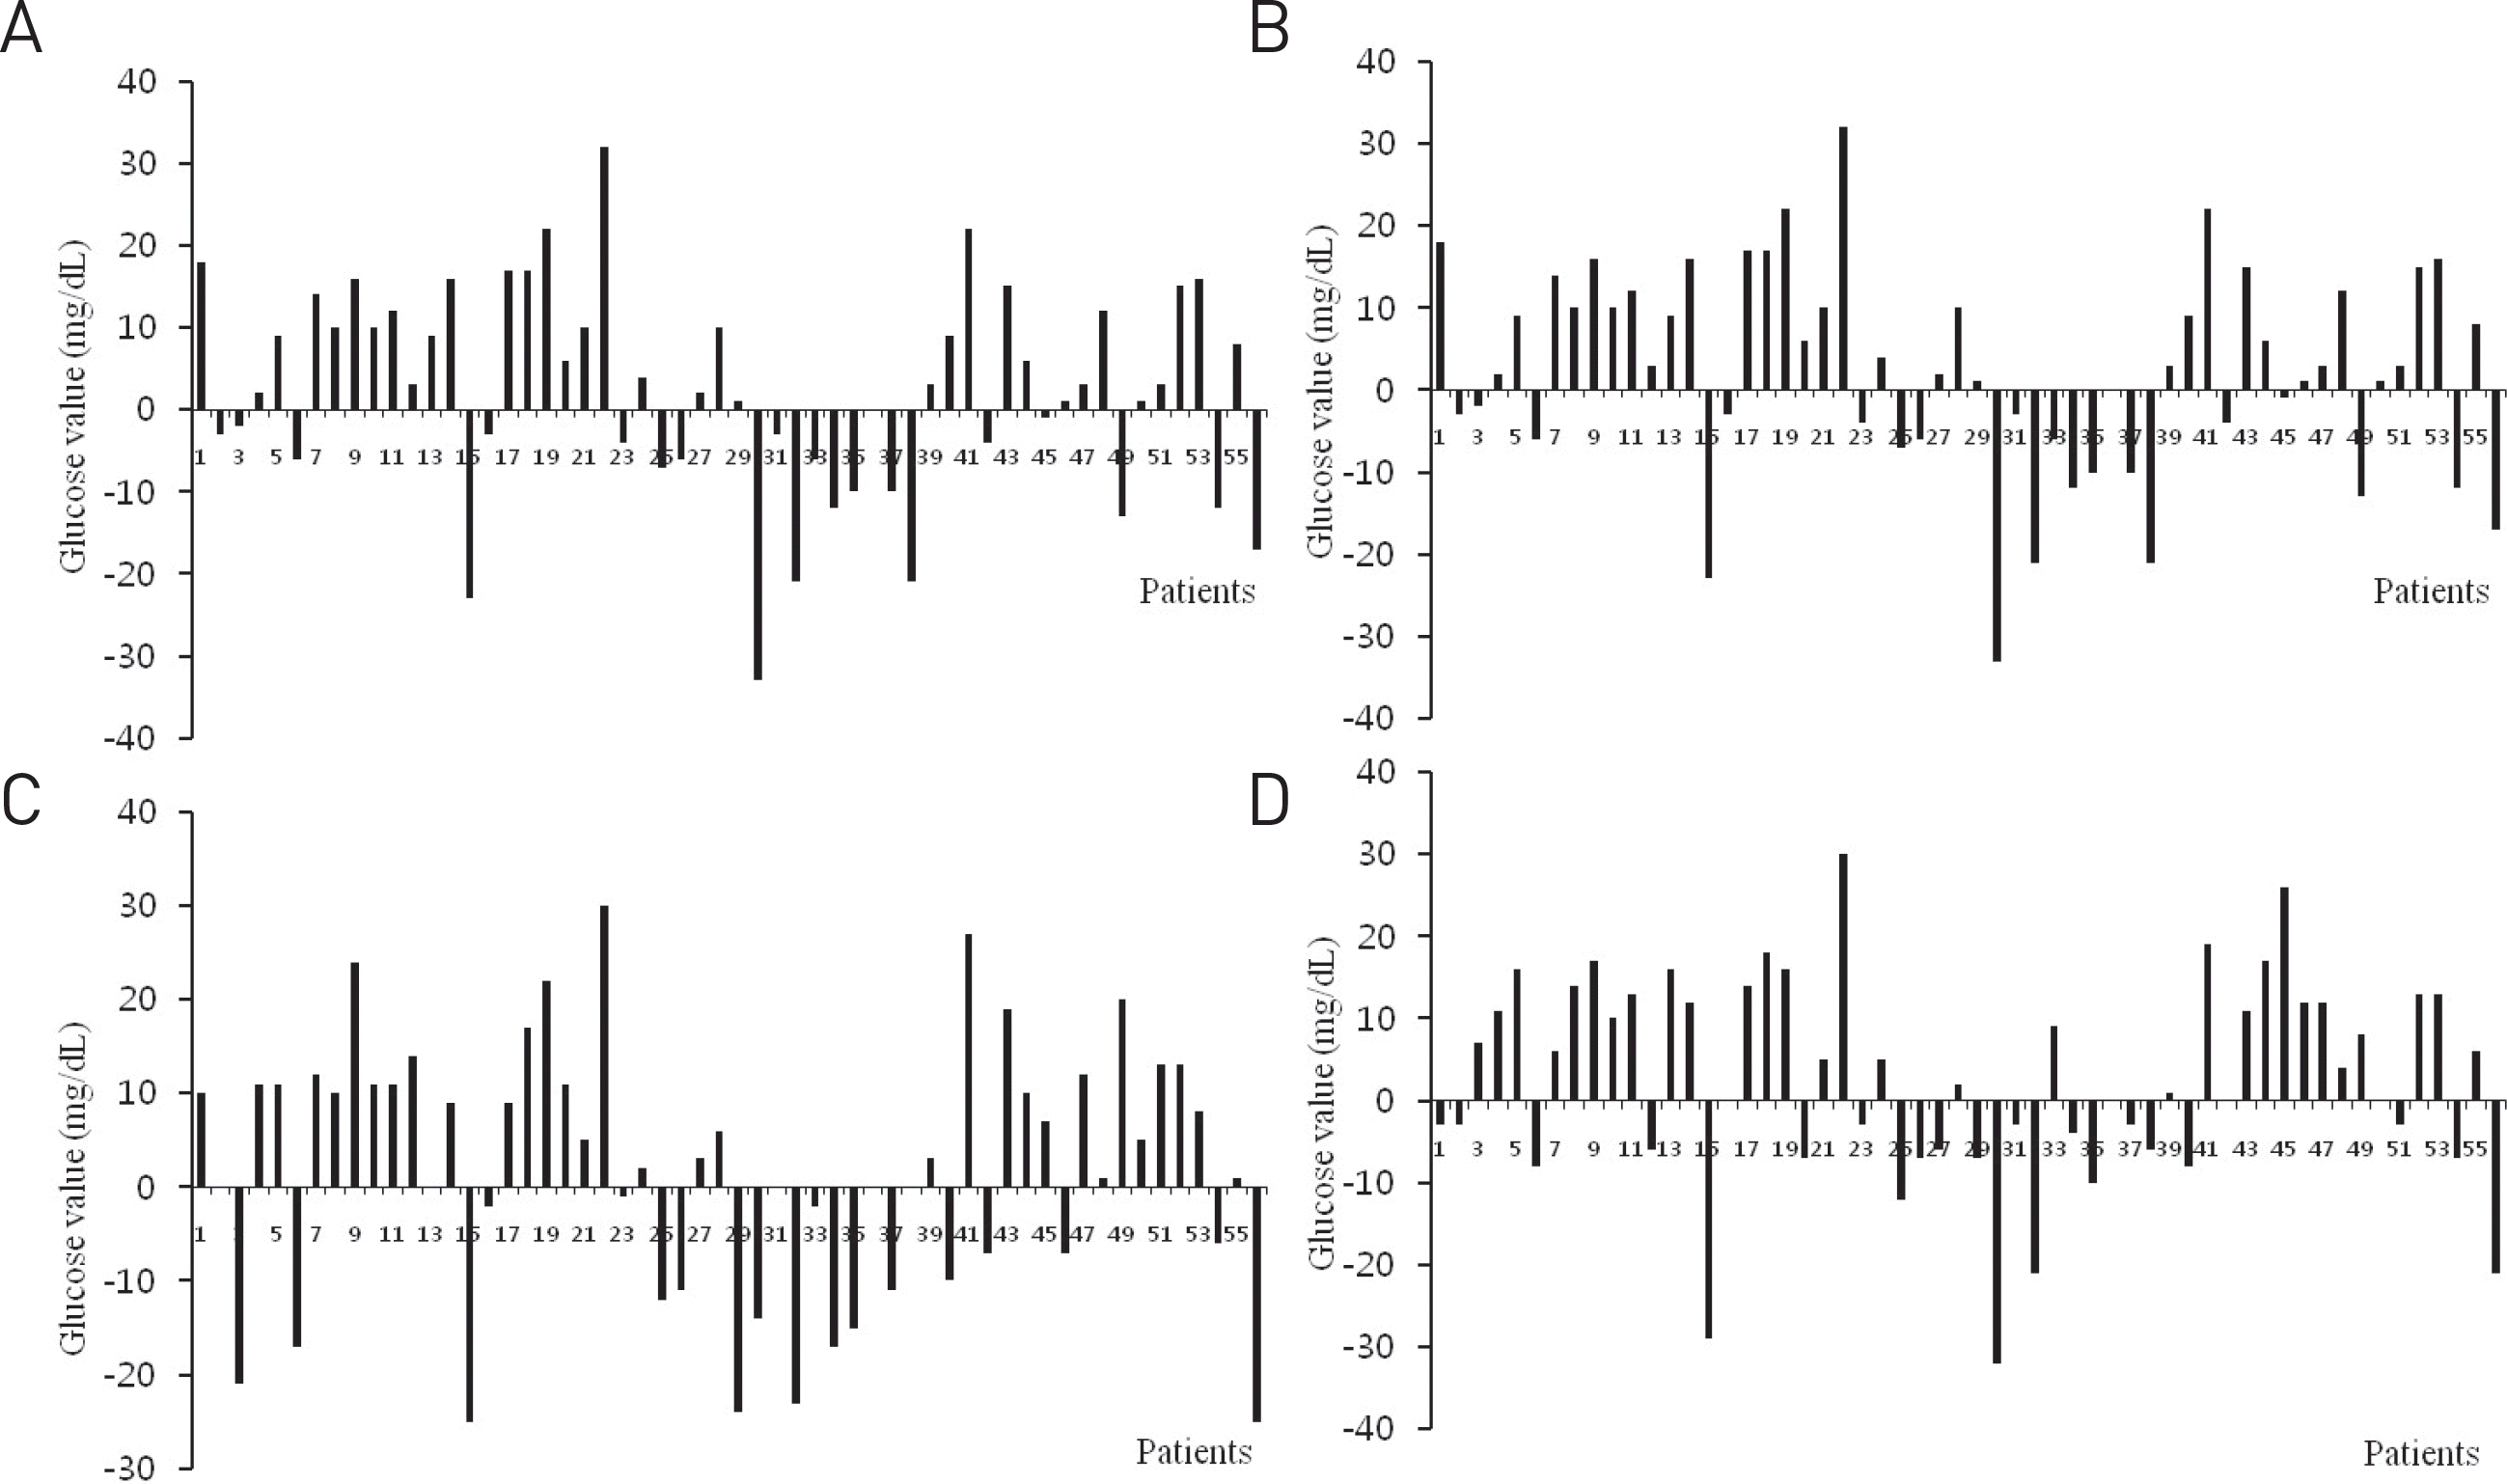
 | Fig. 1.The difference between fasting plasma glucose and glucose value measured from glucometer. (A) Patient-before education. (B) Patient-after education. (C) Doctor-before education. (D) Doctor-after education. Before and after a patient education, glucose levels in capillary blood samples were measured by doctor and patients themselves. After that, the degree of glucose differences between fasting plasma glucose and glucose values measured form glucometers was compared. |
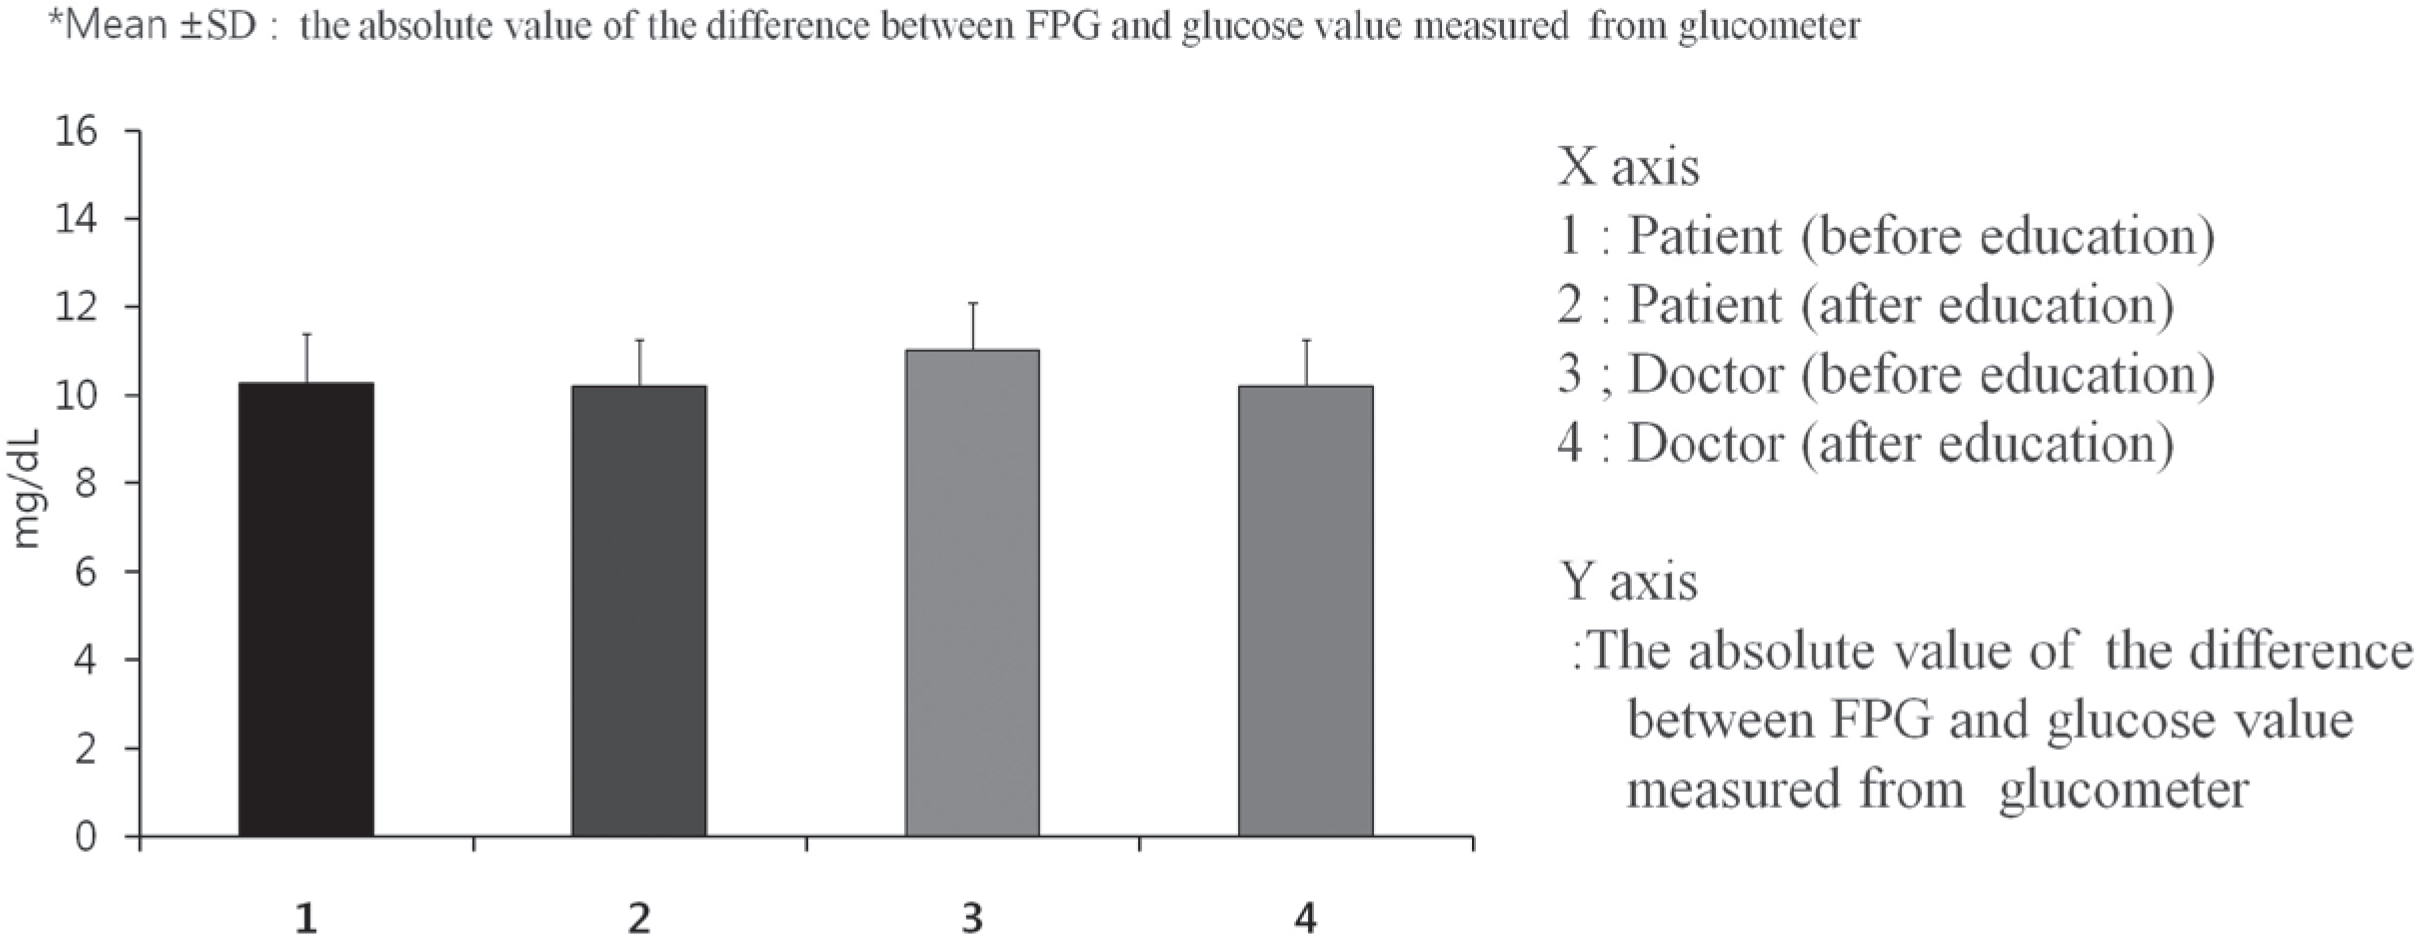
 | Fig. 2.The comparison of glucose values that measured before and after glucometer education. There was no remarkable difference between glucose levels measured by patients irrespective of glucometer education. And there was a similar result between glucose levels measured by patients and doctor. FPG, fasting plasma glucose. |
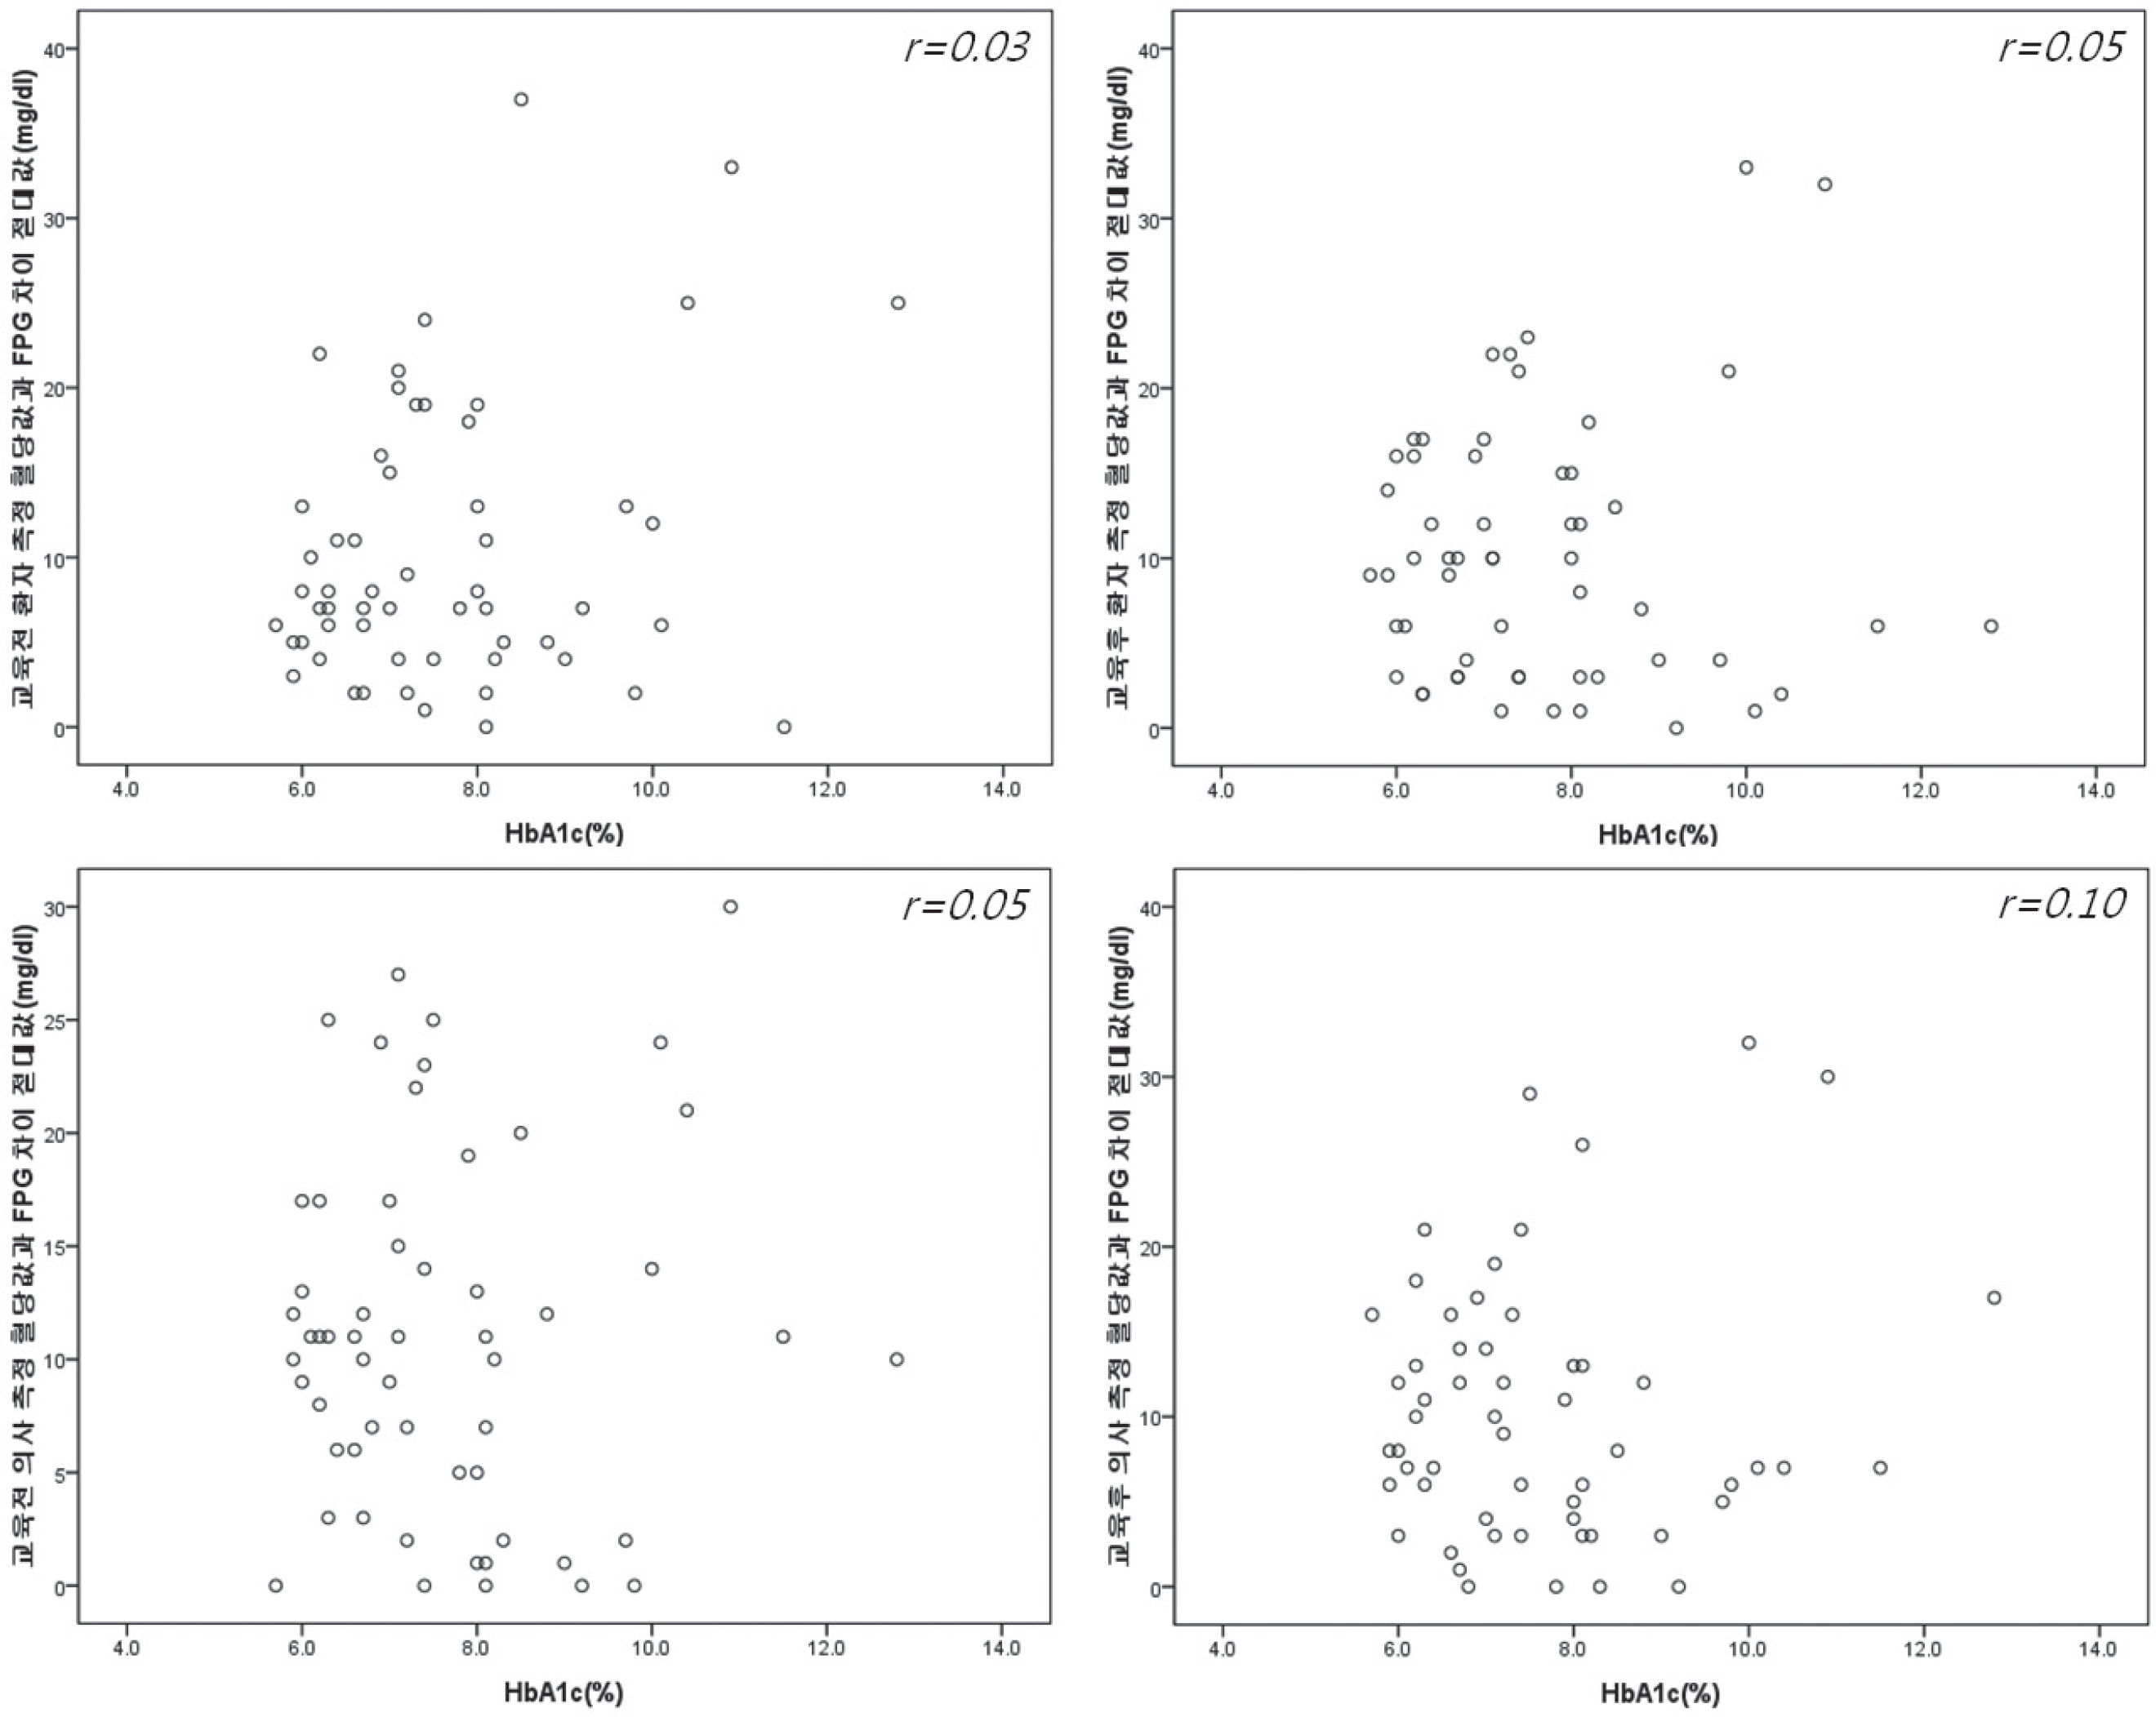
 | Fig. 3.Correlation between HbA1c and the absolute value of the difference between fasting plasma glucose (FPG) and glucose value measured form glucometer. Patient's HbA1C level was not correlated with the magnitude of the glucose difference between glucometer and FPG. |
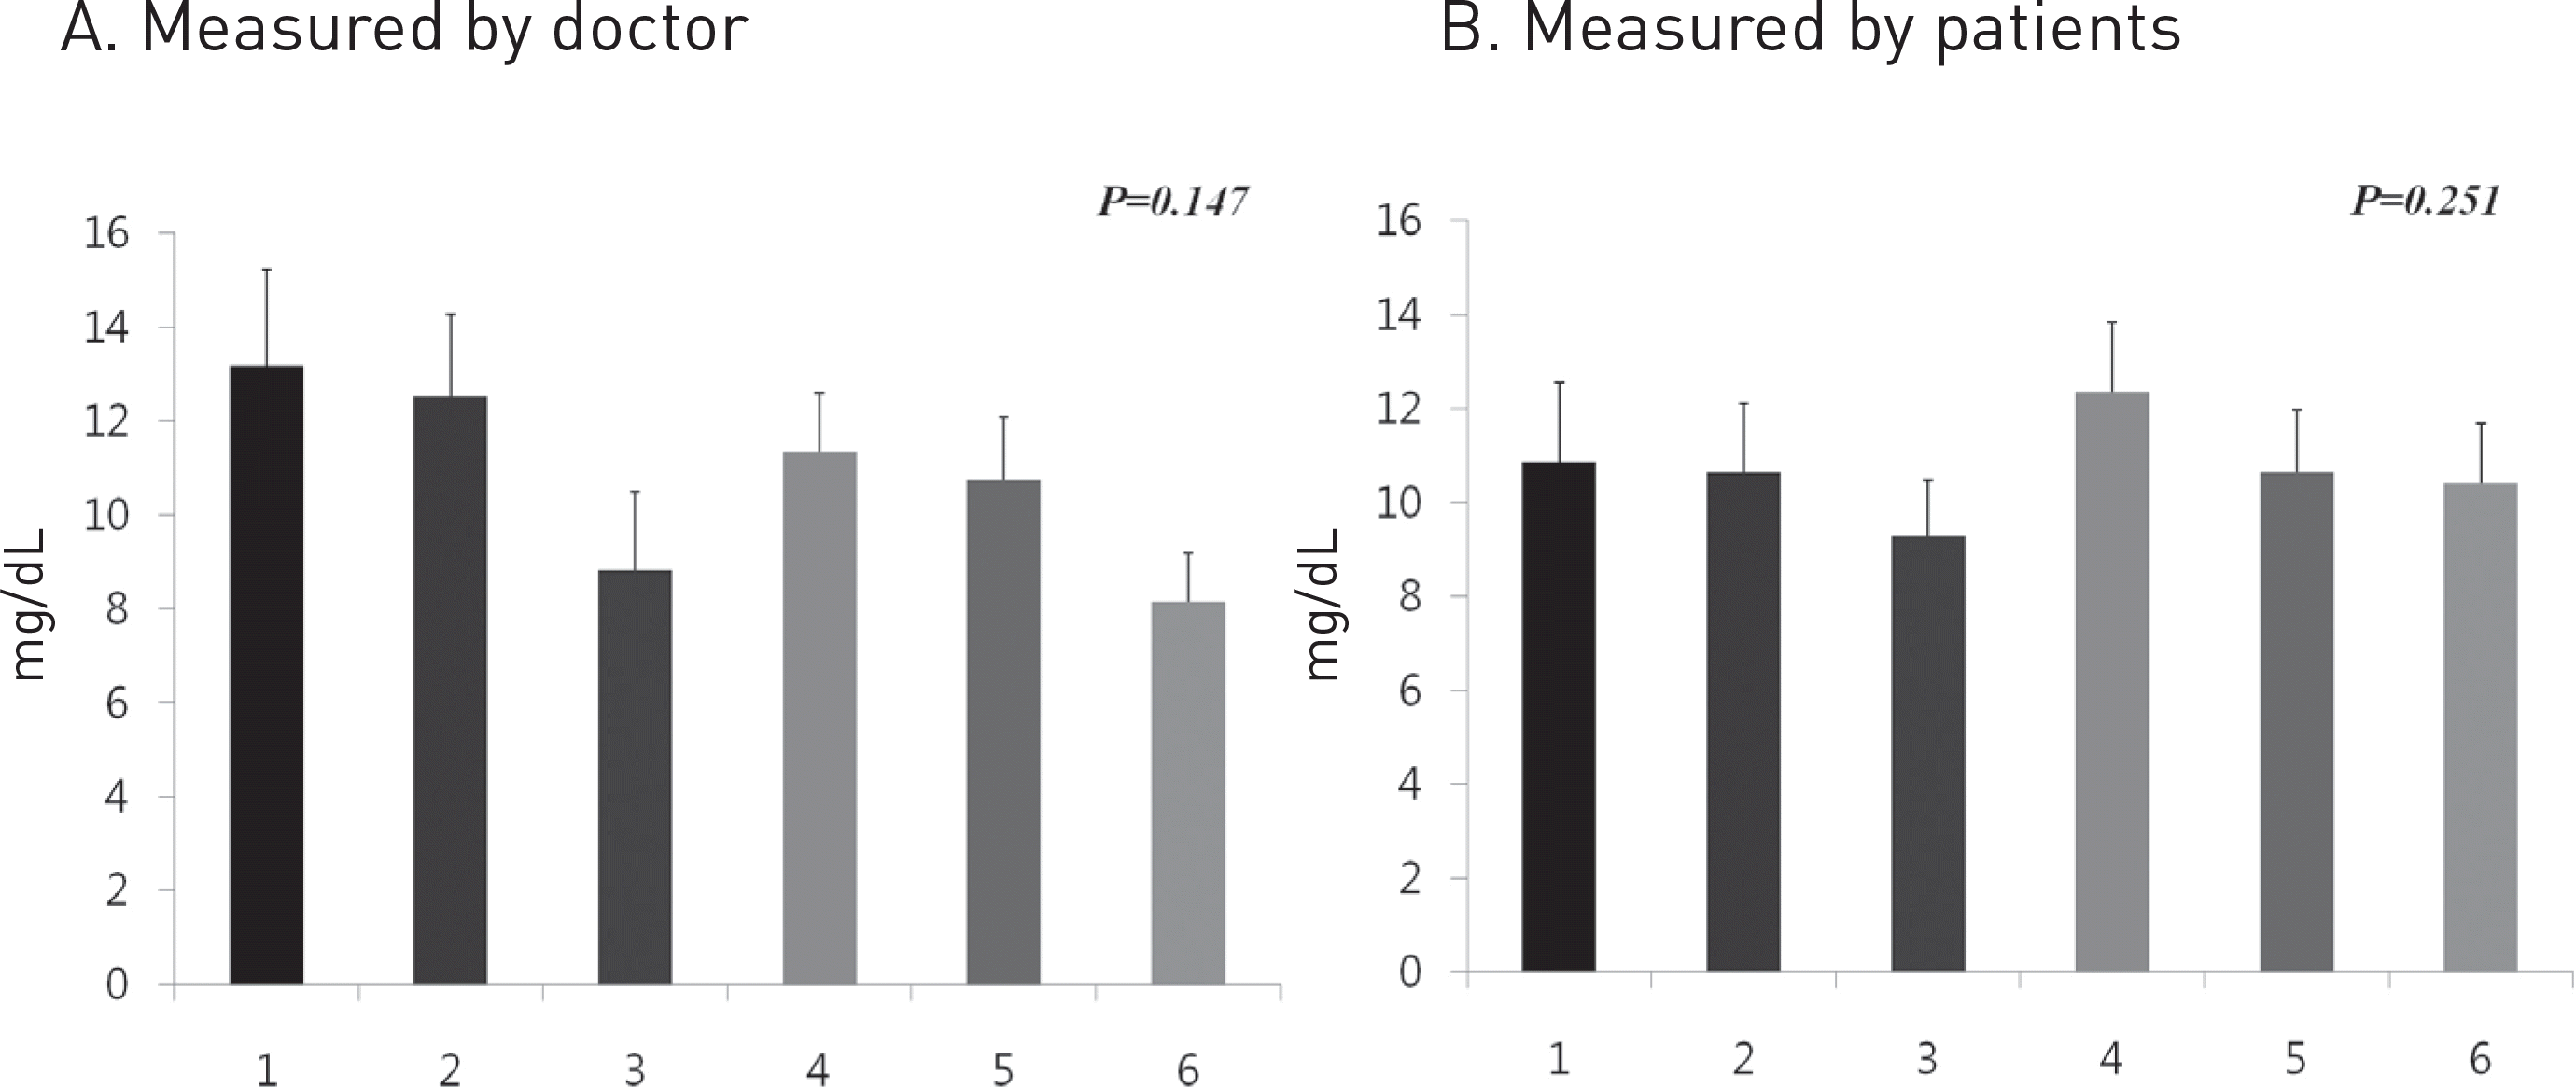
 | Fig. 4.The glucose value comparison among six glucometers. There were no statistically remarkable differences in glucose levels measured by six glucometers. X axis : six glucometers. Y axis : the absolute value of the difference between fasting plasma glucose and glucose value measured from glucometer. |
Table 1.
Baseline characteristics of patients
Table 2.
The comparison of glucose values that measured before and after glucometer education
| Comparison | Glucose valuea | P value |
|---|---|---|
| Patient (before/after) | 10.27 ± 8.25 / 10.20 ± 7.73 | 0.952 |
| Doctor (before/after) | 11.02 ± 7.95 / 10.21 ± 7.71 | 0.407 |
| Before education (pt/dr) | 10.27 ± 8.25 / 11.02 ± 7.95 | 0.453 |
| After education (pt/dr) | 10.20 ± 7.73 / 10.21 ± 7.71 | 0.984 |
Table 3.
The glucose value comparison among six glucometers
| Glucose valuea | ||
|---|---|---|
| Glucometer | Measured by doctor | Measured by patient |
| 1 | 13.18 ± 15.29 | 13.86 ± 12.69 |
| 2 | 12.52 ± 13.09 | 10.64 ± 10.95 |
| 3 | 08.82 ± 12.55 | 9.30 ± 8.73 |
| 4 | 11.34 ± 9.390 | 12.36 ± 10.92 |
| 5 | 10.73 ± 10.08 | 10.64 ± 10.02 |
| 6 | 8.14 ± 7.66 | 10.41 ± 9.590 |
Table 4.
Common errors in glucometer technique made by patients during self-monitoring of blood glucose


 PDF
PDF ePub
ePub Citation
 Print
Print


 XML Download