Abstract
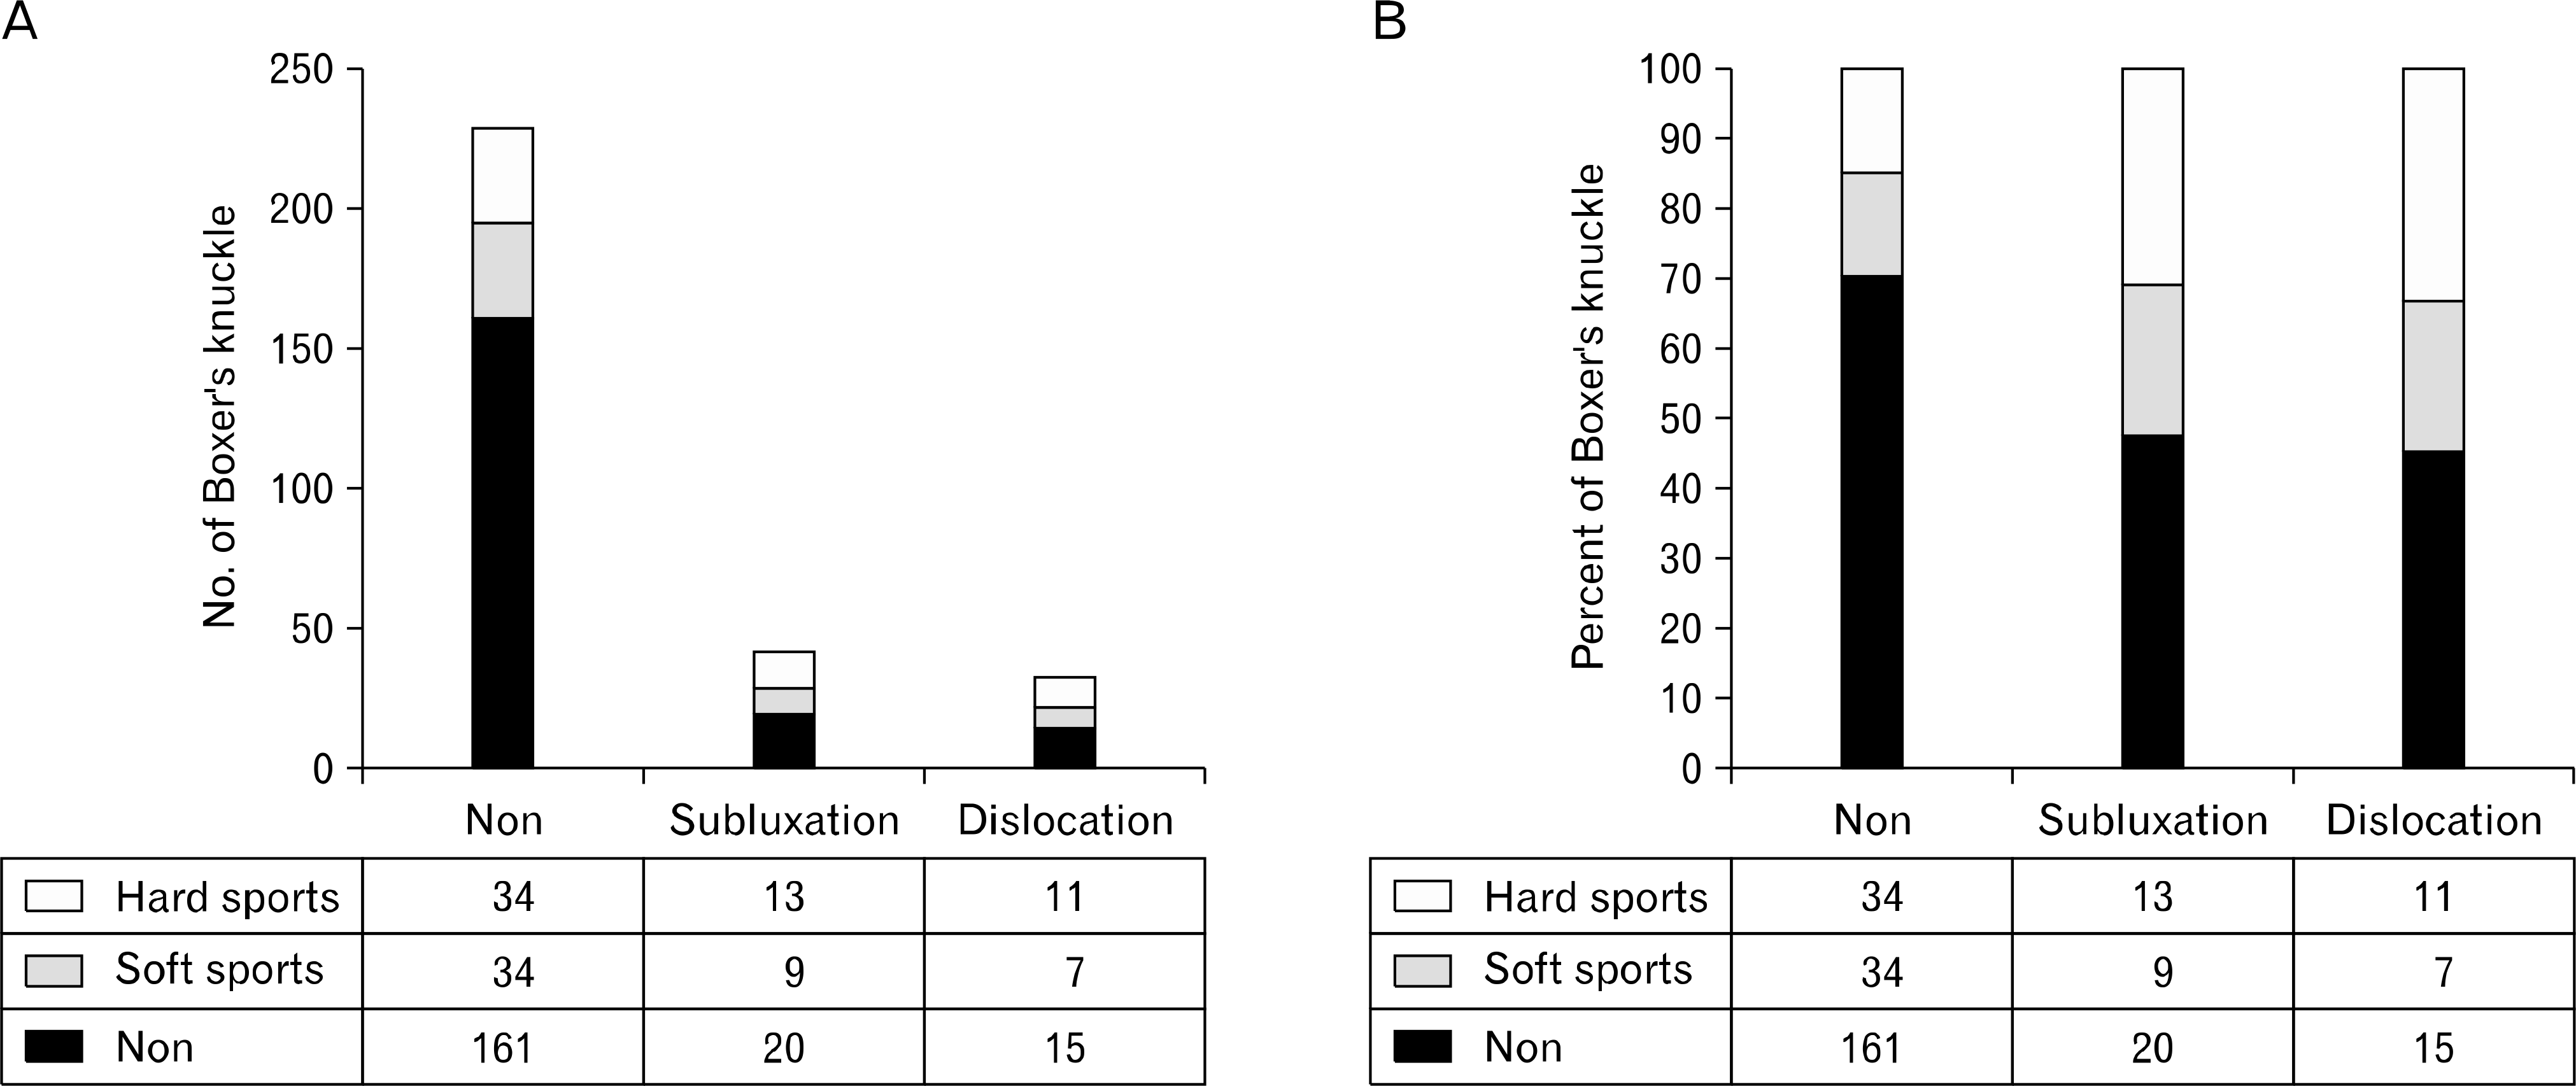
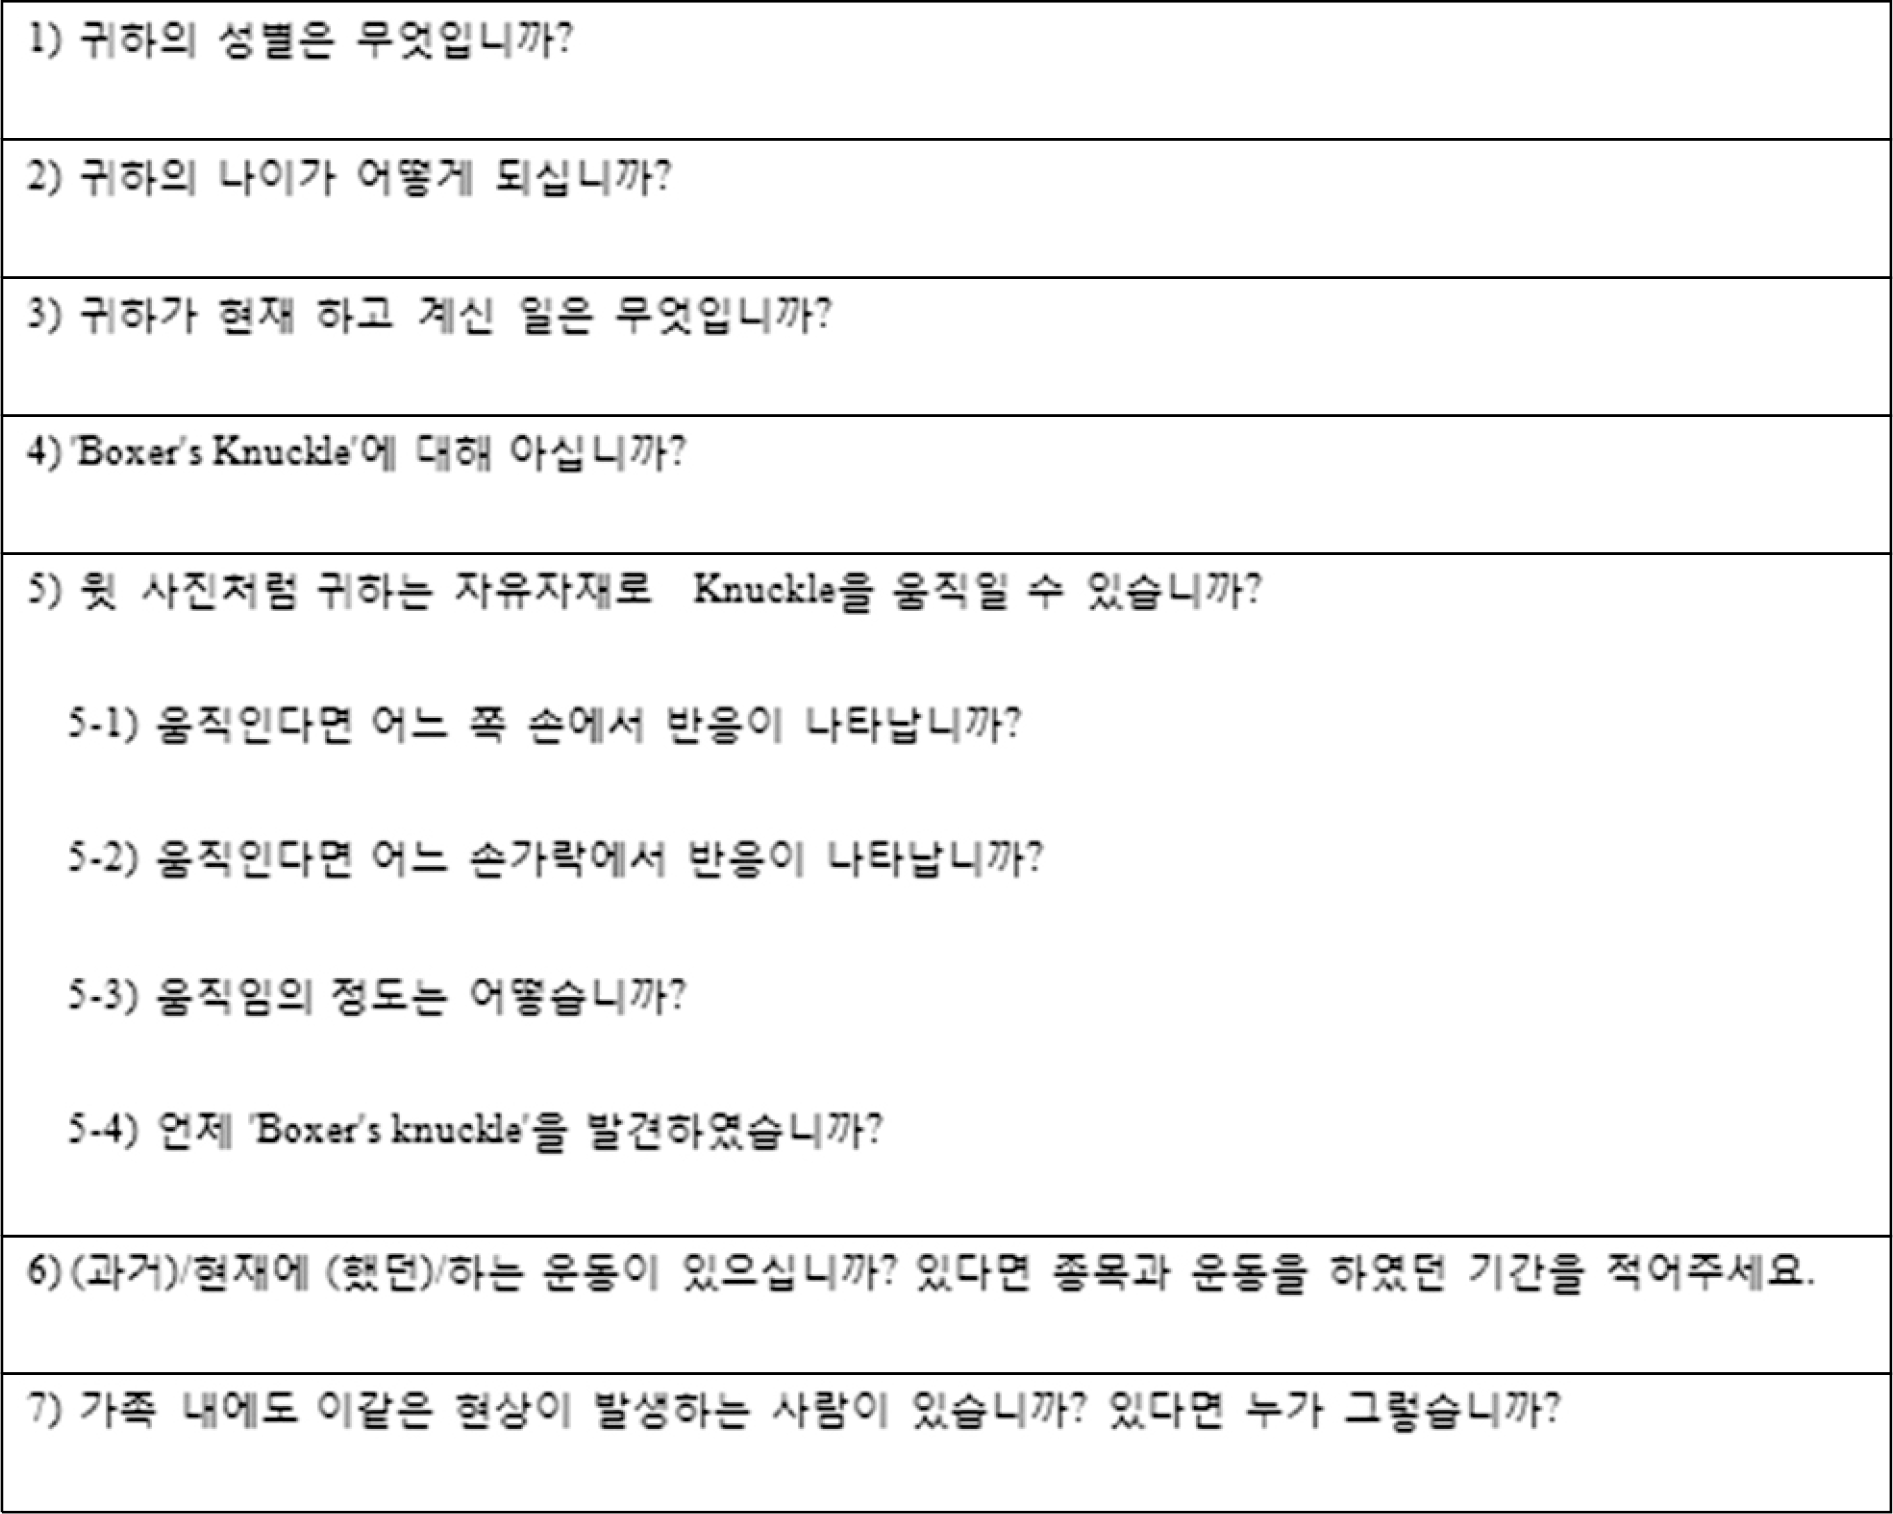
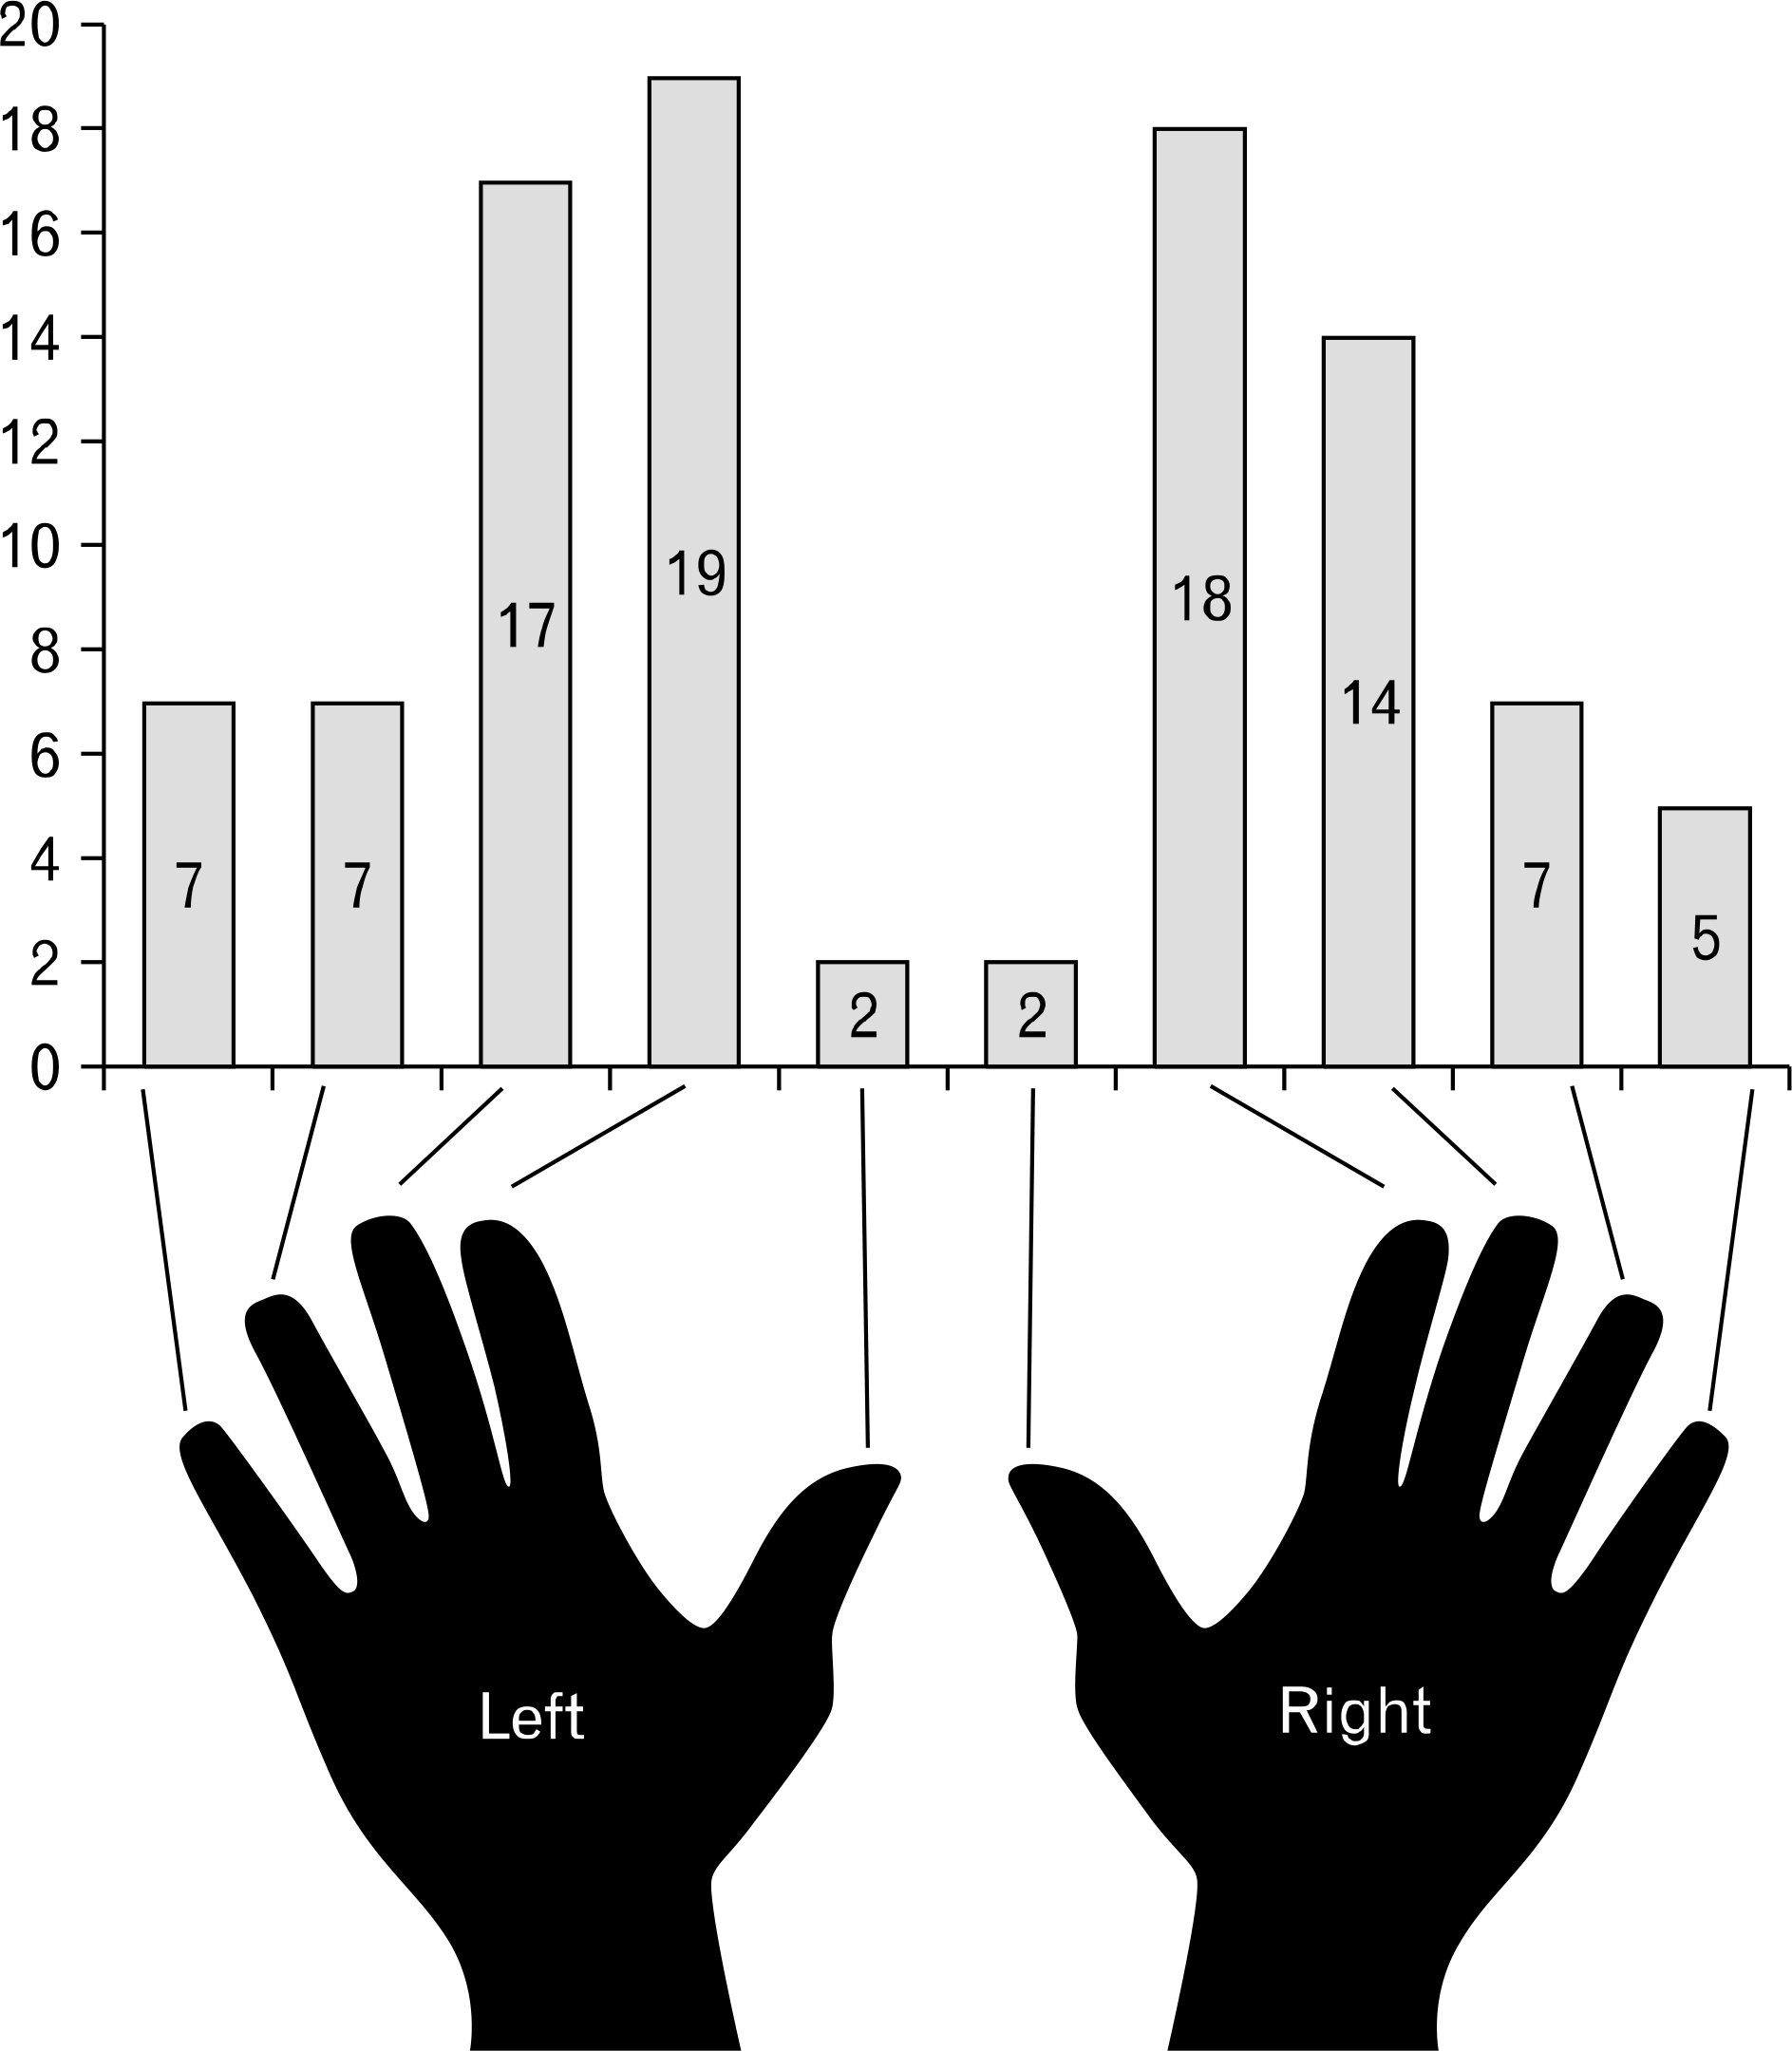
Boxer's knuckle has become known as rare diseases caused by trauma, congenital, idiopathic, degenerative and more. Because there is no research for specific prevalence rate, the purpose of this study is to figure out the possibility of the prevalence rate of Korean early 20's who relied on data from the Internet questionnaire about the group suspected of having Boxer's knuckle by self-diagnosis after an indirect explanation for Boxer's knuckle. The positive response rate of Boxer's knuckle analyzed by a public Internet survey questionnaire contains personal information, Boxer's knuckle symptoms, location, risk factors, family history, and so on. Total of 304 respondents include 106 males (median age, 23 years; Q1, 21–Q3, 23), 198 females (median age, 21 years; Q1, 21–Q3, 23). Thirty-three patients had severe symptoms of Boxer's knuckle (dislocation) and 42 patients had mild symptoms of Boxer's knuckle (subluxation). Sex, age, type of exercise and duration of exercise, family history, etc were analyzed. It is a result that whether or not history of severe exercise and family history are statistical significances as risk factors. Fifteen (7.7%) of 196 people who do not exercise, seven (14.0%) of 50 people with light exercise, 11 (19.0%) of 58 people with severe exercise, 28 (9.5%) of 294 people without family history and five (50.0%) of 10 people with family history showed symptoms of the Boxer's knuckle. The positive response rate of the Boxer's knuckle is 10.9%. The exercise in the possibility of injury and family history are significant predictors.
Go to : 
References
1. Ritts GD, Wood MB, Engber WD. Nonoperative treatment of traumatic dislocations of the extensor digitorum tendons in patients without rheumatoid disorders. J Hand Surg Am. 1985; 10:714–6.

2. Inoue G, Tamura Y. Dislocation of the extensor tendons over the metacarpophalangeal joints. J Hand Surg Am. 1996; 21:464–9.

3. Green DP, Hotchkiss RN, Pederson WC, Wolfe SW. Green's operative hand surgery. 5th ed.Philadelphia: Churchill Li-vingstone;2005.
4. Araki S, Ohtani T, Tanaka T. Acute dislocation of the extensor digitorum communis tendon at the metacarpophalangeal joint: a report of five cases. J Bone Joint Surg Am. 1987; 69:616–9.

5. Ishizuki M. Traumatic and spontaneous dislocation of extensor tendon of the long finger. J Hand Surg Am. 1990; 15:967–72.

6. Wheeldon FT. Recurrent dislocation of extensor tendons in the hand. J Bone Joint Surg Br. 1954; 36:612–7.

7. Kilgore ES, Graham WP, Newmeyer WL, Brown LG. Correction of ulnar subluxation of the extensor communis. Hand. 1975; 7:272–4.

8. Carroll C 4th, Moore JR, Weiland AJ. Posttraumatic ulnar subluxation of the extensor tendons: a reconstructive technique. J Hand Surg Am. 1987; 12:227–31.

9. Saldana MJ, McGuire RA. Chronic painful subluxation of the metacarpal phalangeal joint extensor tendons. J Hand Surg Am. 1986; 11:420–3.
Go to : 
 | Fig. 2.(A) Number of Boxer's knuckle according to type of sports. (B) Percentage of Boxer's knuckle according to type of sports. |
Table 1.
Summary of patient characteristics with Boxer's knuckle
Table 2.
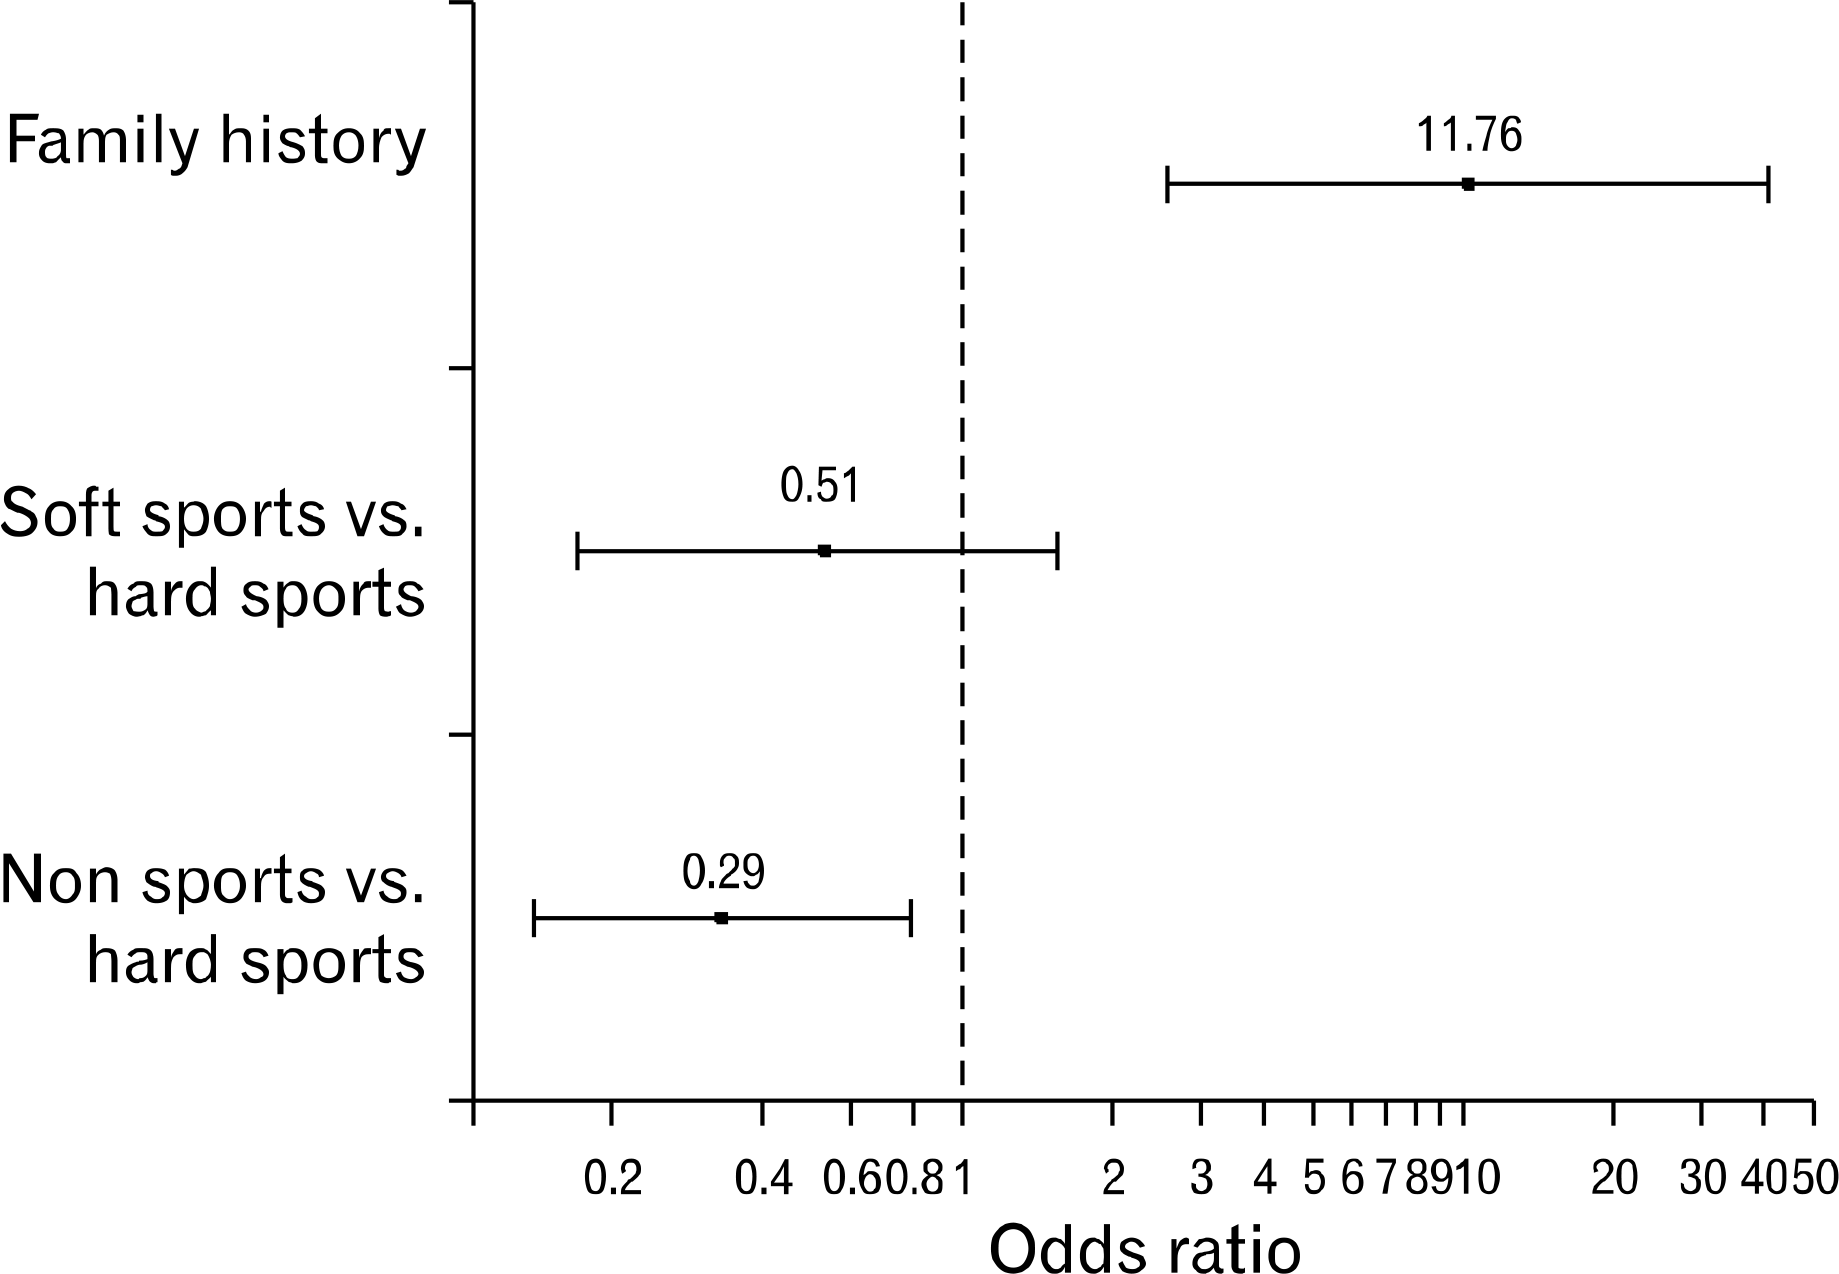
Result of logistic regression
|
Univariable analysis |
Multivariable analysis |
|||||||
|---|---|---|---|---|---|---|---|---|
| Estimate | p-value | Odds ratio | CI of odds ratio | Estimate | p-value | Odds ratio | CI of odds ratio | |
| Age (yr)∗ | ||||||||
| 20−25 | 0.5401 | 0.4762 | 1.72 | 0.48−10.97 | 1.0853 | 0.1824 | 2.96 | 0.74−20.69 |
| ≥26 | 0.5232 | 0.6848 | 1.69 | 0.07−20.00 | 0.8312 | 0.5469 | 2.30 | 0.09−31.98 |
| Female vs. male | 0.2325 | 0.5606 | 1.26 | 0.59−2.88 | 0.0533 | 0.9001 | 1.05 | 0.47−2.51 |
| Strength of exercise | ||||||||
| Non vs. hard | −1.0382 | 0.0156 | 0.35 | 0.15−0.84 | −1.2403 | 0.0059 | 0.29 | 0.12−0.71 |
| Soft vs. hard | −0.3630 | 0.4913 | 0.70 | 0.24−1.93 | −0.6779 | 0.2356 | 0.51 | 0.16−1.51 |
| Family history | 2.2513 | 0.0007 | 9.50 | 2.50−36.14 | 2.4646 | 0.0007 | 11.76 | 2.78−51.83 |


 PDF
PDF ePub
ePub Citation
 Print
Print


 XML Download