Abstract
This study concerns norm-referenced criteria for isokinetic strength of the lower limbs for the Korean high school baseball players. Two hundred one high school baseball players were participated in this study. They didn't have any medical problem at the lower limbs. Each test was conducted four times in the ankle plantar flexion/dorsiflexion test at 30o/sec speed, knee flexion/ extension test was conducted four times at 60o/sec speed. Humac Norm (CSMI, USA) system was used to obtained the value of peak torque, peak torque % body weight. The results were presented as a norm-referenced criterion value using 5-point scale of cajori, by 5 group (6.06%, 24.17%, 38.30%, 24.17%, and 6.06%) and a few suggestions from this study as follows. The provided criterion of peak torque and peak torque % body weight are very useful information for baseball palyers, baseball coach, athletic trainers and sports injury rehabilitation experts, to utilize as an objective clinical assessment data.
Go to : 
REFERENCES
1.Korea Baseball Association. Baseball players' registration [Internet]. Seoul: Baseball Association News;c2015. [cited 2015 May 01]. Available from:. http://www.korea_baseball.com/news/notice/noitice_view.asp?CAT=N01&BBS=A1&PAGE=1&NUM=8512&PRNNUM=23.
2.Lim SK., Lee SI., Kang HD, et al. Norm-referenced criteria of the lower limb extensor and flexor for the Korea pro-baseball player. Korean J Physic Educ. 2002. 41:369–376.
3.Humer M., Kosters A., Muller E. Dynamic and static maximum strength in closed kinetic chain movements. Trunk flexion/extension and rotation. Sportverletz Sportschaden. 2011. 25:13–21.
4.Pauletto B. Strength training for coaches. Champaign (IL): Leisure Press;1991.
5.Sun SK., Kim KJ., Yoon SW., Jung DS. Norm-referenced criteria for the leg muscular strength various athletic events. Phys Sci Lab Rep. 2005. Ⅰ:208–24.
6.Sun SK., Jung DC., Lee KK, et al. A Research to set a standard norm of the knee extensor and flexor on muscular strength for adult population to ages. Korea Sport Res. 2006. 17:287–96.
7.Kim YB. Correlation among fast-ball, slider-speed, physique, and the related isokinetic muscular peak torque in university baseball pitcher [dissertation]. Seoul: Dankook University;2013.
8.Hagerman FC., Starr LM., Murray TF. Effect of long-term fitness program on professional baseball player. Phys Sportsmed 989: 17;. 101–19.
9.Baltzopoulos V., Brodie DA. Isokinetic dynamometry: applications and limitation. Sports Med. 1989. 8:101–16.
10.Perrine DH. Isokinetic exercise and assessment. Champaign (IL): Human Kinetics;1993.
11.Chun SY., Jeon KK., Park DS. The effect of body composition and isokinetic knee and ankle strength of adult and elite football players. Korea J Sports Sci. 2012. 21:1385–95.
12.Kim JH., Jeon YK., Kim YA. Characteristics of isokinetic ankle joint muscular function by short distance speed skater's performance levels. J Coach Dev. 2006. 8:263–72.
Go to : 
 | Fig. 3.The comparison of peak torque dorsiflexor and plantar flexor of ankle joint in each sports. (A) The values of peak torque dorsiflexor and plantar flexor of the right side ankle joint. (B) The values of peak torque dorsiflexor and plantar flexor of the left side ankle joint. |
 | Fig. 4.The comparison of peak torque % body weight (PT%BW) dorsiflexor and plantar flexor of ankle joint in each sports. (A) The values of PT%BW (%) dorsiflexor and plantar flexor of the right side ankle joint. (B) The values of PT%BW (%) dorsiflexor and plantar flexor of the left side ankle joint. |
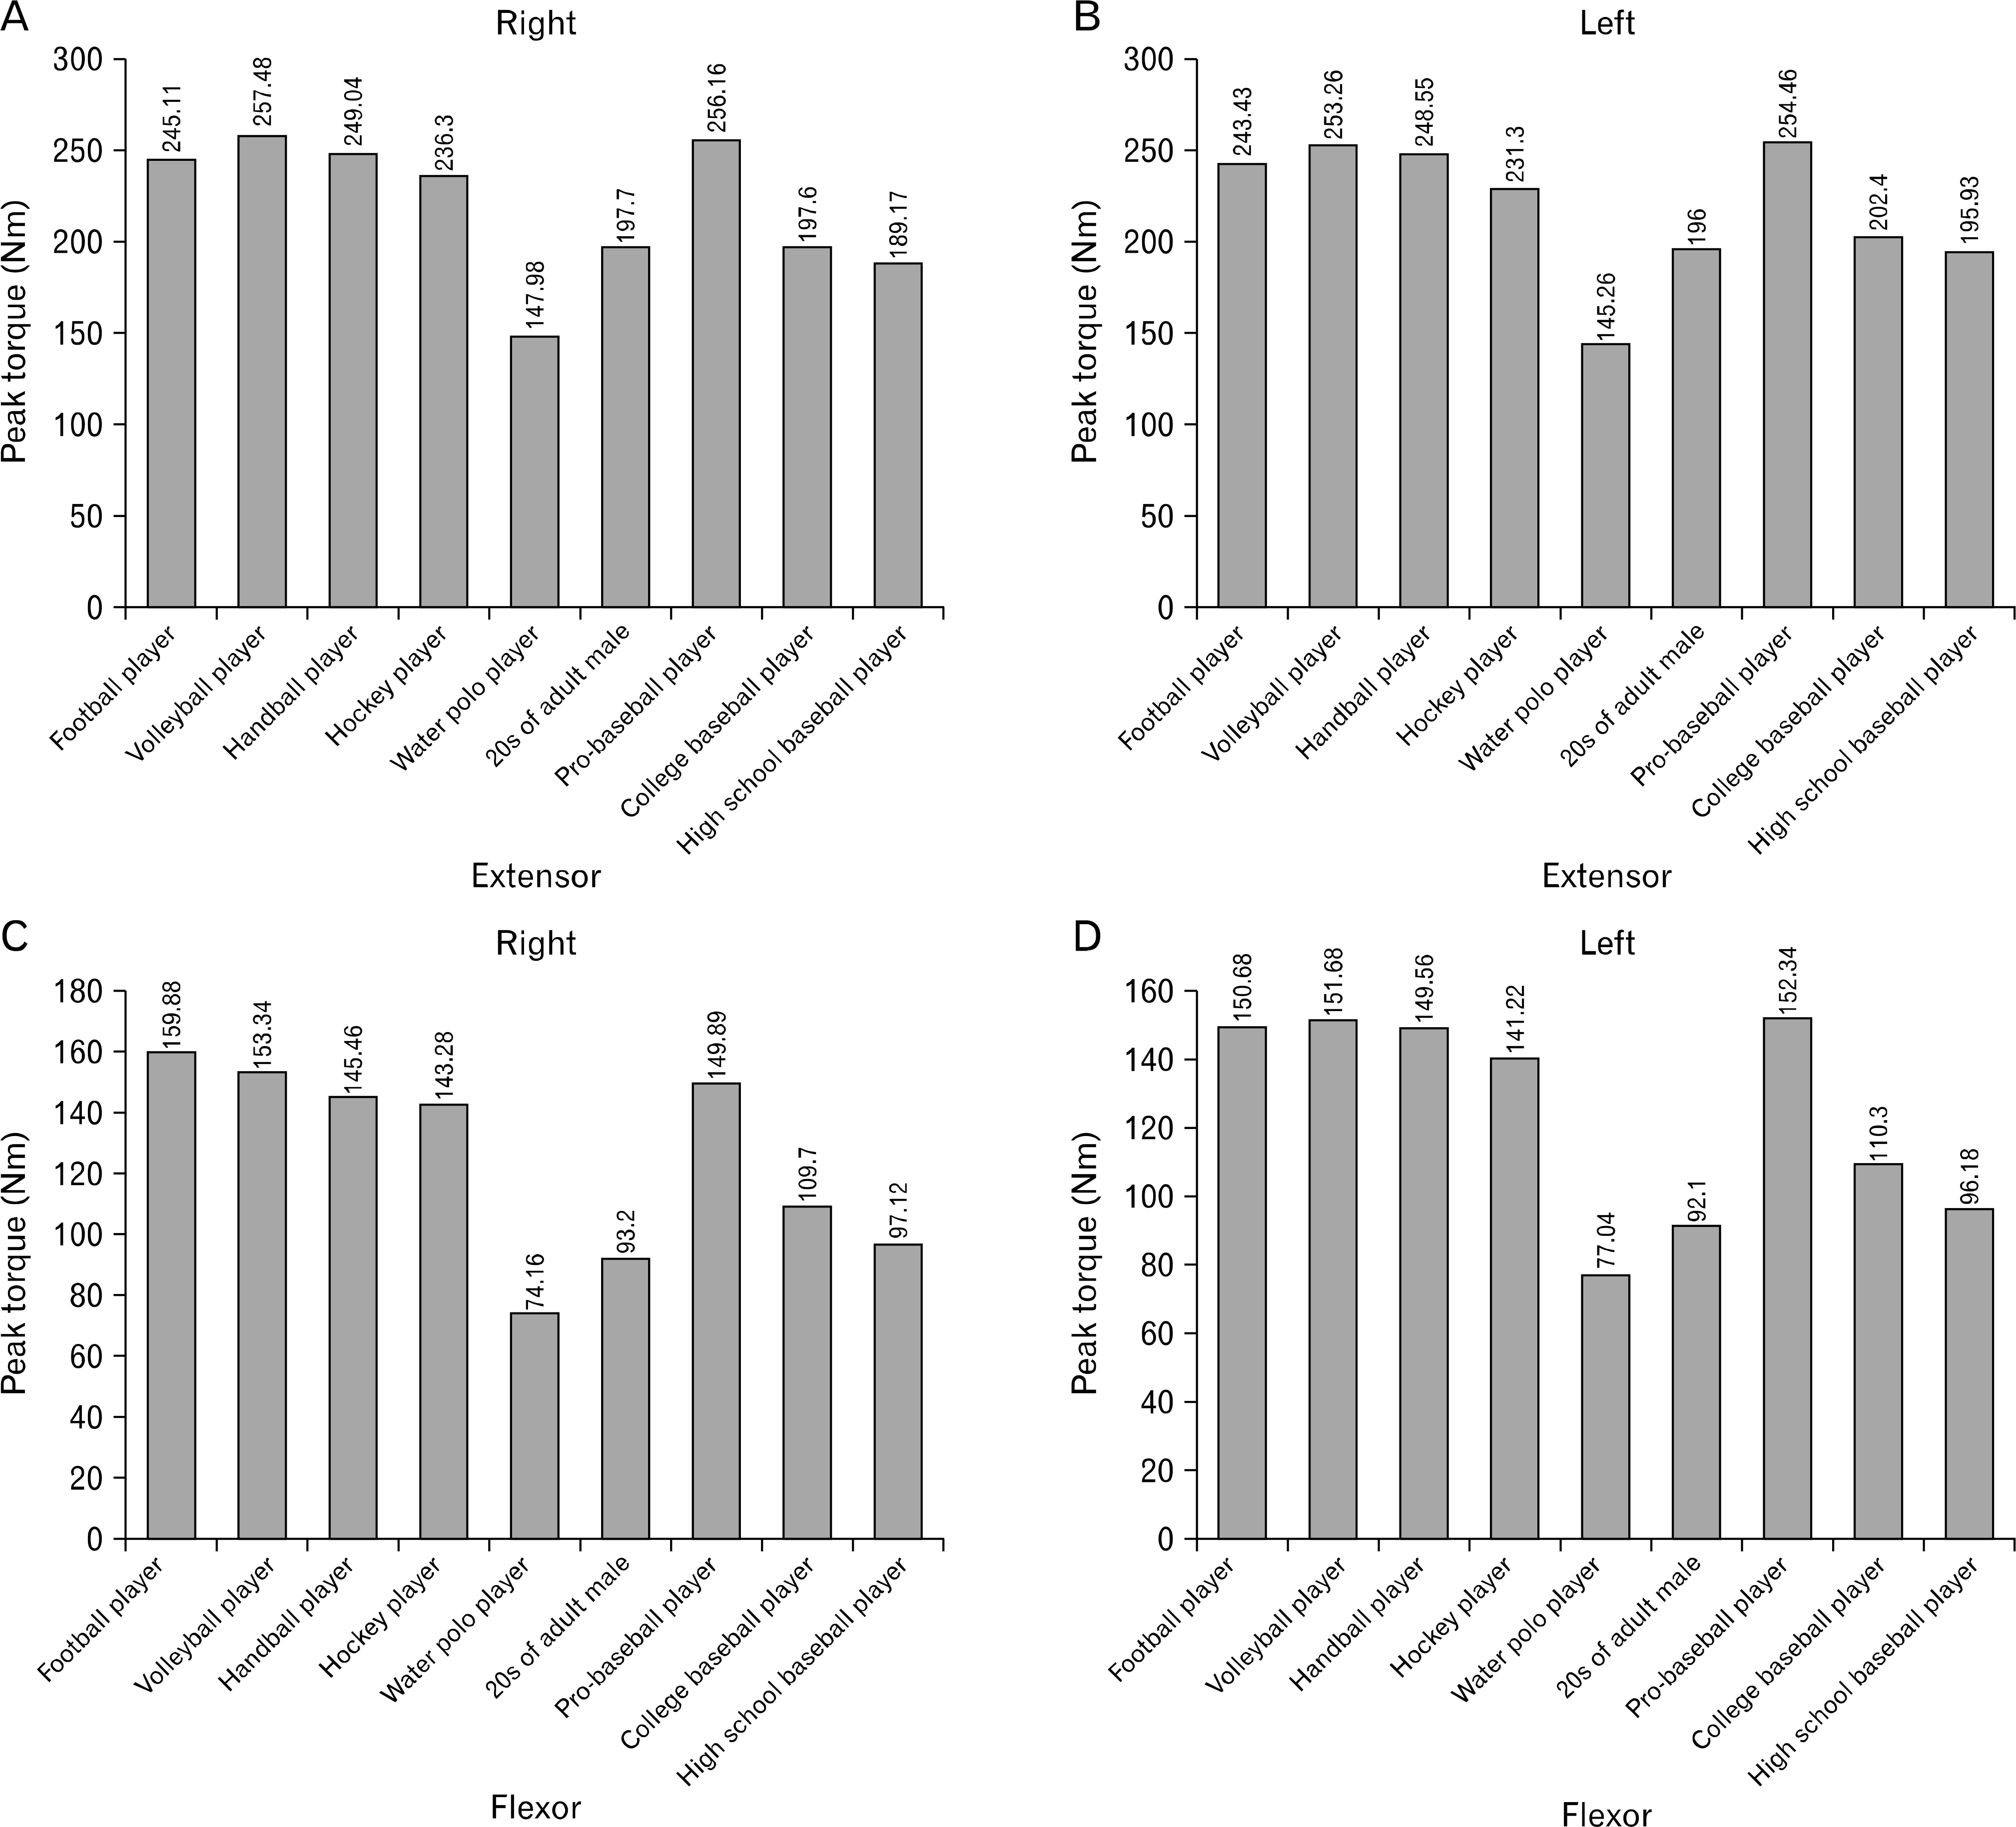
 | Fig. 5.The comparison of peak torque extensor and flexor of knee joint in each sports. (A) The values of peak torque extensor of the right side knee joint. (B) The values of peak torque extensor of the left side knee joint. (C) The values peak torque flexor of the right side knee joint. (D) The values peak torque flexor of the left side knee joint. |
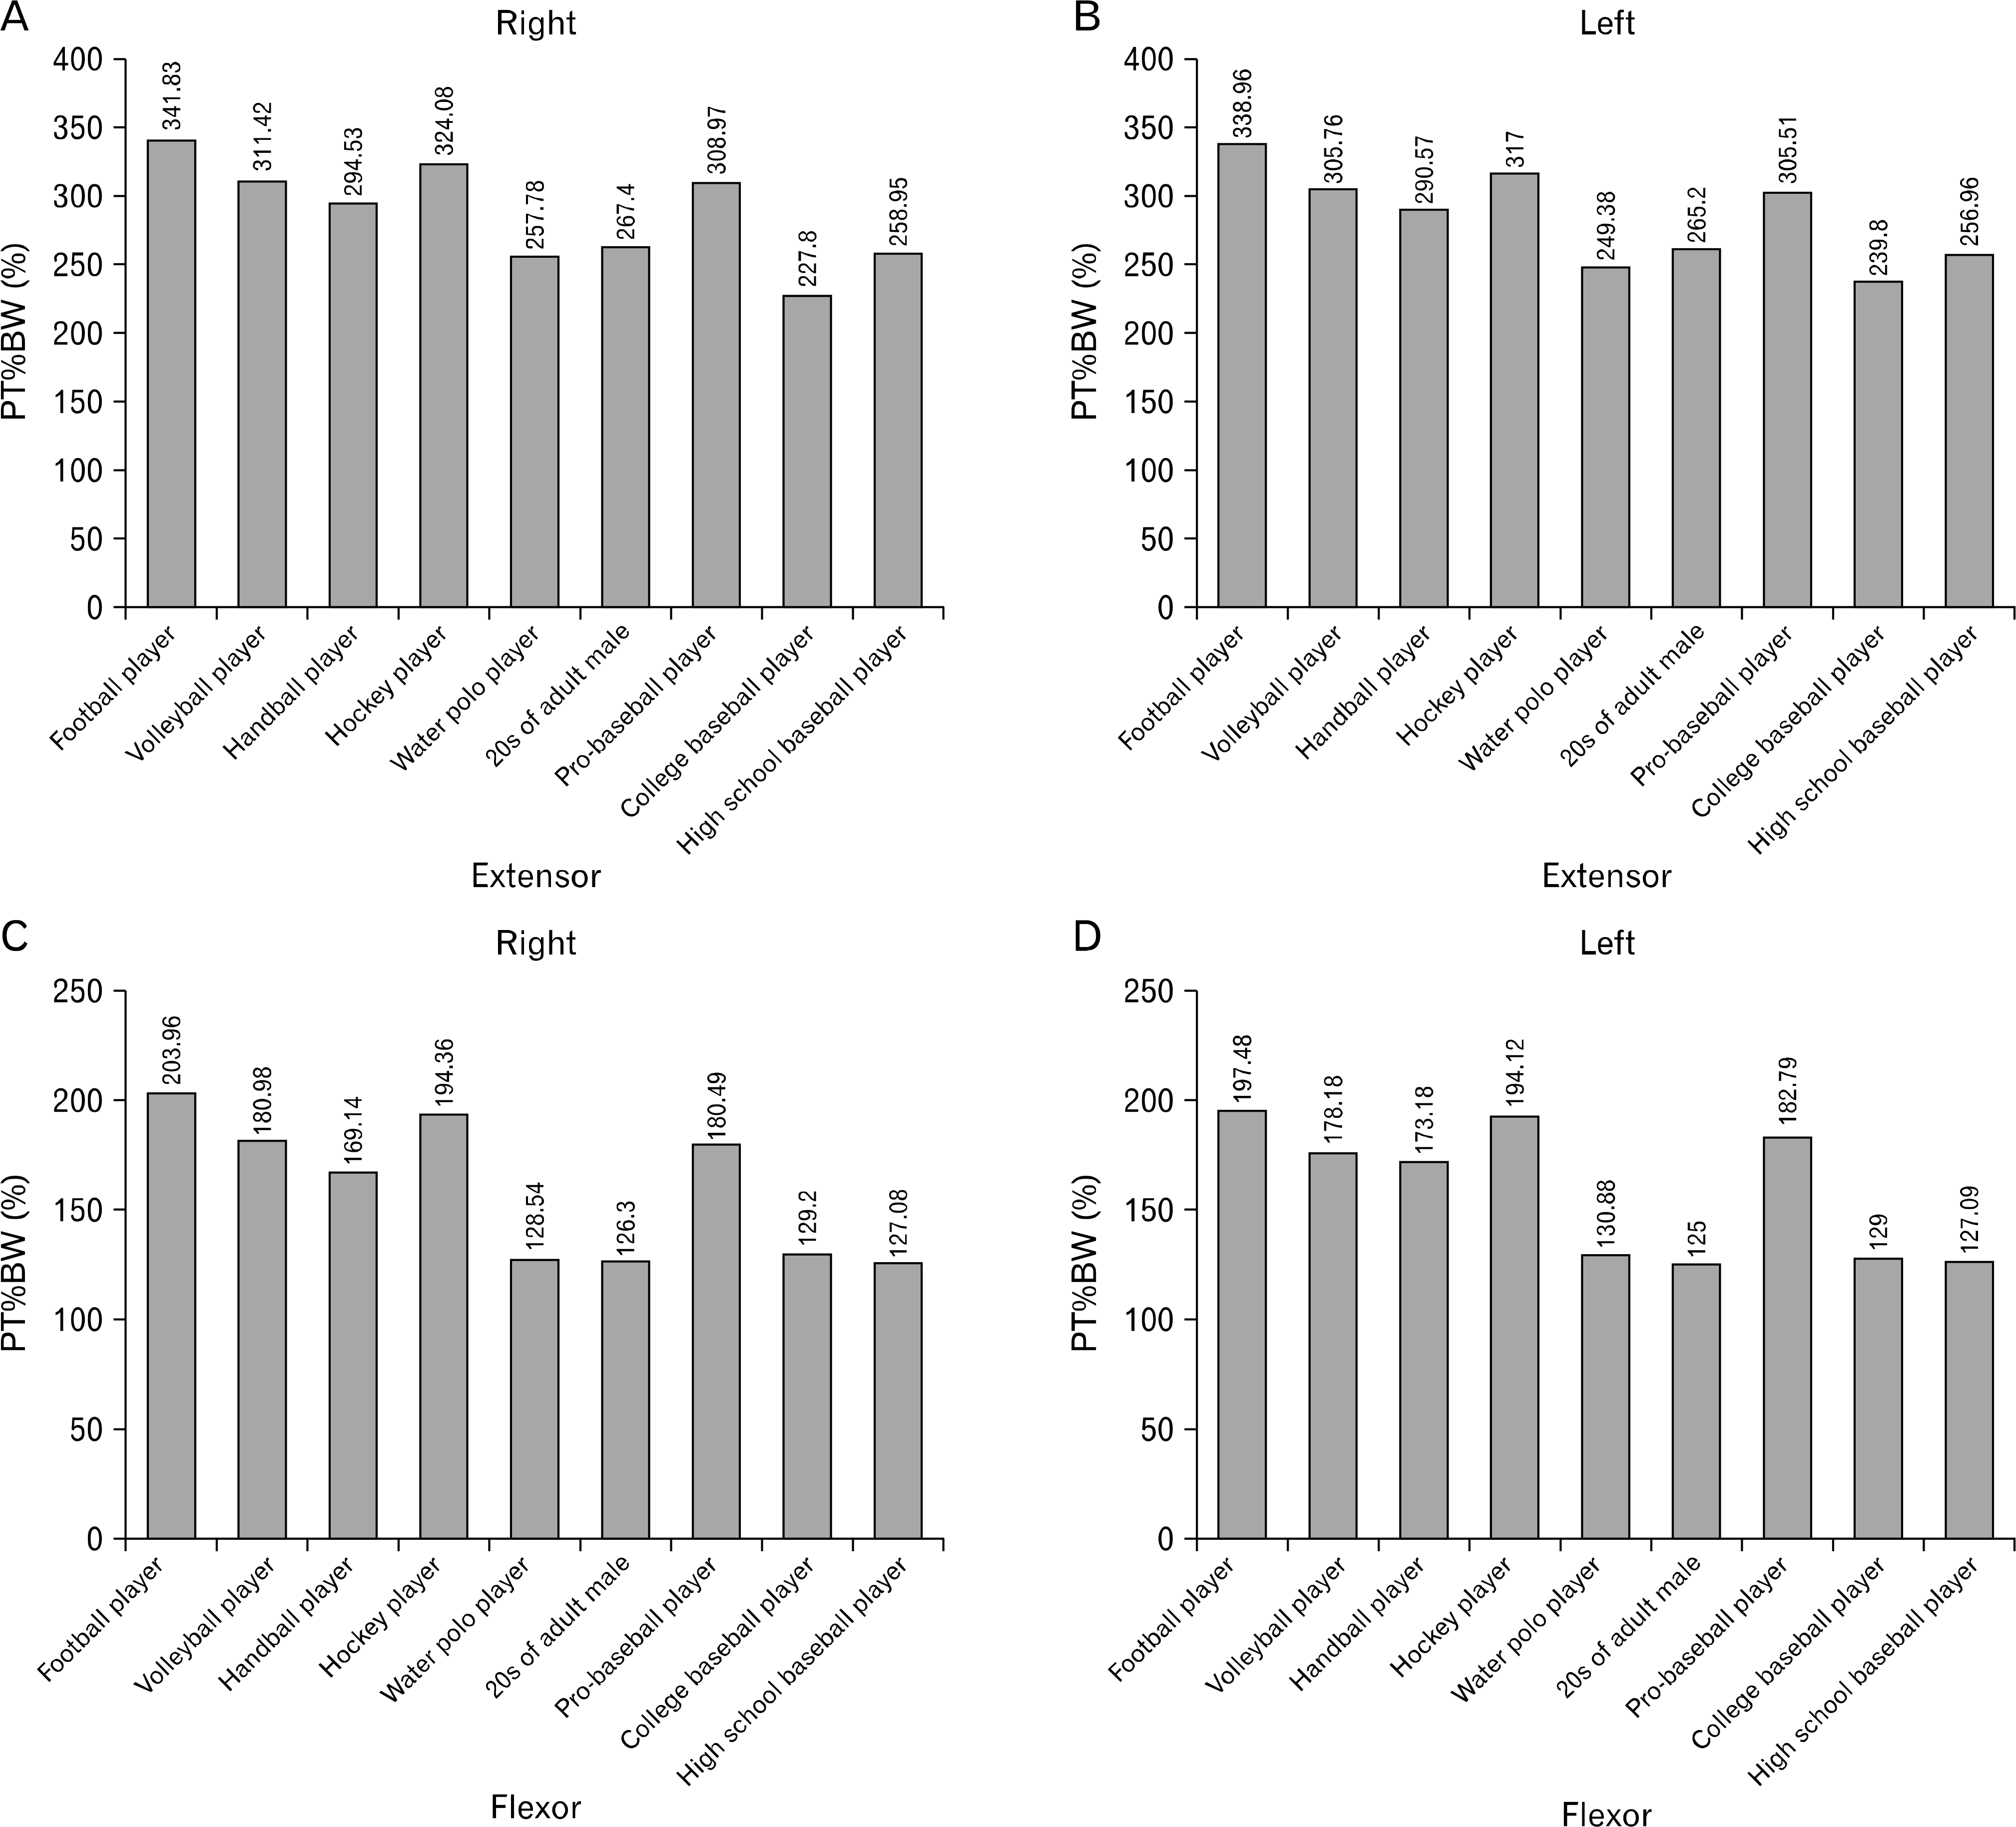
 | Fig. 6.The comparison of peak torque % body weight (PT%BW) extensor and flexor of knee joint in each sports. (A) The values of PT%BW (%) extensor of the right side knee joint. (B) The values of PT%BW (%) extensor of the left side knee joint. (C) The values PT%BW (%) flexor of the right side knee joint. (D) The values peak torque % body weight flexor of the left side knee joint. |
Table 1.
Characteristics of subjects
| Number | Height (cm) | Weight (kg) | Age (yr) | Career (yr) | Body mass index (kg/m2) | %Body fat (%) |
|---|---|---|---|---|---|---|
| 201 | 176.20±5.61 | 76.58.±10.98 | 17.66±0.70 | 6.68±1.57 | 36.34±4.99 | 15.92±5.6 |
Table 3.
The values of peak torque & peak torque % body weight ankle dorsiflexor and plantar flexor at 30o/sec speed
Table 2.
Norm-referenced criterion value using 5-point scale of cajori
| Scale | 5 | 4 | 3 | 2 | 1 |
|---|---|---|---|---|---|
| Percentage (%) | 6.06 | 24.17 | 38.30 | 24.17 | 6.06 |
| Stage | Very low | Low | Moderate | High | Very high |
Table 4.
Norm-referenced criterion values of PT & peak PT%BW ankle dorsiflexor and plantar flexor at 30o/sec speed
Table 5.
The values of peak torque & peak torque % body weight knee flexor and extensor at 60o/sec speed
| Muscle group | Peak torque (nm) | Peak torque % body weight (%) |
|---|---|---|
| Flexor | ||
| Righ | 97.12±23.08 | 127.08±26.44 |
| Left | 96.18±23.92 | 127.09±30.69 |
| Extensor | ||
| Righ | 198.17±36.83 | 258.95±44.55 |
| Left | 195.93±41.71 | 256.96±49.21 |
Table 6.
Norm-referenced criterion values of PT and PT%BW knee flexor and extensor at 60o/sec speed


 PDF
PDF ePub
ePub Citation
 Print
Print


 XML Download