

 PDF
PDF ePub
ePub Citation
 Print
Print


Abstract
Calculating the estimated resting metabolic rate (RMR) in severely obese patients is useful, but there is controversy concerning the effectiveness of available predictive equations using body weight. This study compared the accuracy of four commonly used RMR predictive equations to measured RMR. We evaluated the efficacy of RMR equations against indirect calorimetry in forth female obese subjects. The subjects had their RMR measured by indirect calorimetry and compared to the most commonly used prediction equations (Harris-Benedict, Owen, and Mifflin-St Jeor, World Health Organization/Food and Agriculture Organization/United Nations University [WHO/FAU/UNU]). The results shows that Owen and Mifflin-St Jeor equations significantly under-estimated to our measured RMR. However, the WHO/FAO/UNU Equation was the most accurately predictive RMR values (1,543.6±110.3 vs. 1,484.3±218.3) compared to measured RMR. As based on data, we suggest that WHO/FAO/UNU equation and Harris-Benedicts equation would be most reasonable and useful for Korean obese women.
REFERENCES
1.Bernstein RS., Thornton JC., Yang MU, et al. Prediction of the resting metabolic rate in obese patients. Am J Clin Nutr. 1983. 37:595–602.

2.Speakman JR., Selman C. Physical activity and resting metabolic rate. Proc Nutr Soc. 2003. 62:621–34.
3.Hasson RE., Howe CA., Jones BL., Freedson PS. Accuracy of four resting metabolic rate prediction equations: effects of sex, body mass index, age, and race/ethnicity. J Sci Med Sport. 2011. 14:344–51.
4.Compher C., Frankenfield D., Keim N., Roth-Yousey L., Evidence Analysis Working G. Best practice methods to apply to measurement of resting metabolic rate in adults: a systematic review. J Am Diet Assoc. 2006. 106:881–903.
5.Harris JA., Benedict FG. A biometric study of basal metabolism in man. Washington: Carnegie institution of Washington;1919.
6.Energy and protein requirements: report of a joint FAO/WHO/UNU Expert Consultation. World Health Organ Tech Rep Ser. 1985. 724:1–206.
7.Owen OE. Resting metabolic requirements of men and women. Mayo Clin Proc. 1988. 63:503–10.
8.Mifflin MD., St Jeor ST., Hill LA., Scott BJ., Daugherty SA., Koh YO. A new predictive equation for resting energy expenditure in healthy individuals. Am J Clin Nutr. 1990. 51:241–7.
9.Weijs PJ., Vansant GA. Validity of predictive equations for resting energy expenditure in Belgian normal weight to morbid obese women. Clin Nutr. 2010. 29:347–51.
10.Weijs PJ. Validity of predictive equations for resting energy expenditure in US and Dutch overweight and obese class I and II adults aged 18-65 y. Am J Clin Nutr. 2008. 88:959–70.
11.Frankenfield DC., Rowe WA., Smith JS., Cooney RN. Validation of several established equations for resting metabolic rate in obese and nonobese people. J Am Diet Assoc. 2003. 103:1152–9.
12.Ravussin E., Lillioja S., Knowler WC, et al. Reduced rate of energy expenditure as a risk factor for body-weight gain. N Engl J Med. 1988. 318:467–72.
13.Frankenfield D., Roth-Yousey L., Compher C. Comparison of predictive equations for resting metabolic rate in healthy nonobese and obese adults: a systematic review. J Am Diet Assoc. 2005. 105:775–89.
14.Lazzer S., Agosti F., Silvestri P., Derumeaux-Burel H., Sartorio A. Prediction of resting energy expenditure in severely obese Italian women. J Endocrinol Invest. 2007. 30:20–7.
15.Chang UJ., Lee KR. Correlation between measured resting energy expenditure and predicted basal energy expenditure in female college students. J Korean Soc Food Sci Nutr. 2005. 34:196–201.
Fig. 2.
Adjusted mean differences between the measured and predicted RMR. p<0.05. RMR: resting metabolic rate, MRMR: measured resting metabolic rate, WHO/FAU/UNU: World Health Organization/Food and Agriculture Organization/ United Nations University.
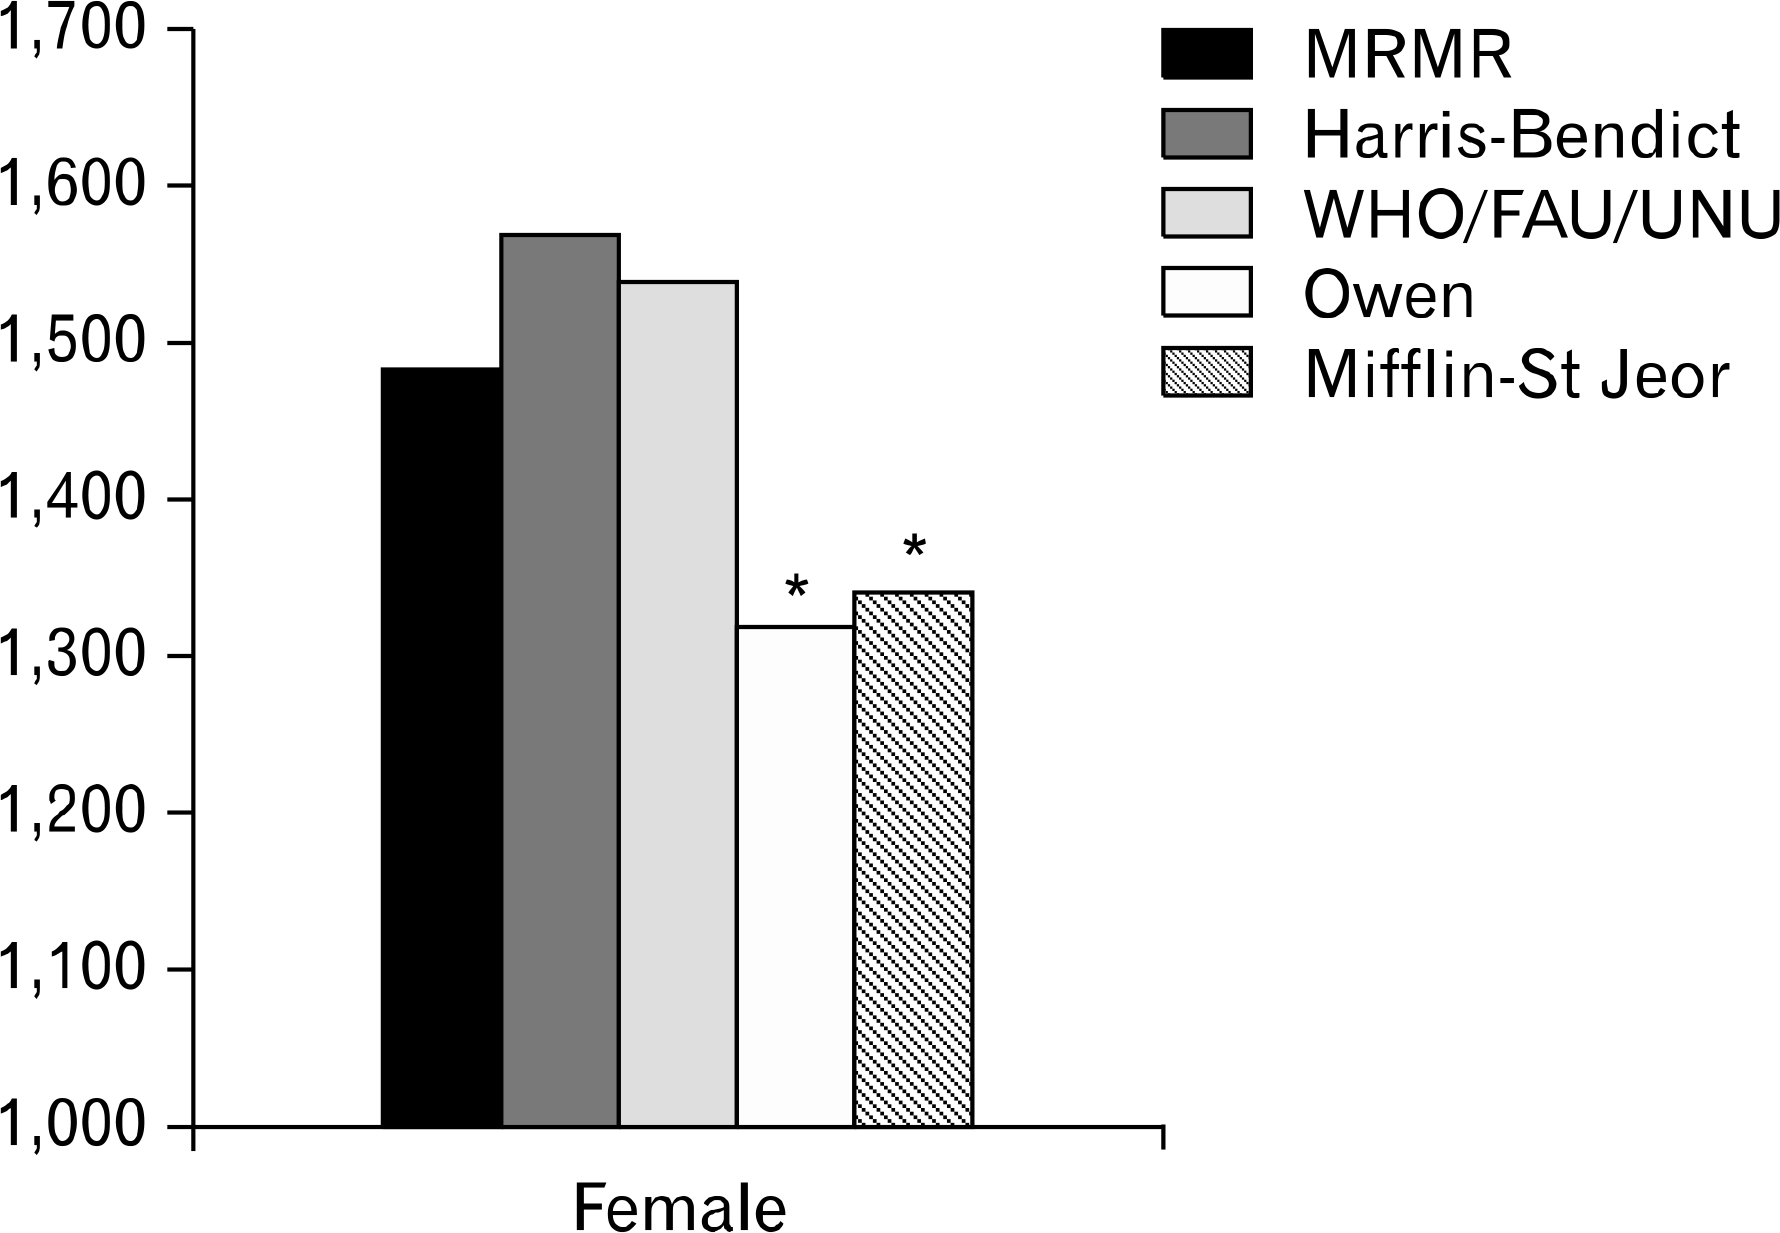
Table 1.
Characteristics of study subjects
| N | Age (y) | Height (cm) | Weight (kg) | BMI (kg/m2) | %BF (%) | |
|---|---|---|---|---|---|---|
| Subject | 40 | 45.3±8.0 | 159.3±3.0 | 74.2±12.4 | 29.5±3.2 | 36.3±4.2 |
Table 2.
Four resting metabolic rate prediction equations
Table 3.
Comparison of resting metabolic rate and predicted resting metabolic rate
| No. | Measured RMR (kcal/d) | Harris-Benedict | WHO/FAO/UNU | Owen | Mifflin-ST Jeor | |
|---|---|---|---|---|---|---|
| Subject | 40 | 1,484.3±218.3 | 1,570.6±148.0 | 1,543.6±110.3 | 1,320.1±106.1 | 1,343.8±134.5⋆ |
| PRMR-MRMR | 86.3±72.3 | 61.3±44.7 | −164.1±62.8⋆ | −140.5±68.8⋆ | ||
| c rate, WHO/FAO/ R: predicted restin | UNU: World Health g metabolic rate, M | h Organization/Food MRMR: measured re | d and Agriculture sting metabolic rat | Organization/United e. |
 XML Download