Abstract
References
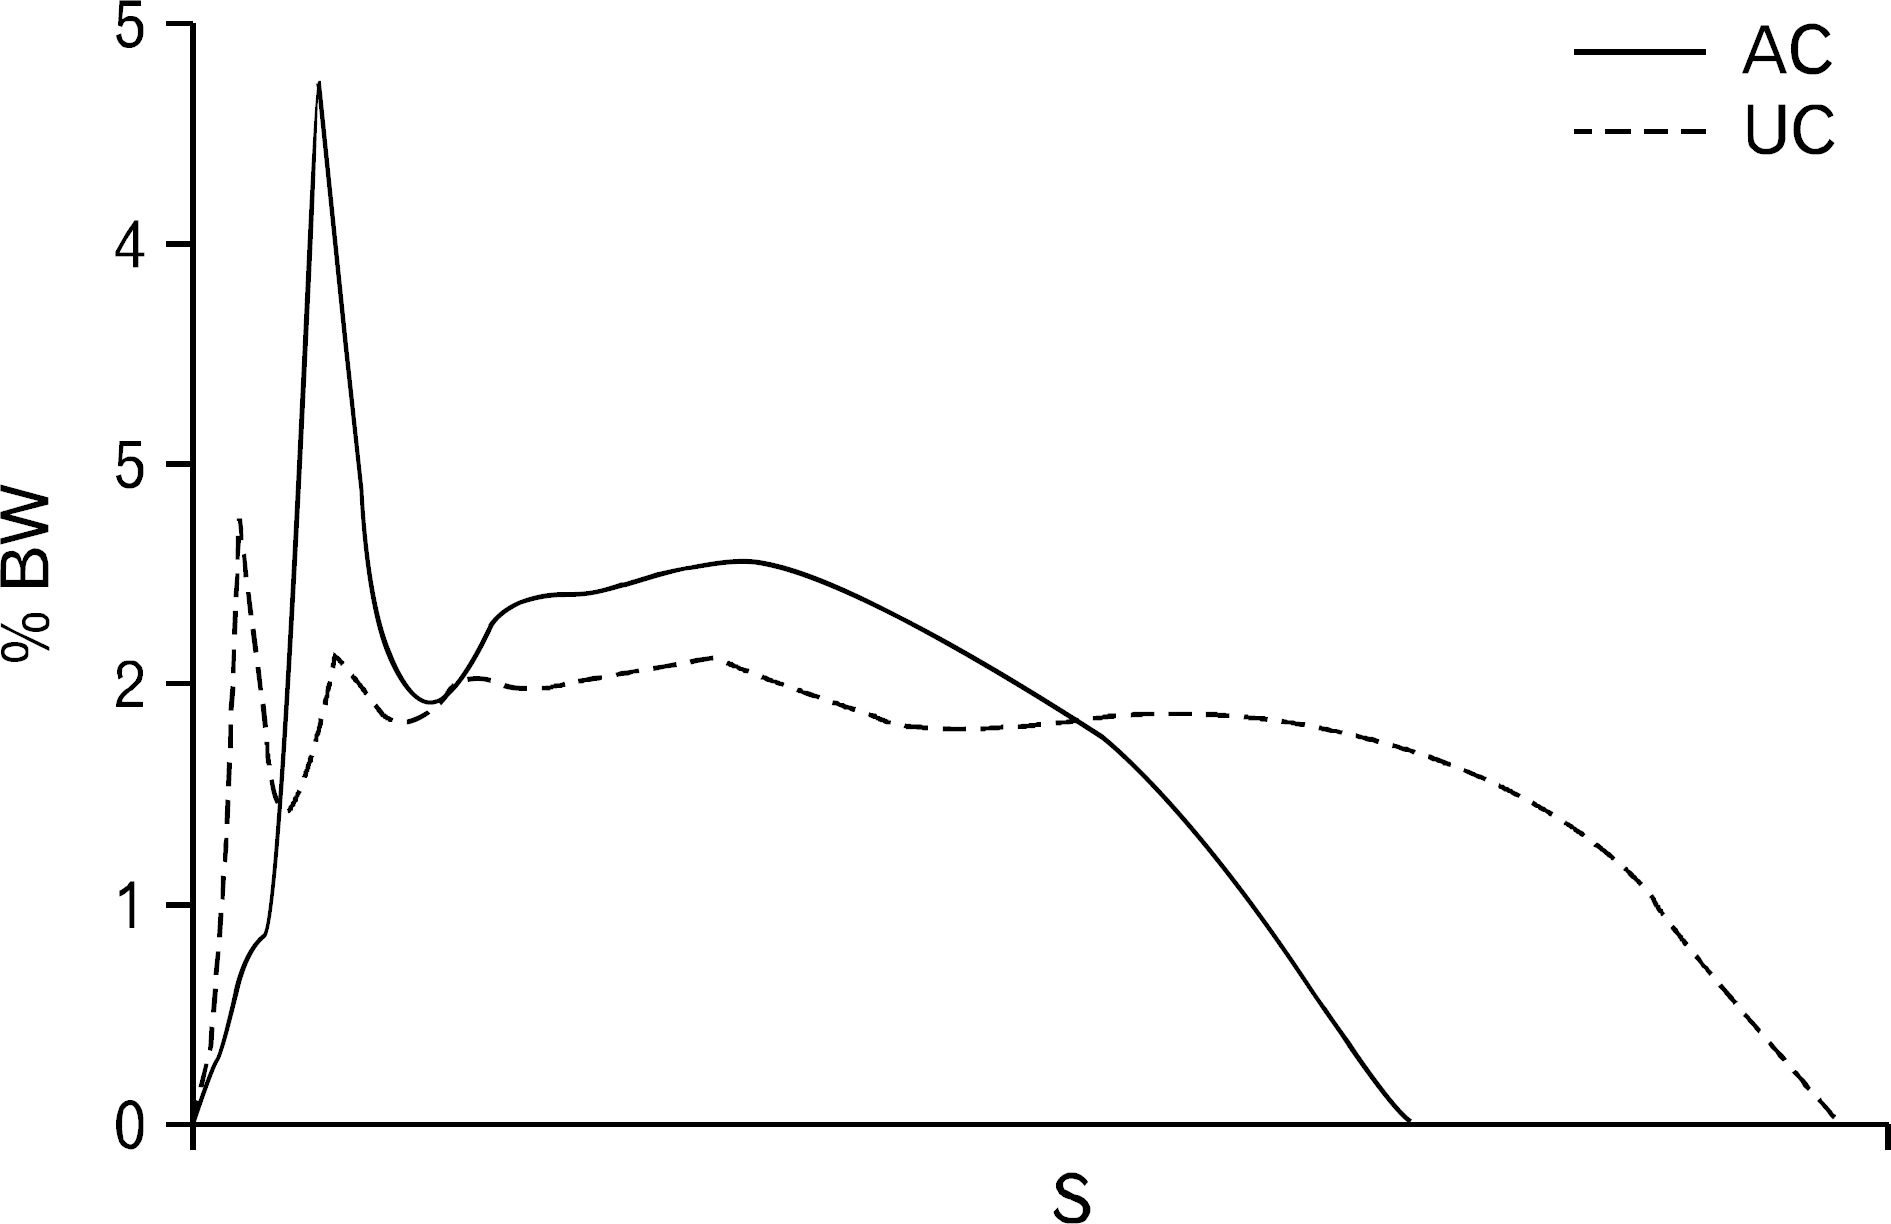
Fig. 2.

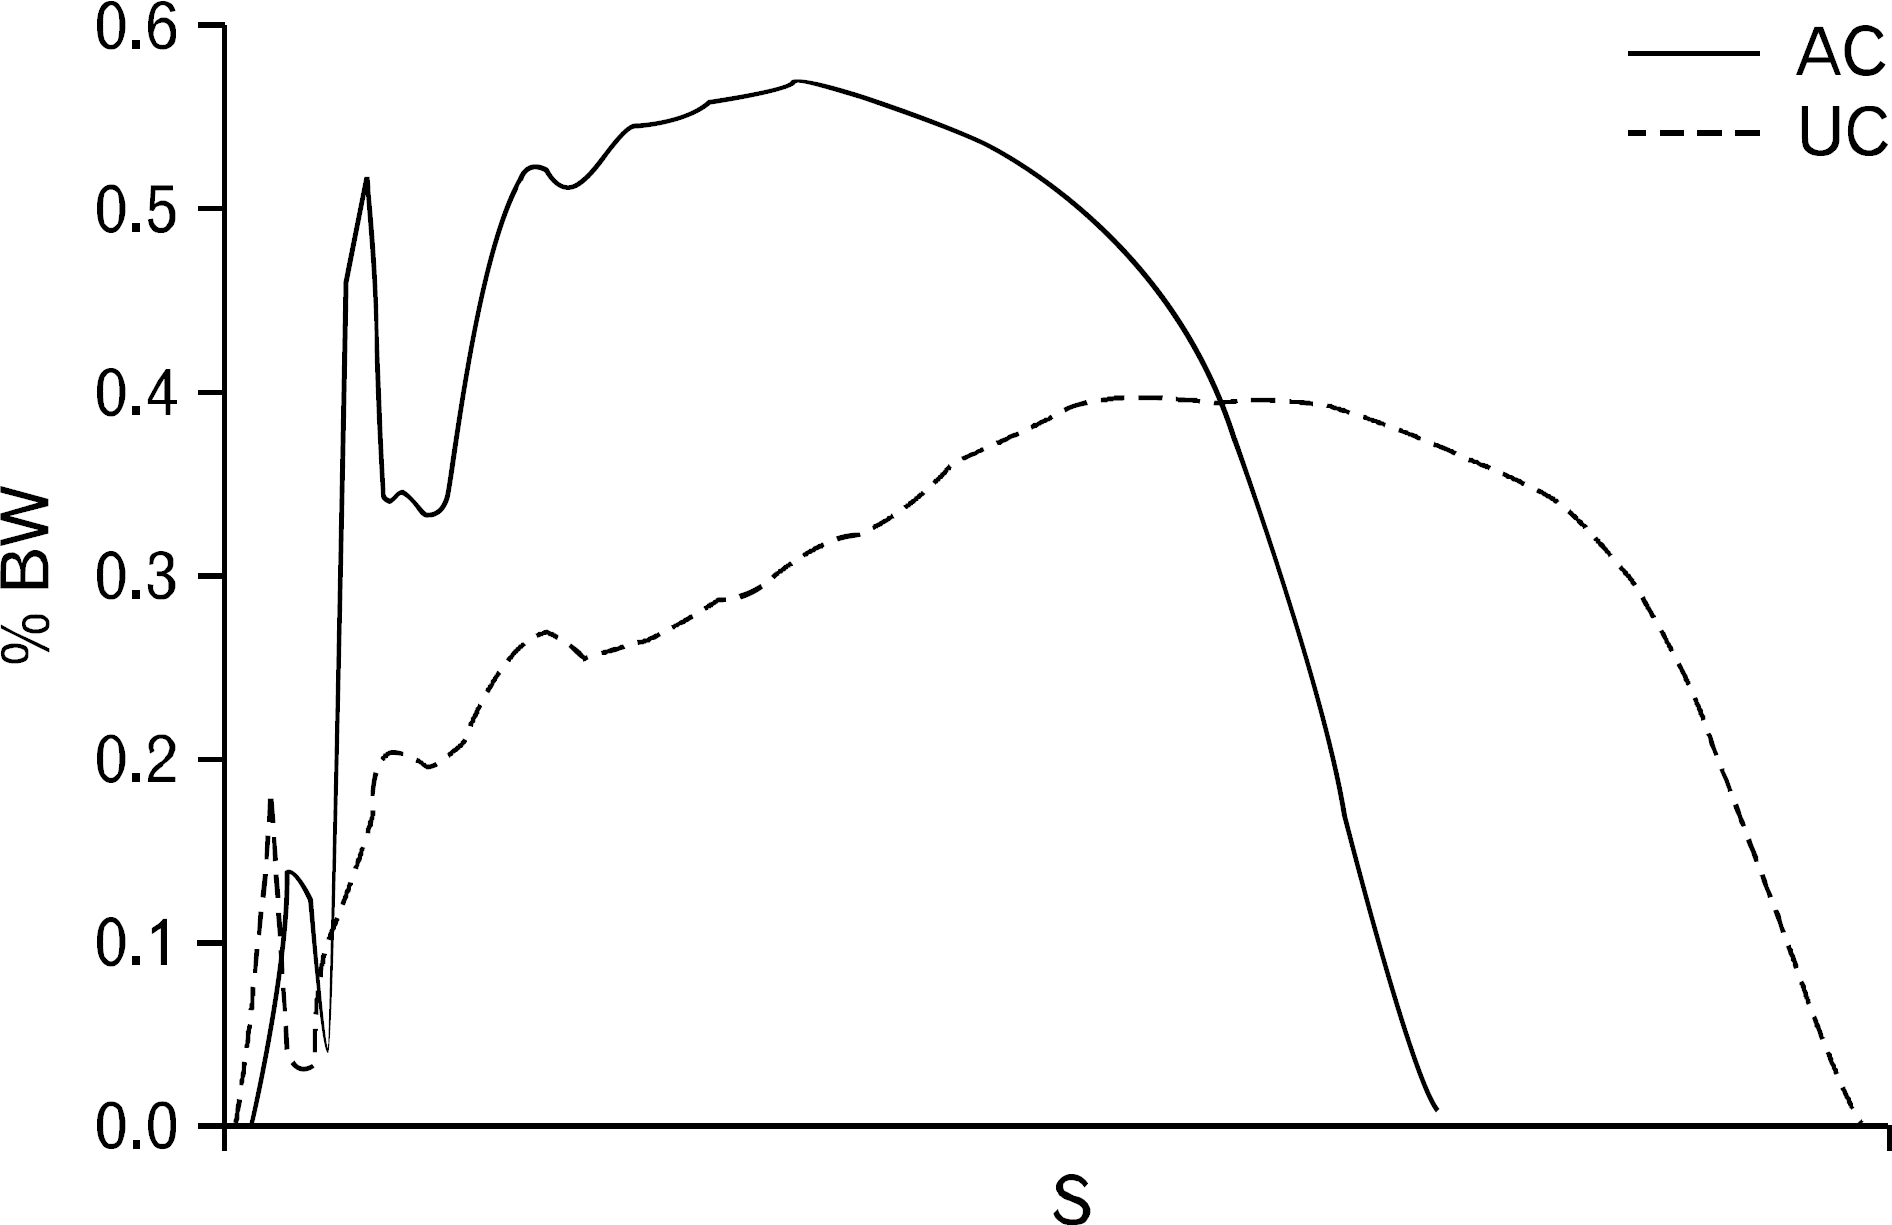
Fig. 3.

Table 1.
| Mean (SD) angles of hip joint (o) | p-value | |||||||
|---|---|---|---|---|---|---|---|---|
| Pre-fatigue | Post-fatigue | F | A | F∗A | ||||
| AC | UC | AC | UC | |||||
| Flx (+)/Ext (−) | IC | 48.36 | 50.42 | 46.68 | 46.76 | ∗0.030 | 0.201 | 0.273 |
| (7.80) | (7.81) | (8.37) | (6.92) | |||||
| Max | 54.76 | 58.39 | 54.55 | 56.37 | 0.205 | ∗0.007 | 0.382 | |
| (8.63) | (9.92) | (11.69) | (8.27) | |||||
| TO | –6.30 | –7.19 | –6.35 | –7.18 | 0.561 | 0.989 | 0.966 | |
| (7.81) | (8.09) | (7.78) | (6.88) | |||||
| Add (+)/Abd (−) | IC | –16.57 | –18.03 | –16.05 | –17.35 | 0.588 | 0.117 | 0.917 |
| (4.74) | (4.97) | (8.09) | (5.72) | |||||
| Max | –6.36 | –7.09 | –5.64 | –6.79 | 0.625 | 0.342 | 0.733 | |
| (4.27) | (6.21) | (5.96) | (6.75) | |||||
| TO | –22.34 | –22.03 | –22.36 | –21.89 | 0.941 | 0.484 | 0.934 | |
| (3.51) | (3.59) | (4.71) | (4.26) | |||||
| Int-Rot (+)/ | IC | –1.53 | 2.26 | –4.05 | –1.59 | ∗0.028 | †0.006 | 0.513 |
| Ext-Rot (−) | (9.72) | (9.43) | (10.02) | (10.64) | ||||
| Max | 6.38 | 9.04 | 7.61 | 8.32 | 0.734 | 0.134 | 0.231 | |
| (9.12) | (8.85) | (9.76) | (9.88) | |||||
| TO | –14.96 | –15.63 | –14.59 | –14.46 | 0.381 | 0.740 | 0.729 | |
| (9.57) | (8.06) | (8.08) | (9.04) | |||||
Table 2.
| Mean (SD) angles of hip joint (o) | p-value | |||||||
|---|---|---|---|---|---|---|---|---|
| Pre-fatigue | Post-fatigue | F | A | F∗A | ||||
| AC | UC | AC | UC | |||||
| Flx (+)/Ext (−) | IC | 19.80 | 21.22 | 19.36 | 19.57 | 0.173 | 0.155 | 0.367 |
| (5.41) | (4.74) | (4.54) | (4.58) | |||||
| Max | 56.91 | 62.91 | 58.59 | 62.17 | 0.690 | †0.000 | 0.337 | |
| (7.68) | (6.19) | (4.30) | (6.76) | |||||
| TO | 5.04 | 5.01 | 6.91 | 5.40 | 0.440 | 0.444 | 0.386 | |
| (7.04) | (6.39) | (4.92) | (5.32) | |||||
| Add (+)/Abd (−) | IC | 4.67 | 3.93 | 3.47 | 2.34 | †0.008 | 0.142 | 0.677 |
| (4.74) | (4.94) | (4.18) | (4.16) | |||||
| Max | –7.33 | –9.31 | –7.29 | –9.29 | 0.956 | †0.004 | 0.986 | |
| (6.84) | (7.69) | (7.76) | (8.75) | |||||
| TO | –0.00 | –0.29 | –0.52 | –0.22 | 0.507 | 0.994 | 0.249 | |
| (3.02) | (3.24) | (3.06) | (3.58) | |||||
| Int-Rot (+)/ | IC | –9.09 | –10.05 | –9.77 | –10.01 | 0.689 | 0.381 | 0.582 |
| Ext-Rot (−) | (6.76) | (4.74) | (6.60) | (6.28) | ||||
| Max | 16.13 | 17.77 | 17.51 | 18.02 | ∗0.026 | ∗0.025 | 0.267 | |
| (5.10) | (5.78) | (5.58) | (5.09) | |||||
| TO | –7.77 | –6.46 | –6.57 | –7.70 | 0.381 | 0.740 | 0.729 | |
| (4.61) | (4.41) | (3.47) | (3.29) | |||||
Table 3.
| Mean (SD) angles of hip joint (o) | p-value | |||||||
|---|---|---|---|---|---|---|---|---|
| Pre-fatigue | Post-fatigue | F | A | F∗A | ||||
| AC | UC | AC | UC | |||||
| DF (+)/PF (−) | IC | –5.14 | –0.62 | –2.14 | –0.78 | 0.382 | 0.256 | 0.195 |
| (13.92) | (17.90) | (16.39) | (18.20) | |||||
| Max | 26.70 | 29.68 | 28.58 | 29.10 | 0.247 | ∗0.010 | 0.144 | |
| (4.08) | (5.17) | (4.74) | (4.71) | |||||
| TO | –28.89 | –29.75 | –29.69 | –30.04 | 0.565 | 0.440 | 0.728 | |
| (5.83) | (5.88) | (7.47) | (5.57) | |||||
| Sup (+)/Pro (−) | IC | 0.49 | 0.31 | –0.21 | –0.16 | †0.003 | 0.661 | 0.400 |
| (1.47) | (1.49) | (1.37) | (1.57) | |||||
| Max | 4.37 | 3.11 | 3.18 | 2.96 | 0.242 | 0.187 | 0.387 | |
| (3.96) | (1.85) | (2.18) | (1.64) | |||||
| TO | –1.86 | –2.27 | –1.84 | –2.38 | 0.754 | ∗0.025 | 0.591 | |
| (1.48) | (1.88) | (1.35) | (1.66) | |||||
| Int-Rot (+)/ | IC | –6.85 | –5.85 | –2.81 | –3.18 | ∗0.028 | †0.006 | 0.513 |
| Ext-Rot (−) | (9.15) | (9.58) | (9.25) | (9.61) | ||||
| Max | 11.10 | 13.06 | 9.84 | 14.47 | 0.952 | ∗0.046 | 0.183 | |
| (8.00) | (11.42) | (7.80) | (10.49) | |||||
| TO | 7.96 | 10.48 | 8.10 | 11.78 | 0.516 | ∗0.015 | 0.433 | |
| (6.19) | (8.72) | (6.39) | (7.93) | |||||
SD: standard deviation, AC: anticipated cutting, UC: un-anticipated cutting, F: significant difference within fatigue, A: significant difference within anticipate, F∗A: significant difference within fatigue∗anticipate, IC: initial contact, max: maximum, TO: toe off, DF: dorsi flexion, PF: plantar flexion, Sup: supination, Pro: pronation.∗p<0.05
Table 4.
| Mean (SD) moments of hip joint (Nm/kg) | p-value | |||||||
|---|---|---|---|---|---|---|---|---|
| Pre-fatigue | Post-fatigue | F | A | F∗A | ||||
| AC | UC | AC | UC | |||||
| Flx (+)/Ext (−) | IC | –0.71 | –1.05 | –0.59 | –0.75 | 0.240 | 0.311 | 0.532 |
| (0.74) | (0.82) | (0.72) | (0.79) | |||||
| Max | 6.26 | 5.91 | 5.72 | 5.71 | 0.063 | 0.512 | 0.186 | |
| (0.99) | (1.59) | (0.98) | (1.27) | |||||
| TO | –0.86 | –0.78 | –0.70 | –0.70 | 0.306 | 0.628 | 0.567 | |
| (0.62) | (0.35) | (0.37) | (0.33) | |||||
| Add (+)/Abd (−) | IC | 0.47 | 0.33 | 0.39 | 0.12 | 0.098 | 0.095 | 0.505 |
| (0.37) | (0.45) | (0.51) | (0.62) | |||||
| Max | 1.52 | 1.31 | 1.70 | 1.25 | 0.440 | †0.001 | ∗0.015 | |
| (0.38) | (0.46) | (0.61) | (0.53) | |||||
| TO | –0.22 | –0.28 | –0.27 | –0.27 | 0.690 | 0.566 | 0.662 | |
| (0.36) | (0.34) | (0.27) | (0.33) | |||||
| Int-Rot (+)/ | IC | 0.00 | 0.01 | 0.01 | 0.02 | 0.365 | 0.484 | 0.887 |
| Ext-Rot (−) | (0.03) | (0.04) | (0.05) | (0.07) | ||||
| Max | 0.41 | 0.48 | 0.38 | 0.43 | 0.442 | 0.229 | 0.769 | |
| (0.25) | (0.30) | (0.21) | (0.24) | |||||
| TO | 0.01 | 0.01 | 0.00 | 0.00 | 0.805 | 0.882 | 0.920 | |
| (0.05) | (0.06) | (0.06) | (0.05) | |||||
Table 5.
| Mean (SD) moments of knee joint (Nm/kg) | p-value | |||||||
|---|---|---|---|---|---|---|---|---|
| Pre-fatigue | Post-fatigue | F | A | F∗A | ||||
| AC | UC | AC | UC | |||||
| Flx (+)/Ext (−) | IC | –0.13 | –0.07 | –0.18 | –0.23 | 0.075 | 0.880 | 0.423 |
| (0.21) | (0.21) | (0.21) | (0.30) | |||||
| Max | 2.59 | 2.82 | 2.72 | 2.82 | 0.228 | ∗0.032 | 0.228 | |
| (0.58) | (0.57) | (0.61) | (0.56) | |||||
| TO | –0.23 | –0.23 | –0.18 | –0.24 | 0.689 | 0.193 | 0.610 | |
| (0.16) | (0.16) | (0.20) | (0.14) | |||||
| Add (+)/Abd (−) | IC | 0.10 | 0.01 | 0.05 | –0.05 | 0.122 | ∗0.033 | 0.771 |
| (0.08) | (0.11) | (0.16) | (0.20) | |||||
| Max | 1.74 | 1.31 | 1.73 | 1.38 | 0.698 | †0.000 | 0.624 | |
| (0.33) | (0.69) | (0.46) | (0.41) | |||||
| TO | –0.10 | –0.10 | –0.14 | –0.11 | 0.478 | 0.538 | 0.567 | |
| (0.19) | (0.18) | (0.16) | (0.16) | |||||
| Int-Rot (+)/ | IC | 0.04 | 0.02 | 0.04 | 0.01 | 0.163 | †0.005 | 0.876 |
| Ext-Rot (−) | (0.04) | (0.05) | (0.03) | (0.04) | ||||
| Max | 0.44 | 0.33 | 0.39 | 0.32 | 0.235 | ∗0.010 | 0.475 | |
| (0.15) | (0.15) | (0.20) | (0.13) | |||||
| TO | –0.00 | –0.00 | –0.01 | –0.01 | 0.460 | 0.959 | 0.878 | |
| (0.06) | (0.07) | (0.07) | (0.05) | |||||
Table 6.
| Mean (SD) moments of ankle joint (Nm/kg) | p-value | |||||||
|---|---|---|---|---|---|---|---|---|
| Pre-fatigue | Post-fatigue | F | A | F∗A | ||||
| AC | UC | AC | UC | |||||
| DF (+)/PF (−) | IC | –0.03 | –0.06 | –0.01 | –0.02 | 0.311 | 0.538 | 0.771 |
| (0.10) | (0.06) | (0.12) | (0.11) | |||||
| Max | 3.08 | 2.77 | 3.15 | 2.85 | 0.096 | †0.001 | 0.948 | |
| (0.44) | (0.34) | (0.54) | (0.35) | |||||
| TO | 0.01 | –0.04 | –0.05 | –0.05 | ∗0.028 | 0.072 | 0.139 | |
| (0.08) | (0.05) | (0.04) | (0.04) | |||||
| Sup (+)/Pro (−) | IC | 0.01 | 0.01 | 0.01 | 0.00 | 0.231 | 0.585 | 0.415 |
| (0.02) | (0.03) | (0.03) | (0.03) | † | ||||
| Max | 0.45 | 0.35 | 0.47 | 0.34 | 0.786 | †0.000 | 0.377 | |
| (0.15) | (0.15) | (0.18) | (0.16) | |||||
| TO | 0.00 | 0.00 | –0.00 | 0.01 | 0.837 | 0.573 | 0.268 | |
| (0.03) | (0.02) | (0.02) | (0.01) | |||||
| Int-Rot (+)/ | IC | 0.05 | 0.02 | 0.03 | 0.00 | 0.077 | †0.005 | 0.871 |
| Ext-Rot (−) | (0.05) | (0.05) | (0.04) | (0.04) | ||||
| Max | 0.62 | 0.57 | 0.63 | 0.54 | 0.684 | ∗0.014 | 0.362 | |
| (0.17) | (0.16) | (0.26) | (0.18) | |||||
| TO | –0.00 | –0.01 | –0.02 | –0.02 | 0.373 | 0.745 | 0.646 | |
| (0.07) | (0.06) | (0.07) | (0.06) | |||||
SD: standard deviation, AC: anticipated cutting, UC: un-anticipated cutting, F: significant difference within fatigue, A: significant difference within anticipate, F∗A: significant difference within fatigue∗anticipate, IC: initial contact, max: maximum, TO: toe off, DF: dorsi flexion, PF: plantar flexion, Sup: supination, Pro: pronation.∗p<0.05
Table 7.
| GRF (%body weight) | p-value | ||||||
|---|---|---|---|---|---|---|---|
| Pre-fatigue | Post-fatigue | F | A | F∗A | |||
| AC | UC | AC | UC | ||||
| Fx | 0.73 (0.14) | 0.65 (0.16) | 0.76 (0.15) | 0.65 (0.16) | 0.628 | ∗0.011 | 0.124 |
| Fy | 0.92 (0.21) | 1.08 (0.39) | 1.06 (0.46) | 1.10 (0.33) | 0.248 | 0.106 | 0.370 |
| Fz1 | 4.28 (0.64) | 4.27 (0.92) | 4.39 (0.72) | 4.30 (0.85) | 0.572 | 0.683 | 0.584 |
| Fz2 | 2.73 (0.22) | 2.57 (0.29) | 2.72 (0.33) | 2.55 (0.21) | 0.748 | †0.008 | 0.900 |
GRF: ground reaction force, SD: standard deviation, AC: anticipated cutting, UC: un-anticipated cutting, F: significant difference within fatigue, A: significant difference within anticipate, F∗A: significant difference within fatigue∗anticipate, Fx: mediolateral ground reaction force, Fy: anterioposterior ground reaction force, Fz1: first peak of vertical ground reaction force, Fz2: second peak of vertical ground reaction force.∗p<0.05,
Table 8.
| Ground contact time (s) | p-value | ||||||
|---|---|---|---|---|---|---|---|
| Pre-fatigue | Post-fatigue | F | A | F∗A | |||
| AC | UC | AC | UC | ||||
| Flx | 0.12 (0.02) | 0.15 (0.04) | 0.13 (0.03) | 0.14 (0.02) | 0.304 | ∗0.012 | 0.118 |
| Ext | 0.15 (0.02) | 0.17 (0.03) | 0.15 (0.02) | 0.17 (0.03) | 0.458 | †0.002 | 0.618 |


 PDF
PDF ePub
ePub Citation
 Print
Print


 XML Download