

 PDF
PDF ePub
ePub Citation
 Print
Print


INTRODUCTION
Zirconia-based dental restorations are fabricated using CAD/CAM systems combined with high-temperature sintering. Zirconia ceramics can be processed by either milling a pre-sintered porous blank and subsequent sintering or milling a fully sintered block.1 For the soft milling of presintered blanks, specific sintering conditions such as sintering temperature and time could influence the mechanical and optical properties of zirconia restorations.23 The hard machining of a fully sintered block requires specifically designed strong milling systems, and the process can therefore induce residual stresses promoting low temperature degradation.4
Microwaves have been used in the zirconia processing for over twenty years. In a microwave oven, heat is applied internally as well as externally to the materials, providing rapid heating rates with less thermal stress.56 In addition, the thermal conductivity can be enhanced by using susceptors that transform electromagnetic energy into heat.7 It was reported that microwave sintering had several advantages over conventional sintering, such as reduced time and energy,78 improved densification processes with accelerated grain growth,9 more uniform surface quality with similar mechanical properties and density,781011 and smaller grain size121314 compared to the conventional method.
Pre-colored dental monolithic zirconia ceramics have recently been developed to promote color matching with high mechanical strength and toughness. Due to their improved translucency, pre-colored monolithic zirconia ceramics can be used in the anterior as well as the posterior regions. Various fabrication techniques have been investigated and homogenously-colored zirconia ceramics in different shades are available in the market nowadays.15
Most of the studies on the microwave sintering have focused on heat transfer mechanisms and evaluated the physical properties and microstructures. However, the optical properties of microwave-sintered zirconia ceramics have not been extensively studied. Therefore, the purpose of this in vitro study was to compare the optical properties of precolored dental monolithic zirconia ceramics of various thicknesses sintered in a microwave and a conventional furnace. In addition, the crystalline phase transformation and the surface topography of pre-shaded monolithic zirconia ceramics obtained by two different sintering methods were evaluated. The null hypotheses were that sintering methods would not affect the optical properties of pre-colored monolithic zirconia ceramics and that the effect of sintering methods on the optical properties of pre-colored monolithic zirconia ceramics would not be affected by the thickness.
MATERIALS AND METHODS
Square-shaped (22.0 mm × 22.0 mm) specimens of three different thicknesses (1.2 mm, 1.7 mm, and 2.3 mm, n = 18 per group) were prepared from a pre-shaded dental monolithic zirconia block (ZrO2, Y2O3 4 – 6%, HfO2 ≤ 5%, Al2O3 ≤ 1%, Other oxides; lot no. 14I19-03; Rainbow Shade A2, Genoss, Suwon, Korea). Each thickness group was further divided into two subgroups according to the sintering methods: conventional and microwave sintering (n = 9 per subgroup, Table 1). Final thicknesses of each group were then adjusted to 0.5 mm, 1.0 mm, and 1.5 mm by using a horizontal grinding machine (HRG-150, AM Technology, Asan, Korea) and the thicknesses were verified using a digital caliper (Digimatic micrometer, Mitutoyo, Tokyo, Japan) with a resolution of 0.01 mm. Before the measurements were performed, all samples were ultrasonically cleaned in isopropyl alcohol for 5 minutes.
Spectral reflectance data from 360 to 750 nm were obtained at 10-nm intervals against a white polytetrafluoroethylene (PTFE) background (GM29010330, X-Rite, Grand Rapids, MI, USA; CIE L* = 93.968, a* = -0.168, and b* = 2.476), a black glass ceramic tile (CM-A101B, Konica Minolta, Tokyo, Japan; CIE L* = 0.012, a* = 0.022, and b* = 0.00), and an A2 glass ceramic tile (IPS e.max Press MO, Ivoclar Vivadent AG, Schaan, Liechtenstein; CIE L* = 74.44, a* = −1.95, and b* = 11.462) with a spectrophotometer (Color iControl, X-Rite, Grand Rapids, MI, USA). Diffuse/8-degree geometry and specular component excluded (de:8°) condition were used for the reflectance measurements. A 6-mm diameter aperture and a 6-mm diameter measurement area were applied. CIELab color coordinates were calculated from the spectral power data relative to D65 with the 2-degree standard colorimetric observer. Five measurements for each specimen were recorded with a medium of distilled water (refractive index of 1.33). Color parameters of an A2 shade tab (classical A1-D4 shade guide, VITA Zahnfabrik, Bad Säckingen, Germany) were also measured and served as a control.
For the calculation of the color differences, averaged color values of each subgroup against an A2 background were used. CIEDE2000 color differences (ΔE00) between two different sintering methods at each thickness and between each subgroup and an A2 shade tab were determined by using the following formula:1617

where ΔC′ and ΔH′ are the differences in chroma and hue; SL, SC, and SH are the weighting functions; KL, KC, and KH are the parametric factors; and RT is a rotation function.17 The parametric factors were set to 1.16 The translucency parameters (TP) of each subgroup were calculated from the CIEDE2000 color differences (ΔE00) between the color values of the specimens against a white and a black background.18
The crystalline phase analysis was peformed with X-ray diffraction (XRD; D8 ADVANCE, Bruker, Karlsruhe, Germany) using Cu-Kα radiation (λ = 1.5406 Å). One representative specimen per each subgroup was selected and the specimens were scanned from 20 to 40 2θ degrees with a step size of 0.01-degrees and a scan speed of 2-degrees per minute. The monoclinic peak intensity ratio (Xm) and the monoclinic volume content (Vm) on the specimen's surface were calculated with the formulas (A)19 and (B)20 below:
where Im(−111) and Im(111) are the monoclinic peak intensities at 2θ = 28.175° and 31.468°, respectively, and It(101) is the tetragonal peak intensity at 2θ = 29.807°
The surface topographic analyses at a microscopic level were performed with an atomic force microscope (AFM; XE-100, Park systems, Suwon, Korea) and a scanning electron microscope (SEM; S-4700 SEM, Hitachi High-Technologies Co. Ltd., Tokyo, Japan). For the AFM examination, one representative specimen from each sintering group of 1.5 mm thickness was submitted to the analysis. The images were acquired in the non-contact mode (PPP-NCHR-50 probes, Force constant = 42 N/m) from an area of 10 µm × 10 µm (512 × 512 pixels per image) at a scan rate of 0.20 Hz using a specific software (XEI, XE-100, Park systems, Suwon, Korea). In addition, the average arithmetric mean roughness value (Ra) was obtained.
For the SEM examination, one representative specimen from each sintering group of 1.5 mm thickness was polished and thermally etched for 20 minutes at 1350℃. The specimens were then sputtered with platinum (Q150T Sputter Coater, Quorum Technologies Ltd., Ashford, Kent, UK) and photographs were taken with an accelerating voltage of 15 kV at magnifications of ×10000, ×30000, and ×50000.
Statistical data analyses were conducted by means of SPSS software (v23.0, IBM Corp., Chicago, IL, USA). The Shapiro-Wilk test was used to determine if the dependent variables (CIE L*, a*, b*, and TP) were normally distributed. Two-way ANOVA was performed to determine the effects of two factors (sintering method and thickness) on each continuous outcome variable. The interactions between the two factors were identified and simple main effects of independent variables were analyzed. In addition, the effect sizes and statistical powers were calculated. Statistical significance was set to 0.05 for all analyses.
RESULTS
Means (and standard deviations) for CIE L*, a*, and b* values against an A2 background and TP values of each subgroup and mean color values of an A2 shade tab are listed in Table 2. Two-way ANOVA analysis revealed that there was a statistically significant interaction between the sintering methods and thicknesses on CIE L* (F (2, 264) = 17.198, P < .001). The interaction effect of sintering method combined with thickness was relatively small for CIE L* (ηp2 = 0.115). The statistical power with α = 0.05 was 1.000 (Table 3). Simple main effects analysis showed that L* values significantly decreased as the thickness increased for conventional (F (2, 264) = 263.466, P < .001) as well as microwave sintering (F (2, 264) = 352.630, P < .001). In addition, higher L* values were noted for microwave sintering compared to conventional sintering at 0.5 mm (F (1, 264) = 8.547, P = 0.004) and 1.0 mm (F (1, 264) = 36.607, P < 0.001), while higher L* value was noted for conventional sintering compared to microwave sintering at 1.5 mm (F (1, 264) = 4.691, P = 0.031) (Table 4).
There was a statistically significant interaction between the sintering methods and thicknesses on CIE a* (F (2, 264) = 20.724, P < .001). The interaction effect of sintering method combined with thickness was relatively small for CIE a* (ηp2 = 0.136). The statistical power with α = .05 was 1.000 (Table 5). Simple main effects analysis showed that a* values significantly increased as the thickness increased for conventional sintering (F (2, 264) = 308.543, P < .001) as well as microwave sintering (F (2, 264) = 508.415, P < .001). In addition, higher a* values were noted for microwave sintering compared to conventional sintering at 0.5 mm (F (1, 264) = 37.344, P < .001), 1.0 mm (F (1, 264) = 231.517, P < .001), and 1.5 mm (F (1, 264) = 113.990, P < .001).
No interaction was found between the sintering methods and thicknesses on CIE b* (F (2, 264) = 0.989, P = .373). The statistical power with α = .05 was .221 (Table 6). Independent samples t-Test showed that there was a significant difference in b* values between conventional and microwave sintering (t(268) = 7.906, P < .001, d = 0.96). Higher b* values were noted for microwave sintering.
There was a statistically significant interaction between the sintering methods and thicknesses on TP (F (2, 264) = 34.257, P < .001). The interaction effect of sintering method combined with thickness was relatively small for TP (ηp2 = 0.206). The statistical power with α = .05 was 1.000 (Table 7). Simple main effects analysis showed that TP values significantly decreased as the thickness increased for conventional sintering (F (2, 264) = 20740.663, P < .001) as well as microwave sintering (F (2, 264) = 20610.262, P < .001). In addition, higher TP values were noted for conventional sintering compared to microwave sintering at 0.5 mm (F (1, 264) = 9.474, P = .002) and 1.0 mm (F (1, 264) = 143.160, P < .001). Sintering methods had no effect on TP values at 1.5 mm (F (1, 264) = 0.852, P = .357).
CIEDE2000 color difference (ΔE00) values between the two sintering methods at each thickness were evaluated: 0.52 ΔE00 units at 0.5 mm; 0.96 ΔE00 units at 1.0 mm; and 0.63 ΔE00 units at 1.5 mm. ΔE00 values between each subgroup and an A2 shade tab were calculated: 9.97 ΔE00 units between conventional /0.5 and an A2 tab; 7.97 ΔE00 units between conventional /1.0 and an A2 tab; 7.39 ΔE00 units between conventional /1.5 and an A2 tab; 10.32 ΔE00 units between microwave /0.5 and an A2 tab; 8.69 ΔE00 units between microwave /1.0 and an A2 tab; 7.20 ΔE00 units between microwave /1.5 and an A2 tab.
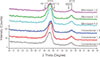
The XRD patterns in the 2θ range from 20 to 40° of each subgroup are shown in Fig. 1. For all subgroups, the XRD analyses revealed similar diffraction patterns. The major peaks of the tetragonal phase were located at 29.807° (2θ), corresponding to the orientation t(101). The peaks of the tetragonal phase were also detected at 33.995° and 34.828° (2θ), corresponding to the t(002) and t(110) crystallographic phases, respectively. For the monoclinic phase, small peaks were observed at 28.175° and 31.468° (2θ), corresponding to m(−111) and m(111) directions. The relative amounts of the monoclinic phase on each specimen are listed in Table 8. The monoclinic peak intensity ratios (Xm) detected on the surfaces of the specimens ranged from 7.03% to 9.89% for conventional sintering, and from 7.31% to 9.17% for microwave sintering. The calculated volume fractions (Vm) of monoclinic phase ranged from 9.02% to 12.58% for conventional sintering, and from 9.37% to 11.69% for microwave sintering. The smallest amounts of monoclinic phase were found on the specimens of 1.0-mm thickness for both sintering methods.
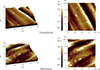
Fig. 2 shows characteristic surface topographic patterns of the conventional- and microwave-sintered specimens (1.5 mm thickness). The AFM images demonstrated the scratch lines induced in the cutting stage to adjust final thicknesses. In addition, the monoclinic spots were detected along the scratches. AFM analyses revealed Ra value of 0.054 µm for the conventionally-sintered specimen and 0.034 µm for the microwave-sintered specimen.
SEM micrographs of the specimens with conventional and microwave sintering are shown in Fig. 3. The microwave-sintered specimen demonstrated a uniform equiaxed grain structure with an average grain size of approximately 250 nm, whereas the conventionally-sintered specimen exhibited a non-uniform grain structure with smaller grains that were approximately 100 – 250 nm in size.
DISCUSSION
Based on the results of this study, the null hypotheses were rejected because significant differences in the CIE L*, a*, b*, and TP values were found between sintering methods and the CIE L*, a*, and TP values were affected by the thickness. Previous literatures reported that sintering conditions could affect the optical properties of the ceramics.342122 Ebeid et al.22 found that translucency increased as the sintering time and temperature increased because reduced pores and increased density induced less light scattering with more transmission. Similarly, this study found that the specimens by conventional sintering with longer processing time exhibited higher translucency values. Kim et al.14 investigated that decreased sintering time led to smaller grains and smaller grains resulted in reduced light scattering and more light transmission. O et al.23 demonstrated that for the grain smaller than one-third of the wavelength of the light, the transmittance increased in accordance with Rayleigh scattering and the transmittance increased with decreasing grain size. In the present study, microwave sintering produced slightly larger grain size although both sintering processes produced nano-sized grains (approximately 100 – 300 nm) and conventional sintering offered slight increase in translucency. From the SEM views of this study, the grains of microwave sintering had relatively-equiaxial shapes and were arranged in a uniform-packed appearance causing better specular reflection; therefore, higher color values were noted compared to those of conventional sintering (P < .001).
The color differences between conventional and microwave sintering were 0.52 ΔE00 unit at 0.5 mm, 0.96 ΔE00 unit at 1.0 mm, and 0.63 ΔE00 unit at 1.5 mm and these color differences could not be detected according to the criteria of 50:50% perceptibility threshold values based on the previous studies.242526 The color differences between an A2 shade tab and each subgroup ranged from 7.20 to 10.32 ΔE00 units, which could be considered as clinically unacceptable according to the criteria of 50:50% acceptability threshold values based on the previous studies.24252627 Therefore, the results of this study indicated that pre-colored monolithic zirconia ceramics would not match the corresponding shade guides.
There were small interaction effects on CIE L*, a*, and TP between sintering method and thickness (P < .001): L* (partial eta squared ηp2 = 0.115), a* (ηp2 = 0.136), and TP (ηp2 = 0.206), although higher b* values were noted for microwave sintering regardless of thickness. Several studied have reported that the optical properties of ceramics could be affected by the thicknesses.282930 In this study, as the thickness increased, significant reduction in L* values and increase in a* values were observed, while no significant differences in b* values were recorded regardless of sintering methods, which was comparable to the results of one previous study.28 The translucency was decreased as the thickness increased for both sintering methods, which was consistent with the results of previous studies.2930
As reported in the previous studies, sintered Y-TZP ceramics had tetragonal and cubic phases without monoclinic phase.3132 Hallmann et al.32 investigated that monoclinic volume fraction (Vm) of Y-TZP abraded with 150-µm alumina particle was 8.68% and roughness value (Ra) was 0.91 µm, while Vm of Y-TZP abraded with 150-µm zirconia particle was 1.22% and Ra, 0.08 µm. In this study, relatively large fractions of monoclinic phase were noted (Xm, 7.03% – 9.89%; Vm, 9.02% – 12.58%) for both sintering methods, which might be attributed to the cutting procedure to adjust final thicknesses. Furthermore, different amounts of monoclinic phase were measured among different thicknesses within the same sintering method. The XRD patterns revealed that doublet configurations were observed at 29.807° (2θ), corresponding to t(101) for the specimens in 1.5-mm thickness of both sintering methods. Any structural changes of lattice parameters depending on the thickness might be expected, and therefore further study should be required. A previous study reported that the thicker specimen displayed more accurate peak appearance.33
In the present study, the specimen by microwave sintering had smoother surface (Ra = 0.034 µm) than that by conventional sintering (Ra = 0.054 µm). These results may be due to the grains with uniform size and shape in the microwave-sintered specimen. Therefore, in terms of the optical properties, microwave-sintered pre-colored monolithic zirconia ceramics would exhibit similar color appearance and smother surfaces with the reduced processing time and cost compared to those sintered in a conventional furnace. The limitations of this study were possible edge loss effect of spectrophotometric reflectance measurements and the use of a limited shade of a specific manufacturer.


 XML Download