

 PDF
PDF ePub
ePub Citation
 Print
Print


INTRODUCTION
Accurate fit is essential for the success and longevity of dental prostheses.1 Inadequate marginal or internal fit may lead to cement dissolution and plaque accumulation, thereby increasing the risks of dental caries, endodontic inflammation, and periodontitis.23 Various methods have been used for the measurement of the level of adaptation of prostheses.456 The silicone replica technique (RT) is a widely used and acceptable method for measuring the gap between the prostheses and abutment.789 The gap is replicated using impression silicone and then measured by microscopy at the marginal and internal regions. Since the measurement is performed using the replica, the technique can be applied in both in vivo and ex vivo studies. The procedure of RT mimics the clinical cementation process, thereby increasing clinical relevance.10 Moreover, this technique allows evaluation of the internal fit of prostheses, such as in the axial and occlusal regions. The accuracy and reliability of RT have been verified in previous studies.91011 Laurent et al.10 reported that the use of RT allowed accurate prediction of the fit of prostheses, regardless of the measurement location. Similarly, Rahme et al.11 concluded that the RT was highly accurate and reliable in reproducing the thickness of cementation space. However, this technique is based on a 2-dimensional analysis and is prone to error during silicone sectioning and measurement.1213 To decrease methodological errors and obtain 3-dimensional data, the computer-aided replica technique (CART) has been proposed.1415 This digital approach used an optical scanning and image-superimposition process to digitize the gap space. This approach facilitates not only visualization of the gap, but also allows 3-dimensional geometric analysis.
Measurement of agreement is required to prove the acceptability of a new method or process before its application.1617 Several statistical methods, such as the Pearson's correlation coefficient, intraclass correlation coefficient, within-subject coefficient of variation, and concordance correlation coefficient (CCC), can be used to verify the agreement.18 The CCC was first proposed by Lin in 1989.19 This method identifies the agreement between two methods by calculating variations in their linear relationship from the 45 degrees line running through the origin. The advantage of CCC is that the indices reveal the accuracy and precision level as well as the degree of agreement.1720 For accuracy measurement, the distance from the best-fit line to the concordance line is evaluated, and for precision measurement, deviation of the observations from the best-fit linear line is evaluated. The agreement is determined on a scale of 1 (perfect agreement) to 0 (no agreement) to -1 (perfect reversed agreement).21 It was previously reported that the CCC is an effective means for verifying a new method. Cerna et al.22 showed the efficacy of this verification method for determining the reliability of a new occlusal analyzer for measuring bite force. The CCC is also widely used for calculating sample size for validation studies, generalizing linear and nonlinear mixed-effects models by assessing the fit, and improving the ability of estimating data with outliers.212324
Although the recently developed CART is a useful method for analyzing the adaptation of fixed prostheses 3-dimensionally, the validity of this method has not been proven. The purpose of this study was to verify the CART by calculating its level of agreement with RT using the CCC statistical method.
Go to : 
MATERIALS AND METHODS
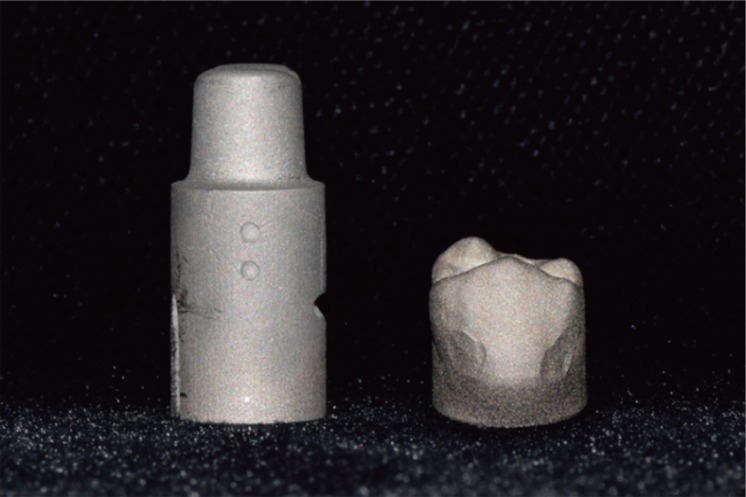
A prepared premolar with a 1.0-mm deep chamfer margin and total convergence angle of 6 degrees25 was designed in dedicated software (CATIA V5 R18; Dassault Systemes, Suresnes Cedex, France). The die design contained the base part, with notches. The virtual die was imported into CAD software (Ceramill match2; Amann Girrbach, Koblach, Austria) to design a crown. The cementation space of the crown was set at 50 µm, starting 1.0 mm above the margin.26 Thereafter, the designs were processed to the metal die and crown by using a millable cobalt-chromium block (Ceramill Sintron; Amann Girrbach, Koblach, Austria) and a 5-axis milling machine (Ceramill Motion 2; Amann Girrbach, Koblach, Austria) (Fig. 1).
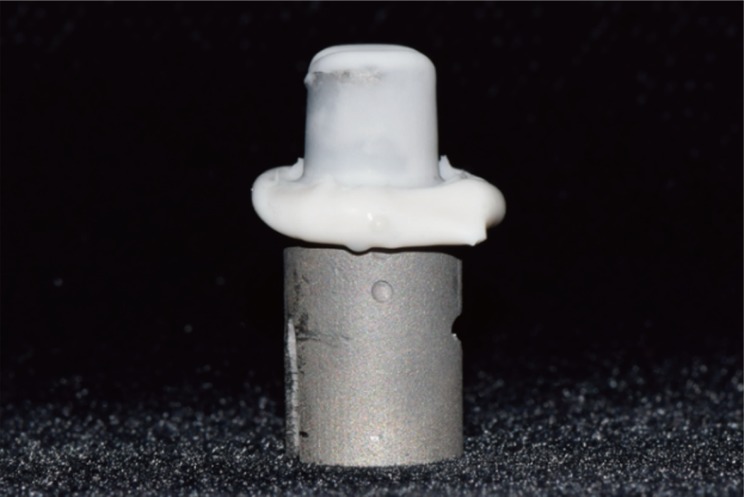
The surface texture of the metal die was modified to a matte surface by using airborne-particle abrasion, using alumina oxide of a 50-µm particle size, at a pressure of 2.8 bar, for 12 seconds, from a distance of 10 mm, in order to decrease light reflection. Then, it was digitized using an optical scanner (Ceramill Map 400; Amann Girrbach, Koblach, Austria), and the surface image was saved in Standard Tessellation Language (STL) format (STL-A). The intaglio of the crown was filled with a silicone indicator paste (Fit Checker II; GC, Tokyo, Japan). Then, the crown was placed on the metal die under a static loading pressure of 50 N, in the direction of the long axis of the die, for 10 minutes.14 The crown was carefully removed, leaving a silicone layer on the metal die (Fig. 2). The silicone layer and base part of the die were scanned and saved in STL format (STL-B). Using these procedures, a total of 25 silicone replicas and scanning sets were prepared.
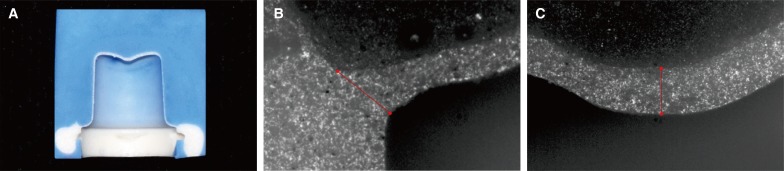
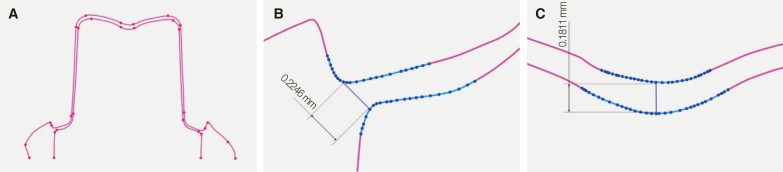
Two different methods, RT and CART, were used to evaluate the fit accuracy of the crown. For the RT group, a heavy body silicone (Virtual; Ivoclar Vivadent, Schaan, Liechtenstein) was applied over the gap space silicone replica for stabilization. Subsequently, the silicone block was perpendicularly sectioned along the buccolingual plane at the centric long axis of the tooth by using a razor blade (Personna; American Safety Razor, Verona, Virginia, USA) (Fig. 3A), and observed using a measuring microscope (Nikon MM-40; Nikon, Tokyo, Japan) under × 50 magnification (Fig. 3B, Fig. 3C). For the CART group, the STL-A and STL-B files were imported to a software program for 3D image analysis (Geomagic DesignX; 3D Systems Inc., Rock Hill, SC, USA). The two STL files were superimposed using the congruent base part of the die, and then the gap space was extracted by subtracting the STL-A from the STL-B.15 The 3D image of the gap space was vertically sectioned at the center of the image, at which a cross-sectional contour line image was obtained (Fig. 4A). In the cross-sectional image, the gaps between the restoration and abutment were automatically measured by marking points on the contour line (Fig. 4B, Fig. 4C). The fit accuracy was evaluated in the marginal and occlusal regions. The marginal gap was defined as the distance between the most external point of the crown margin and the die finish line, while the occlusal gap was defined as the vertical distance between the crown and die at the center fossa region.1 One operator, who was blinded to the purpose of this study, performed all measurements.
The reliability of gap measurement was then evaluated using CCC, the Bland-Altman method for each of RT and CART pair. The CCC value (ρc) was computed as follow using statistical package R, version 3.2.5 (R Core Team, Vienna, Austria):1619
ρc = 1 - ratio of the mean square of within sample total deviation and the total deviation
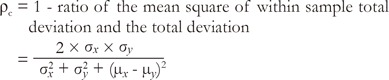
where σ2x and σ2y
 are the variances for the two variables, μx and μy and are the corresponding means.
and σ2y are the variances for the two variables, μx and μy and are the corresponding means.The agreement was defined as follows: the within-sample total deviation was not more than 31.6% of the total deviation.9 This translates into a least-acceptable CCC of 0.90 (1-0.3162). Lower 95% confidence limits were obtained from the bootstrap percentile using a fixed, large number of bootstrap resamples.
When the agreement measurement shows evidence of disagreement, the sources of the discrepancies should be addressed. It is necessary to determine whether the discrepancy is due to a shift in marginal distribution (inaccuracy) or due to a large within-sample variation (imprecision). The accuracy coefficient (xɑ) is:16
The precision coefficient (ρ) was drawn using the CCC (ρc) and accuracy coefficient (xɑ) as below.16

The Bland-Altman method presented the magnitude of differences in the gap measurements by obtaining the 95% limits of agreement between the gap measurements.27 The Bland-Altman plots were drawn using MATLAB software (MathWorks Inc., Natick, MA, USA) where X axis was the mean of two paired measurements and Y axis was the relative difference between two paired measurements.27
Go to :
RESULTS
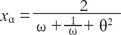
The two methods showed a linear association, with a strong positive correlation in the gap measurements (Fig. 5). The data points were clustered around the 45-degree line, with little variation. The 95% limits of agreement range between the gaps measured by the RT and the CART were 3.84% and 7.08%, respectively, of the mean for the marginal and occlusal gap measurements (Fig. 6). The relative deviations were smaller in the marginal region than in the occlusal region.
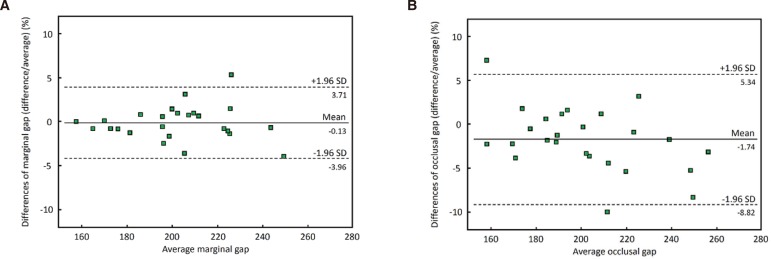
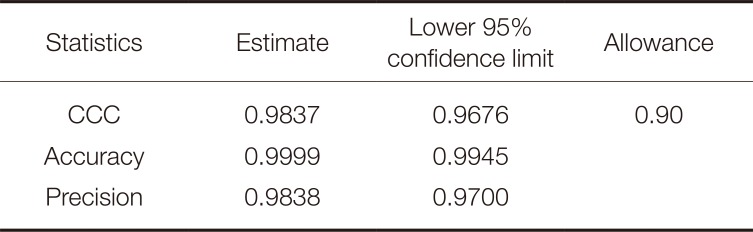
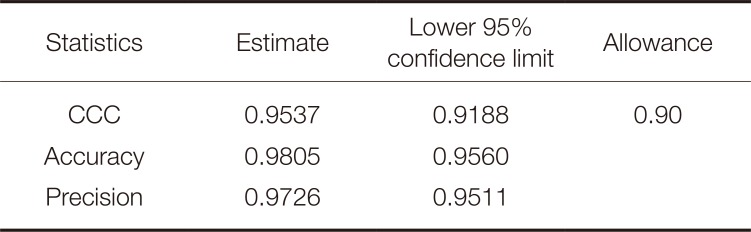
Table 1 and Table 2 show the agreement statistics for the marginal and occlusal gap measurements. The CCC estimates and one-sided lower 95% confidence limits were greater than the allowance level for both regions. A value exceeding 0.91 was considered to represent good agreement. The accuracy and precision estimates for the marginal gap were 0.9999 and 0.9838, respectively, while these values for the occlusal gap were 0.9805 and 0.9726, respectively. In both these regions, the accuracy estimates were greater than the precision estimates. The lower 95% confidence limits showed similar tendencies to these estimates.
The X-axes show the means of gaps measured using both techniques, and the Y-axes show differences between gaps in each pair as a percentage of their mean. Solid lines = mean absolute differences. Dashed lines = 95% limits of agreement.
Go to :
DISCUSSION
This study accessed the validity of the CART for evaluating the fit accuracy of fixed dental prostheses by using statistical agreement analysis and confirmed that the measurement value obtained from the CART agreed with that of the RT, with high accuracy and adequate precision. Thus, based on the results of this study, it is conceivable that the CART is a feasible method for 3-dimensional analysis of fixed dental prostheses.
The advantages of converting a gap space to a virtual image include the convenient data handling and increased data utilization. Since the measurement object is a digital image, outcome parameter analysis can be performed with ease by using the editing and measurement functions of computer software. This computer-aided approach allows various geometric analyses, such as the overall mean discrepancy, quantification of discrepancy in a specific region, and the entire volume of the gap space. A 3-dimensional, color-coded map showing discrepancies is also a useful way to reveal the distribution and degree of error.142728 Another advantage of digitization is the decrease in the possible error sources in methodology. The CART eliminates the manual replica sectioning process and reduces the need for decision-making during the selection of measurement points. Thus, this computer-aided approach could aid in obtaining more reliable results.
An indispensable prerequisite for use of the CART is to have a congruent area for image-superimposition of STL files. Without such a suitable reference area, high-quality image alignment cannot be performed. In this in vitro study, large and notch-including base parts of the die were used as a reference for superimposition. For clinical conditions, adjacent teeth or non-movable mucosa can be used as the reference area. Additionally, it is necessary to use a suitable optical scanner for the CART. Contemporary certified optical scanners show high accuracy and reproducibility.4 Further large-sized clinical prospective trials are required to confirm the results of the present study and to evaluate the feasibility of applying it to various clinical conditions.
Go to :
CONCLUSION
Within the limitations of this statistical agreement study, it is confirmed that CART is as accurate as the RT for evaluating the fitness of fixed dental prostheses. Therefore, this digital approach can be applied to the analysis of fit accuracy of fixed dental prostheses for visualizing and quantifying the fit discrepancy 3-dimensionally.
Go to :
 XML Download