

 PDF
PDF ePub
ePub Citation
 Print
Print


INTRODUCTION
Aesthetic expectations have been on the increase in accordance with the emerging technologies and the rising standard of living. Thus a stronger emphasis on aesthetics has caused a rapid development and use of the aesthetic/restorative materials, demanding novel aesthetic restorative materials.1234
IPS e.max CAD (Ivoclar Vivadent, Liechtenstein), a lithium disilicate containing, has been known as versatile, aesthetic, colour-stable, biocompatible aesthetic material of prosthetic dentistry.2345 It has been shown to have a much higher capacity of endurance to three dimensional forces45 than that IPS Empress CAD (Ivoclar Vivadent, Liechtenstein), which was enforced with homogeneously distributed leucite content, instead of a metal support at the bottom. Lava Ultimate CAD (3M ESPE, USA) block is based on the combination of ceramic and nanotechnology. The blocks consist of nanoceramic particles embedded in a highly cured resin matrix. It is neither a composite nor a ceramic but rather a mixture of both. The manufacturer of the resin nanoceramic (RNC) has been named the Lava Ultimate, eighty percent of which is composed by silica and zirconia particles, in 20 nm and 4 - 11 nm diameters, respectively.67
To ensure long-term aesthetic, colour stability is an important criterion to be considered. Another criterion of aesthetics is the surface roughness. Rough surfaces are more prone to colouration because of its elevated retention capacity.89
Mouthrinse solutions are commonly used to prevent control caries and periodontal diseases.10 In addition, they are widely used even without professional prescription. Mouthrinse solutions have various components such as antimicrobial agents, salts, organic acids, dyes and in some cases alcohol.11 As very well known, alcohols consist of hydroxyl groups, which may react with cations of composites such as Zr+4, Si+4, and Zn+2 to be dissolved in fluid and causes material loss. Besides, same condition can be concluded for salts, to react with similar cations. F, as a deteriorating anion for Si is the most important element for the main ingredient of bioceramics of interest for this study. Therefore, to some extend, SiF4 may be formation which is perhaps responsible for the corrosion of the bioceramic.1213 Organic acids such as citric acid (as in lemon, apple and peppermint) and benzydamine hydrochloride as in many vitamin and drugs can easily deform the surface of ceramic composites, which then results in color change. Mouthrinse solutions as well as soft drinks, including tea and coffee, often give their colour to restorative materials due to the organic dye content which either enter into the nano pores of ceramics and polymers or absorbs onto the surface. This situation changes the color by shifting the UV scatter to higher or lower values in the visible spectrum. There have been several studies on the coloration of composites, denture-base resin,141516171819 but there was no literature available on the coloration of aesthetic bioceramic materials.
MATERIALS AND METHODS
Some features of the bioceramic materials and the mouthrinse solutions were presented in Table 1 and Table 2, respectively. For the control group, the rinsing solution was replaced by distilled water. Ten samples for each group were chosen to perform statistical analysis: α = 0.05, β = 0.10 (1-β) = 0.90 and it was found that P = .90467.
The ceramic specimens were prepared by cutting at 300 rpm using a minitom (Struers, Pederstrupvej 84, DK-2750 Ballerup, Denmark) and IPS e.max CAD (Ivoclar Vivadent, Schaan, Liechtenstein) specimens were crystallized by sintering for 30 minutes at 850℃ in an electric furnace (Programator P300, Ivoclar Vivadent, Liechtenstein). The ramp rate was 10 ℃/min for crystallization. All samples were cut into 2.0 × 12.0 × 14.0 mm dimensions and measured to 0.1 mm accuracy using electronic calipers (Mitutoyo, Kawasaki, Japan). Surfaces were ground using pre-wetted silicon carbide grinding paper (Grids 800, 1,000, and 1,200 Buehler-Meter II, Lake Bluff, IL, USA) prior to experiments. The samples were then rinsed with distilled water, ethanol, and finally acetone to remove the organic residues.
Mouth rinsing was simulated in a turbula shaker at 60 rpm by using a home-made agitation instrument, made up of five glass compartments (Fig. 1). The specimen groups and control samples were placed into these compartments, filled with 120 mL mouthrinse solutions or distilled water. To simulated the time, it has been reported2021 that each of test materials was exposed to mouthrinse for 12 hrs, which is equivalent time to 1 year of 2 min daily mouthrinse use. Therefore, in the present study, for about 10 years exposure to mouthrinse solution, dental bioceramic samples were immersed for 120 h. Every 12 hrs, the solutions were replenished and immersion was continued up to 120 hrs.
Following the incubation, the specimens were rinsed in distilled water. Reflectance was read by spectrophotometry (Vita Easyshade; VITA Zahnfabrik) and white-black (ΔL*), red-green (Δa*), and blue-yellow (Δb*) values were obtained in a CIELAB system.22 Colour shift values, ΔE, were then calculated using the Eq.1. Before measurement of the reflectance, the spectrophotometre was calibrated on white colour.
Polished surfaces (Ra; in µm) of the specimens were analyzed by profilometry (MitutoyoSurftest SJ-301, Kanagawa, Japan) over a transverse length of 4 mm and with a cutoff value of 0.8 mm. The instrument was calibrated at 3.05 µm. Measurements were repeated three times and their mean values were taken as the average surface roughness value.
Representative twelve specimens were picked, and 10 × 10 µm areas were scanned by atomic force microscopy (AFM; Veeco Multimode 8, Santa Barbara, CA, USA) at 256 × 256 pixel resolutions at 1.6 Hz. The vibration frequency was 10 kHz. Average surface roughness value, Ra, was determined. Another twelve samples were analyzed by scanning electron microscopy (SEM, LEO 440, Cambridge, UK). The specimens were made conductive by coating with Au-Pd in a sputter coater device (Polaron SC7620) for 15 s at 3 Å per second under a vacuum of 4 × 10⁻² mbar before SEM investigations. Post process on SEM-SE image to analyze the surface roughness were made The linear histograms was extracted from the post processing software of Mira3 XMU SEM (Tescan, Brno - Kohoutovice, Czech Republic) and moving average for background was applied to analyze the relative peak to deep surface levels. The relatively high surfaces are seen whiter in SEM-SE whilst the darker regions indicate valleys with relatively lower surfaces. In histograms, 16 pixels are equal to 1 micron real distance of the surface at 10 kX magnification.
The mean ΔE and surface roughness values and standard deviations were calculated by using SPSS Statistical Software (SPSS version 22.0 software, SPSS Inc., Chicago, IL, USA). ΔE data were then analyzed by Generalized linear model. Surface roughness data were analyzed by Repeated measures. In both analyzes, ceramic and mouthrinse solutions interactions were tested. Significance values were adopted for cases where the differences were smaller than 0.05.
RESULTS
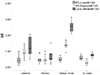
ΔE values of all immersed samples are presented in Table 3 and Fig. 2. Colour shift values indicated that although mouthrinse solutions significantly affected the specimens (P ≤ .05) (Table 3), they were still within the range of clinically acceptable values1123 (below 3.3). The least affected material was found to be IPS e.max CAD (<1). The values of ΔE of IPS Empress CAD-Tantum and Lava ultimate CAD were found to be 1.35 ± 0.20 and 2.54 ± 0.3, respectively.
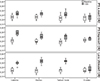
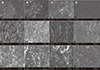
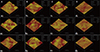
The mean Ra values of three restorative materials after 120 hrs of exposure demonstrated that the mouthrinse solutions caused significant changes in the surface roughness of the three restorative materials used (P < .05) (Table 4 and Fig. 3), but these changes remained within the clinically acceptable range. Although the changes were undetectable by the naked eye, the increase in the surface roughness was clearly evident on the images of SEM (Fig. 4A, Fig. 4B, Fig. 4C) and AFM (Fig. 5A, Fig. 5B, Fig. 5C) when compared with the much smoother appearance of the control samples (Fig. 4D, Fig. 5D, respectively).
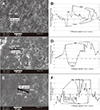
Additionally, Fig. 6 shows the drawn line for post process on SEM-SE image to analyze the surface roughness of IPS Empress CAD-Listerine, IPS e.max CAD- Klorhex, and Lava Ultimate CAD- Tantum verde sample after immersion. The corroded surface was evident by hills and valleys as seen in Fig. 6B, Fig. 6D, Fig. 6F) in linear histogram.
DISCUSSION
The bioceramic restorative materials used in this study were chosen for two reasons: (i) they have frequently been used in dentistry,2425 and (ii) no report has been available on the effects of mouthrinse solutions on the ΔE and surface roughness of bioceramic materials. Colour deterioration has been one of the main causes (38%) of the replacement of prosthetics.2627 Besides using chemical agents, such as mouthrinse, it can be caused by drinking of coloured acidic or alcoholic beverages, and of tea or coffee. Colouring effect of various beverages on the ceramic restorative materials has been studied.141516
Ethanol has a dissolving effect on the water absorbing composite materials. Mouthrinse solutions containing ethanol might thus exercise a softening effect on the prostehetic material.21 Tantum Verde, for example, has a very high ethanol content (95 vol %), and in this study it gave a rise to the highest change both in colour and in surface roughness. Expectedly the lowest changes were caused by Klorhex which has the lowest alcohol content.
Colour change can be detected by naked eye for ΔE values equal to or higher than one, or by colourimetry or spectrophotometry when ΔE <1.11232829303132 In this study, spectrophotometry was used in which the results were automatically provided through a coordinate system (CIE L* a* b*).11213334 Ceramic materials having ΔE values greater than 3.3 are clinically unacceptable.1123 As can be seen in the results section, the mouthrinse solutions resulted in clinically acceptable changes both in surface roughness and in colour of the ceramic restorative materials used, and by comparison Klorhex treatment produced the lowest ΔE and Ra values (P > .05).
Surface roughness can be assessed by visual (microscopic), profilometric or spectroscopic methods.3536 Profilometric measurements yielded an average surface roughness value of between 0.2 and 0.35, and this finding was found to be acceptable clinically.37 Scanning Electron Microscopy and AFM images produced compatible surface topologies with the values of quantitative profilometric assessment.
As seen in Fig. 4a1-3, the effect of Listerine mouthrinse on the used ceramic materials was discussed by SEM surface features. By rinsing in Listerine solution, the surface roughness increased abruptly, and the dissolution in ceramic matrices into the solutions is obvious by pore formation especially on the surface of IPS empress CAD in Listerine solution. The pores among the regular surface both increase the surface roughness and increase the level of ΔE compared to immersion into water in all groups from 0.28 ± 0.11 to 0.92 ± 0.33. This situation could be due to the occurrence of hills and valleys by changing the average values from 0.26 to 0.34.
For IPS empress CAD, Tantum Verde solution has the highest corrosion effect thus it is found that the value of ΔE as to be 1.35 which has a surface morphology of layered and wear debrided surface with high level of asperities including big waves as seen in Fig. 4c2. Since Tantum Verde has a high volume of ethanol (95 vol%) in the solution accompanied by methyl parabens, saccharin, quinoline yellow, patent blue which give a greenish colour to the material. This may be attributed to yellow and blue mixture giving a green colour to solution itself and remaining on the material as a surface absorbed organic content. A feldspatic porcelain material with a leucite reinforcement may also be affected from 95 vol% ethanol and 0.15% benzydamine hydrochloride containing solution with even a low amount of HCl type acidic solution. As very well known, feldspatic porcelains are water resistant and have low chemical stability in case of ethanol and acids due to affinity of K+ and Na+ cations to Cl- anions, which causes a dissolution reaction from the solid leaving an excessive corroded surface as in Fig. 4c2 as well as in Fig 4b1 with a high amount of SiO2 subjected to F- containing solution with a reaction ability of SiF4 to pass into solution.
The most affected group is Lava Ultimate CAD by the formation of very small pores and big hills as delamination and scratch areas. Fig. 4d3 can be said to be ground and polished surfaces of all ceramic-composite dental materials and was not affected significantly from the solution other than grinding scratches that can be seen on the surface, and these values were kept as baseline roughness values which would be compared by other surfaces subjected to different solutions. As mentioned before the most corroded surface was found to be Lava Ultimate CAD's surface by Tantum Verde, which can be attributed to polymeric content and random distribution of ceramic particles in polymer resin that cause a much faster corrosion by decreasing binding ability of polymer. This loss of binding ability may be attributed to benzydamine hydrochloride and (95 vol %) ethanol of Tantum Verde solution which also has similar organic structures to deform the polymer which acts as binder and causes much higher material loss. The existence of higher hills and deeper valleys also increases the roughness values from 0.21 to 0.3 which was statistically the most significant difference among the material and solution groups. The colour change also seems to be the highest, 2.54 ± 0.32, which was indicated as acceptable but close to upper limit.
Post process on SEM-SE image to analyze the surface roughness was shown in Fig. 6. The corroded surface was evident by hills and valleys as seen in Fig. 6B, Fig. 6D, Fig. 6F in linear histogram. Fig. 6A represents the IPS Empress CAD in Listerine solution. As discussed before, Listerine has the highest impact on ceramic composite bodies due to dissolution possibility of many cations by anions in solution. The scratched lines on SEM image in Fig. 6A show the repeating hills and valleys as shown in Fig. 6B with the highest peak to deep distance of approximately 160% of the surface level. This means that if the surface is in focus (by adjusting WD (Working Distance) accurately to a known highest point), then the highest and the deepest points are 1.6 micron (~155 Arbitrary Distance Units) from each other, which is again evident by adjusting the WD (the focus of electron beam in this case) to the lowest point. This adjustment is independent from the brightness and contrast in all samples. This measurement does not indicate the overall roughness of the surface in a specific solution but is important for understanding the hill and valley formation by corrosion of whole body.
Fig. 6C represents Lava Ultimate CAD in Klorhex and Fig. 6D indicates the linear histogram of line on SEM image. There occurs a large valley with 3 microns real width and 1.9 microns of depth (~195 Arbitrary Distance Units), found by adjusting the WD by the same manner as mentioned above. A wide valley and other hills can be seen on SEM image by arrows as well. As known before, the darker the deeper, the lighter the higher in SEM secondary electron contrast imaging (SEI). The highest peak to deep surface level difference was found in this image of interest, which may indicate that the most deteriorating corrosion formation belong to Lava Ultimate in Klorhex solution.
Fig. 6E shows the IPS emax in Tantum Verde solution. The line represents a 15 micron long linear histogram measurement as shown in Fig. 6F. The darker regions indicate the deeper surface levels while the lighter areas come up with higher levels. According to the drawn line, there is a steep increase of SEM level contrast, which means level difference such as a ramp in the middle region of line. Then, to the end of the line, there is another lower surface with darker areas. The lowest peak to deep surface level was seen in this picture as to be about 1,3 microns (135 Arbitrary Distance Units), which was determined by accurately adjusting WD for post process purposes. In Fig. 6F, the hills are very clearly seen while the valleys are of lower regions under the higher surface levels. There is also drastic decrease in surface level among the hills that can be evaluated as valleys by the formation of darker point-like structures.
As seen in Fig. 5d1-3, the all atomic force microscopy (AFM) images represent the samples immersed in distilled water as control groups. The lowest Ra values were found in the control group as to be between 22.89 nm and 40.52 nm, as indicated on each figure. The grinding and polishing scratches are visible within the images at d group. The scratches have no deteriorating effect on Ra values since the polishing was done by 1 µm diamond paste. The images were taken just after the immersion period was over. The samples were cleaned by distilled water to remove any residues on the surface and contact mode AFM with a load of 3 mN was employed for the surface roughness tests in an area of 10 µm × 10 µm.
For Listerine group indicated by the letter a, the highest Ra value was observed for IPS empress CAD ceramic material. The increase in roughness can be attributed to the dissolution of Na-K ions from the ceramic material by reacting with F ions to form compounds such as NaF and KF. As very well known, the affinity of Na and K, as well as Si to F in a high F containing environment, may give reaction for the formation of mentioned compounds. The lowest Ra values were obtained from IPS e.max CAD ceramics as 49.65 nm. The corresponding value was also the lowest Ra value except the control samples immersed in distilled water. This may be attributed to the higher glassy phase amount of IPS e.max CAD than other materials. The glassy phase comes from Li containing ternary phase of Li-Si-K-O accompanied with ZrO2 and ZnO, which are the most stable oxides against organoacidic corrosion. In this manner, the Si-K-Zr-Li phases may give reaction at 850℃ to form glassy phases by the aid of P2O5 which is known as feldspathic porcelain.
For Klorhex group indicated by the letter b, however the highest roughness value was observed as 77.37 nm for Lava Ultimate CAD composite material, the average value remains between 71 nm and 77 nm which may be concluded as in the same standard deviation levels. Klorhex as illustrated in Table 2, contains a low amount of lemon extract which is known as citric acid. The low amount of citric acid and peppermint does not give a low pH value around 2 but around 4 - 5 for the dissolution of filler phases in Lava Ultimate CAD. Since the filler compounds as SiO2 and ZrO2 in nanometer scale, the wear or corrosion of these compounds does not cause a drastic increase of roughness values. The polymer matrix may be deformed by increasing immersion period and can be subjected to high level stresses and elastic rebound which cannot be associated by ceramic materials, and therefore the breakage of ceramic material occurs.
The letter c, indicates Tantum Verde solution for all samples. The highest Ra value was also found for Lava Ultimate CAD composite as 76.29 nm. The other samples have Ra values in the range of 61 - 69 nm. The lower the Ra value may be correlated to lower the polymer content in samples. By this determination, the Lava Ultimate group can be deformed more easily than IPS e.max and IPS empress groups due to lower ceramic material content. The increasing hard ceramic content with a glassy phase network formation may contribute to lower Ra value than as found for Lava Ultimate group.
CONCLUSION
This work implied that mouthrinse with lower alcohol content had less deteriorating effect on colour and on the structure of the bioceramic based materials. The mouthrinse treatment caused an increase in the surface roughness. The most resistant restorative material was expectedly the IPS e.max CAD. Lava Ultimate CAD displayed the highest colour change.


 XML Download