

 PDF
PDF ePub
ePub Citation
 Print
Print


INTRODUCTION
Recently, various attachments have been used for implant overdentures. Implant overdentures provide good support, stability, and retention with only a small number of implants and make it possible to have better mastication and function. 1 In addition, they prevent the resorption of the residual ridge and an existing denture can be recycled as an implant overdenture. For these reasons, the McGill consensus stated that mandibular implant overdentures should be the first treatment of choice for edentulous patients.2
The various attachments used in mandibular implant overdentures can be divided into splinted and solitary types, depending on their shape.3 The bar/clip attachment is a typical splinted type that makes the supporting mucosal membranes compensate for the stress transmitted to the implant by allowing rotation of the prosthesis. The solitary type includes ball, ERA, magnet, and locator types; these are connected to an implant individually and provide retention through mechanical engagement of male and female parts. The solitary type attachment, however, shows less retention than a bar/clip attachment.
Stress transmission in mandibular implant overdentures is quite different from that in implant-supported fixed prostheses. Generally, the implant seems to transfer stress by vertical stress forces. Nevertheless, the location, number, and masticatory forces of implants in an arch can also cause a horizontal force and moment. Because a denture base in an overdenture acts as a fulcrum line, the success rate of an implant is affected by the attachment attached to it, because it receives a considerable amount of bending moment that is transmitted to the alveolar bone around it. That is, it is important to prevent unnecessary stress from being transmitted to the attachment of an implant because the stress has a deleterious effect on the implant coupled to the alveolar bone.
The stress-transfer mechanism of attachments in various overdentures has been determined in several studies. Clinical trials have shown a decrease in both compressive and tensile forces applied to the alveolar bone around the implant of an implant overdenture compared to the implant in a fixed prosthesis and this is due to the mucosal elasticity of the edentulous ridge posterior to the implant.4 Masticatory force exerted on a mandibular implant overdenture is less than that in natural teeth or implant-supported fixed prostheses, 567 but vertical and horizontal stresses are both delivered6 and the horizontal stress is potentially more harmful to the implant and its surrounding tissues than vertical stress although the horizontal stress is less than the vertical stress.8 Thus, the design of the attachment must provide an optimum stress distribution around the implant to cope with the stress transmitted to the bone, within physiological levels. In vitro research and finite element analyses have shown that stress/strain around the implant is greatly affected by the implant design, and less stress is generated around an implant that is not splinted.910111213
In this study, for implant overdentures with a bar/clip attachment or a locator attachment, the stress transmitted to the implant in accordance with the change in the denture base length and the vertical pressure was measured and analyzed. Our tests revealed some interesting findings and valuable clinical implications.
MATERIALS AND METHODS
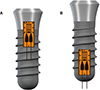
A ridge replication plastic model made for an actual patient (KHU CD-1, Nissin Dental, Kyoto, Japan) was impressed with silicone. Then, an alveolar mucosa (2 mm thick) was reproduced with a previously taken impression and polyether impression material (Impregum Penta, 3M ESPE, Irvine, CA, USA), and the model base was created with epoxy resin (Polyurock, Metalor, Neuchâtel, Switzerland). Tissue-level Straumann implants were used (diameter 4.1 mm, length 10 mm, Straumann, Basel, Switzerland) to reproduce the implant mandibular overdentures. For the strain gauge to have a tight contact with the surface of the implant, buccal and mesial threads of the #43 implant and lingual and distal threads of the #33 implant were properly adjusted, and flat surfaces were obtained. Strain gauges were positioned close to neck of implant at buccal and lingual side, close to apex of implant at mesial and distal side in order to prevent the interference of each other (Fig. 1). Strain gauges were attached to the implants using an adhesive. In the replicated epoxy model, holes 8 mm in diameter were made at both canine sites and implants were placed. Resin cement (Superbond CB, Sun Medical, Moriyama, Japan) was used to represent the osseointegration of actual implants. The maxillary and mandibular dentures on the replication model were fabricated in a conventional manner, and the same dentures were used repeatedly in the experiment by modifying their bases.
A universal testing machine (Instron 3367, Instron Co., Norwood, MA, USA) was used to exert a vertical pressure on the mandibular implant overdenture. To measure the strain rate of the implants placed in the replication epoxy model, a strain gauge (4.8 mm long, 2.4 mm wide; KFG-1-120C1-11L1M2R, Kyowa Electronic Instruments, Tokyo, Japan) was used. An A/D converter (PCD300A, Kyowa Electronic Instrument, Tokyo, Japan) was connected to a personal computer (Sense X11, Samsung, Seoul, Korea) to amplify and quantify the electrical signal from the gauge.
Bar/clip and locator attachments were connected to the implants. The bar/clip attachment was composed of an RN synOcta abutment (048.601, Straumann, Basel, Switzerland), an RN synOcta gold coping (048.204, Straumann), an SCS occlusal screw (048.350, Straumann), the CM bar, and a female component of 10 mm length (Dolder joint, Cendres & Mètaux, Biel, Switzerland). The locator attachment was composed of an RN Locator abutment (048.175, Straumann) and a blue replacement male piece (048.192, Straumann).
The groups of this study were divided according to the position of vertical loading and the length of denture base. The strain gauges were attached onto the four implants based on their locations as follows (Fig. 1); # 43iB: attached to the buccal surface of the implant at the mandibular right canine site, # 43iM: attached to the mesial surface of the implant at the mandibular right canine site, # 33iL: attached to the lingual surface of the implant at the mandibular left canine site, # 33iD: attached to the distal surface of the implant at the mandibular left canine site.
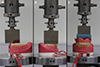
The vertical pressure applied to the mandibular denture as follows (Fig. 2); A: pressure on the mandibular right first molar region only, B: pressure on the mandibular right posterior area only, C: pressure on whole mandibular overdenture base.
And dentures were divided into the following three groups according to the length of the denture base as follows (Fig. 3); Group 1: pressure with no modification (intact denture), Group 2: pressure after eliminating the denture base distal to the mandibular second molar, Group 3: pressure after eliminating the denture base distal to the mandibular first molar.
Vertical pressure, 0.5 mm/min up to 50 N, was placed on the three types of complete denture, and this was repeated 10 times (Fig. 2).14 Whenever the attachment was replaced or the length of the denture base was modified, 20 minutes were given for recovery.
Results measured with the four strain gauges were analyzed statistically with the SPSS software (ver. 12.0 for Windows; SPSS Inc., Chicago, IL, USA). T-tests and one-way ANOVA tests were used, and Tukey's range test was also performed to confirm the results.
RESULTS
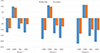
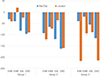
In strain measurements, a negative value indicates a compressive force and a positive value indicates a tensile force. To determine the statistical significance of the measured micro-deformation, means and standard deviations of the maximum micro-deformation rates of Groups 1 - 3 were determined (Table 1, Table 2 and Table 3); the mean values of the groups are given in Fig. 4, Fig.5 and Fig. 6.
T-tests and one-way ANOVA showed that the differences in strain between groups (Table 4, Table 5 and Table 6) were statistically significant (P < .05). These results were confirmed with the Tukey's range test.
In case of locator attachment, vertical pressure on the mandibular right first molar (A) and the mandibular right posterior area (B), the implants on the working side generally showed higher strain than those on the non-working side (Table 1, Table 2 and Table 3). Tensile force was observed on the mesial surface of the implant on the working side, and the compressive force was applied to the buccal surface and on the surfaces of the implant on the non-working side (Fig. 4 and Fig. 5).
In case of bar/clip attachment, the vertical pressure on the mandibular right first molar (A) and the mandibular right posterior area (B), the implants on the both non-working and working sides showed high strain (Table 1, Table 2 and Table 3); all surfaces except the mesial surface of the implant on the non-working side showed a compressive force (Fig. 4 and Fig. 5).
For the mandibular right first molar, the mandibular right posterior area, and the whole mandibular denture base, the strain was statistically significantly different between the locator attachment and the bar/clip attachment (Table 4). In addition, when applying vertical pressure at three different areas (cases A, B, and C), the bar/clip attachment generally showed a higher strain than the locator attachment (Fig. 4, Fig. 5 and Fig. 6).
For each attachment, the strain comparison between cases of applying vertical pressure at three different areas (A, B, and C) also showed a statistically significant difference (Table 5 and Table 6). For both attachments, the shorter denture base resulted in a higher strain on the implants (Fig. 4 and Fig. 5).
DISCUSSION
The design of implant overdentures to minimize the stress applied to the implants cannot be overemphasized. The present study showed that the stress tended to be larger and more concentrated with a bar/clip attachment than a locator attachment. These results are thought to be caused by the fact that the solitary type attachment allows the bending of the mandibular denture, and the same notion applies to the locator attachment. As in other reports,913151617181920 the ball attachment provided higher stability and this is probably because it distributes stress more evenly on both the left and right alveolar ridges. If the implants in a mandibular implant overdenture are not connected, the stress on the implants will be reduced. The use of splinted attachments, such as bar/clip attachments, seems to increase the stress regardless of the number of implants that are connected. Previous studies focused only on the minimization of stress applied to the implant and the surrounding tissues. If a mandibular implant overdenture lacks support or retention by the connection of the implant and the attachment, the stress on the implants will be minimized. Thus, for implant overdentures, stress on not only the implant but also the denture is delivered to the mucous membrane on the alveolar ridge.
There have been few studies on stress transfer related to the area of the denture base in implant overdentures. In one previous study, connecting four implants with a cantilever subjected the rearmost implant to high stress when there was no contact in the posterior edentulous region21; lowerlevel load transfer to the rear implant would be observed if the tissue was not stimulated in contact with the lower surface of the extension base.22 Based on these results, in the case of implant overdentures, the size of the denture base that covers the mucous membrane on the alveolar ridge is thought to have a great impact on the implant.
In addition, when using the bar/clip attachment with a rigid joint, the initial load is affected by the impression technique. A selective pressure impression technique is used to make the appearance of the fully expanded working model and the denture and its purpose is to distribute the load between the implant and the mucous membranes. Lack of extension of the denture base on the edentulous ridge leads to high stress at the rearmost implant on the same side as the cantilever.7 In addition, a widely supported mandibular implant overdenture delivers less stress to the attachment.4
Our results on the stress/strain pattern of the solitary and splinted attachments are similar to those of previous studies. The use of the locator attachment was found to exhibit lower strain on the implant than the use of the bar/clip attachment and it caused the stress to be concentrated on the load-taking implant. The level of strain deformation with the locator attachment was smaller than that with the bar/clip attachment, and this can be explained by the fact that the vertical pressure was absorbed by the deformation of the components of the locator attachment and the denture. This mechanism seems to minimize the stresses transmitted to the implant on the other side. The locator attachment is also considered to be helpful in relieving stress by allowing individual movement of the implant. However, the bar/clip attachment does not allow individual movement of the implant by the primary fixing effect. That is, the splinting of the two implants causes the stress to be transmitted to the implant that is not under load in terms of the bending moment.
It was also observed that maximum extension of the denture base reduced the strain on the implants. The vertical pressure is transmitted to the mucous membrane through the overdenture and the overdenture works like a snowshoe; thus, it decreases the stress per unit area that is applied to the implant. Based on these results, it can be concluded that the maximum extension of the denture base provides a favorable prognosis for the implants.
This study had some limitations. The difference in strain values may be explained by the height of the locator attachment and the bar/clip attachment. This is because higher attachment leads to a larger bending force on the implants. In addition, the positions of the strain gauges on the implants were not exactly the same; thus, the positional differences appear to have prevented the precise measurement of the strain value. The size of the strain gauges used in the experiment was relatively large compared to the size of the implant, and it was difficult to place them in the same plane. Although the experimental model reproduces the oral mucosa, it is not the same with actual intraoral soft tissue. The thickness of the soft tissue differs among people, and even in the same person different regions have different thicknesses. Such changes in soft tissue thickness can increase or decrease the stress around the implant because the deformation of the denture base is affected by the underlying soft tissue.
Given that overload applied to the implant represents a large proportion of implant failure, clinicians should avoid stresses that are transmitted to the implant. It is unclear how much stress can be harmful to the implant, but stress on the implant should be minimized. Thus, denture impressions should be taken appropriately to produce a denture that covers the maximum area of the alveolar ridge. If the denture base is extended to the maximum and a solitary type attachment is used, the stress on the implant will be significantly reduced.
CONCLUSION
For mandibular implant overdentures, locator attachments result in lower strain on implants than do bar/clip attachments. Longer denture bases have the same effect. Therefore, to minimize the strain on implants in mandibular implant overdentures, this study may provide the clinical implication that the use of locator attachment would be more preferable in regard of strain on implants than bar /clip attachment, and the denture base needs to be extended as much as possible.


 XML Download