

 PDF
PDF ePub
ePub Citation
 Print
Print


INTRODUCTION
Since the introduction of the concept of osseointegration by Brånemark, dental treatment using implants has been commonly used, so a variety of methods for prosthetic restoration in edentulous patients have been tried.1 In the case of mandibule, more than 90% of survival rates have been reported in most studies on overdentures.2 And the choice for both the number of implants and the anchorage system is wide. In the case of maxilla, on the other hand, the success rate on overdentures was different depending on the observer and the observation period. It was reported that implant failure rates in maxillary overdenture were reported to be 30.4% by Engquist et al.,3 13.5% by Smedberg et al.,4 and 16% by Jemt et al.5. Hutton et al.6 reported that implant failure rate in the maxillary overdenture (27.6%) was nearly nine times higher than implant failure rate in the mandibular overdenture (3.3%). When comparing the maxillary bone with the mandibular bone, these results are associated with biomechanical factors and differences between the implant length and bone quality due to the anatomical limitations in the maxillary bone.3567 Nevertheless, Bergendal and Engquist7 reported that a properly planned maxillary overdenture can increase implant survival rate. Mericske-Stern et al.8 recommended to use four to six implants with diameter and length longer than 4.1 mm and 10 mm in the form of a fixed connection using a bar for maxillary overdentures.
The form of denture base also affects the load applied to implants. Palmqvist et al.9 reported that the form of denture base in overdenture acted as an important factor in the long-term maintenance of the implants. Je et al.10 evaluated photoelastic models of maxillary implant-supporting overdentures and reported that complete palatal coverage had advantage of the stress distribution around implant supporting bone. On the other hand, Zitzmann and Marinello11 said that commonly used overdenture using four or more implants in the maxillary bone was a horseshoe shape. Je et al.10 reported that the type of anchorage system had more impact on the load transmission of the implant than the presence of palatal coverage in denture base. There is a controversy due to a lack of research on the impact of denture base on the implant, therefore more studies about the impact of stress on the implant according to the presence of palate coverage is needed.
The choice of anchorage system in overdenture affects the retention and stability in dentures, as well as the load transmission on implant supporting bone.12 Many types of attachments, such as bar, ball and magnet are used. However, guidelines for the selection of appropriate attachments required for the denture retention and stability depending on the cases are insufficient. Locator (Zest Anchors Inc., Escondido, CA, USA) whose frequency of use has recently increased has low height due to modified forms including ball and socket form. Locator was intended for solitary use. But Moeller et al.13, Spyropoulou et al.14 and Oh et al.15 reported clinical cases using the Locator that was coupled with bar.
The purpose of this study was to compare the stress distribution of the implant, the superstructure and the implant supporting bone according to the anchorage system design and the palatal coverage type of the maxillary implant overdenture using the three-dimensional finite element analysis.
MATERIALS AND METHODS
Model for finite element analysis was composed of maxillary bone, four implants fixtures, bar attachment system and maxillary overdentures. Maxillary edentulous model (Nissin Dental Products Inc., Kyoto, Japan) was duplicated with plaster model and implants were placed in occlusal plane perpendicular to both sides of maxillary lateral incisors and the first premolar region. Transfer type impression was taken, model analogue was connected to impression copings, and master model was fabricated after silicone gum was applied around model analogue for ease of laboratory procedure. Resin pattern was made in the form of a bar on the master model, scanned and obtained a threedimensional model of the bar. The bar was obtained by milling titanium block based on finished design data, adjusted the bar to the master model and then conducted tapping in screw thread for mounting the Locator to equip the Locator. Maxillary overdenture was fabricated on the master model equipped with anchorage system using the conventional method. In the same way as the previous method, Hader bar and overdentures was fabricated.
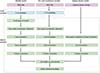
Because the shape of all models, except for the implant fixture was irregular and complex, 3D shape information recorded in the manufacturing process of the CAD-CAM was used for ease of finite element modeling. Each model was scanned using a 3D scanner and information about the geometry was recorded in the form of the IGES (Initial Graphics Exchange Specification) format. Using a 3D modeling program, the Pro/Engineer wildfire version 5.0 (Parametric Technology Co., Needham, MA, USA), the IGES file was converted to the 3D model and then the finite element modeling was performed using the ANSYS version 12.0 (Swanson Anylysis System Inc., Canonsburg, PA, USA) program. Finite element modeling of the implant fixture was performed by using the ANSYS program directly without 3D scanning (Fig. 1).
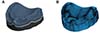
The cortical bone was set to be uniform thickness distribution of 1.5 mm. And the thickness of the mucosa was set to be 1.5 mm in the center of palatal region and 3.0 mm in the alveolar crest region.1617 In order to get the shape of the curve, virtual cutting of section at regular intervals was performed and extracted coordinates of a number of key points with information about the surface of each section. Using the finite element program, the ANSYS version 12.0, curve lines was formed from the key point coordinates and Area was formed from these curve lines. The final 3D model of maxilla was constructed by modeling portion to where the implant is inserted. Maxillary model was divided into three layers (gingival mucosal surface, cortical bone and trabecular bone) and the finite element model was constructed from this maxillary model (Fig. 2).
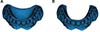
Because maxillary overdentures have very complex surface shape without the combination with implants, information about both coordinates of key points and curves was obtained by acquiring the IGES files obtained by 3D-scanning in the Pro/E, formed the surface and volume that were imported from the finite element program, the ANSYS and constructed finite element model. The surface combined with the mucosa of the maxillary region was to be shared and has to be connected with clip and Locator region without contact with bar. Between Bar and inner surface of the denture had 0.5 mm space. Maxillary overdentures were modeled with two types, the shape covering the full palatal region (F) and the horseshoe shape covering no palatal region (P) (Fig. 3).
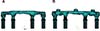
Implant fixtures and modeled by using the finite element program, the ANSYS on the basis of information about shape and dimensions that were provided by the manufacturer. The length and diameter of the implant fixture (internal connection type) modeled were 10 mm and 3.8 mm, respectively. Microthread was formed in the upper part. Implant fixture was modeled as a cylinder without taper. Four implants were placed in both lateral incisors and first premolar region in parallel (Fig. 4).
Two types of bar attachment system, Hader bar using clips (HBC) and Milled bar using Locator (MBL) were modeled. The clip and Locator were located in a total of three regions, a central part and two lateral parts. Information about coordinates of key points and curves was acquired by importing IGES format files formed by 3D scanning from the Pro/E as in the case of overdentures and then formed a 3D model by importing the information from the finite element program, the ANSYS. And the finite element model was completed by combining it with the four implant models that were previously modeled (Fig. 4).
The full finite element model combined with four partial models consisting of maxilla, bar attachment system, implants and overdentures was constructed. Because connecting part shares node, we formed elements of the same size and shape. The finite element models produced are as follows.
HBC-F : Hader bar using clips (HBC), the full palatal coverage (F)
HBC-P : Hader bar using clips (HBC), the partial palatal coverage (P)
MBL-F : Milled bar using Locator® (MBL), the full palatal coverage (F)
MBL-P : Milled bar using Locator® (MBL), the partial palatal coverage (P)
The sizes of element around implant, gingival mucosa and overdentures part, and cortical and trabecular bone were modeled to be 0.1 mm, 1-5 mm and 1-4 mm. Table 1 represents the number of nodes and the number of elements used in each model. Assuming linear elastic behavior, the elastic modulus of each component materials used in the finite element analysis and the Poisson's ratio using properties used in the previous studies were determined (Table 2).
For the finite element analysis, displacements of x, y and z direction in all the nodes on a section of maxillary bone enough away from implants was restrained. Static occlusal load of 100 N was applied onto the region corresponding to central fossa of left first molar in a direction perpendicular to the occlusal surface area in the same way as the other models. The load was evenly applied to the node included in circle area with 1.5 mm in diameter.
The ANSYS version 12.0 as the FE software was used for stress analysis. Type of stress calculated as a result of a three-dimensional finite element analysis includes component stress in each direction, directional principal-stress, shear stress, equivalent stress and so on. Stress analysis was performed based on the equivalent stress that better reflects the level of the stress. The equivalent stress is calculated by combining three vertical stress-components with direction and three shear stress-components and indicates the size of the full stress levels.
In order to identify both the distribution of the full stress and the concentration site of the maximum stress, the results were shown as equivalent stress contour, depending on the size of the stress based on the equivalent stress. The maximum equivalent stresses were compared at each site for each model using the implant itself, the interface between cortical and trabecular bone, and the superstructure.
RESULTS
In order to observe both the size of the full stress and the distribution status in each model, various colors by the size of the equivalent stress were used and observed regions were divided by experiment models to make a three-dimensional diagram. Maximal equivalent stress were compared and tabulated by dividing the experimental model.
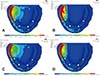
The stress distribution on the mucosal surface below overdentures was different depending on palatal coverage type. Without palatal coverage, a wider stress concentration region along the buccal slope of the rear ridge starting from the buccal ridge of the distal implant on loaded side were observed (Fig. 5). The maximum equivalent stress in MBL was higher than the maximum equivalent stress in HBC. And the maximum equivalent stress without palatal coverage was higher than the maximum equivalent stress with palatal coverage (Table 3).
The stress was found concentrated around the upper region of the rearmost implant on the load-side. And in the case of the left lateral incisor, the stress was concentrated on mesial side of the implant. The maximum equivalent stresses in HBC-F, HBC-P, MBL-F and MBL-P model were 28.31 MPa, 30.30 MPa, 44.12 MPa and 42.22 MPa, respectively. The maximum equivalent stress in the MBL model was higher than the maximum equivalent stress in the HBC model. For the HBC model, higher maximum equivalent stress was observed when covering no palate. On the other hand, for the MBL model, higher maximum equivalent stress was observed when covering the full palate (Table 3).
In trabecular bone, the stress concentration around the distal implant on loaded side was observed. And the maximum equivalent stress in the HBC model was higher than the maximum equivalent stress in the MBL model, as with the case of the cortical bone. For all models, the maximum equivalent stress was higher in the case of not covering the palate (Table 3).
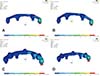
For stress distribution in the bar, the stress was concentrated at distobuccal side in the region connected to the distal implant on loaded side. And the maximum equivalent stress in the MBL model was higher than the maximum equivalent stress in the HBC model. For the MBL model, the maximum equivalent stress was higher in the case of not covering palate. On the other hand, for the HBC model, the maximum equivalent stress was higher in the case of palatal coverage (Fig. 6) (Table 3).
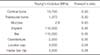
For the implant stress distribution, the stress was concentrated at the distal implant on loaded side. For the HBC-F model, the maximum equivalent stresses were 39.98 MPa in the first premolar on the left side starting from the distal implant on loaded side, followed by 7.65 MPa in left lateral incisor, 5.48 MPa in right lateral incisor and 1.83 MPa in the first premolar on the right side. And for the HBC-P model, the maximum equivalent stresses were 39.34 MPa in the first premolar on the left side starting from the distal implant on loaded side, followed by 9.43 MPa in left lateral incisor, 5.47 MPa in right lateral incisor and 2.23 MPa in the first premolar on the right side. In the case of not covering palate, the maximum equivalent stress was large in the left lateral incisor and the first premolar on the right side. But the maximum equivalent stress was small in the first premolar on the left side and the right lateral incisor. For the MBL-F model, the maximum equivalent stresses were 41.48 MPa in the first premolar on the left side starting from the rearmost implant on the load side, followed by 13.49 MPa in left lateral incisor, 9.19 MPa in right lateral incisor and 2.86 MPa in the first premolar on the right side. And for the MBL-P model, the maximum equivalent stresses were 49.08 MPa in the first premolar on the left side starting from the rearmost implant on the load side, followed by 16.31 MPa in left lateral incisor, 9.02 MPa in right lateral incisor and 2.95 MPa in the first premolar on the right side. So in the case of not covering palate, the maximum equivalent stress was high in all implant regions except for the right lateral incisor. And the maximum equivalent stress in the MBL model was higher than the maximum equivalent stress in the HBC model (Table 4).
DISCUSSION
Studying biomedical engineering can demonstrate the biomechanical characteristics of both implants and prosthesis and can be used to evaluate and quantify the stresses that were applied to implants and the strain of prosthetic components.18 In clinical settings, it is not possible to evaluate stress/strain distribution in implant-supported overdenture in the bone level but can evaluate the stress/strain distribution only at the level of abutment through the analysis of strain gauge.19 Methods based on virtual reality, such as photoelastic method20 and finite element analysis2122 can help us understand both the stress transmission and distribution from the implants to supporting tissues. However, these methods still do not provide both a full understanding of the overdenture stress analysis and a sufficient basis for conclusions about necessity of inter-implant fixation.23 In general, in order to attain biomechanical stability of implants in the implant overdentures, the load should be designed to be distributed properly, not to be excessively concentrated in a particular area. If excessive stress is applied to bone, bone resorption can occur. And if stress is applied to both the implant fixture and the upper-structure, screw loosening or fracture in the abutment, or fracture of joints in the upper structure, etc. can occur.24
In maxilla, trabecular bone is not dense and cortical bone is thin or rare. Thus, it is recommended to use an anchorage system connected by placing more than four implants instead of using solitary attachments in implant retained overdenture. And in the case where cannot be placed, it is recommended to increase the number of implants.8 Je et al.10 performed photoelastic stress analysis about the effect of both the anchorage system and the palatal coverage in denture on stress distribution inside implantsupporting bone and reported that the implant-supporting bone around the distal implant on loaded side had the highest stress, regardless of the type of the anchorage system and the presence of the palatal coverage. In addition, it was reported that the concentration of load on implants can be reduced when using resilient attachment where the load could be distributed to residual alveolar ridge or palatal region and that the smaller the amount of rear cantilever of the implants had the better results. In this study, the highest stress appeared in the joint between bar and implants but not in supporting bone. However, according to comparison results of implant supporting bones, the distal implant on loaded side caused the highest stress. And the results matched each other. And in the case of not covering palate, it was known that stresses applied to both alveolar bone around the implants and mucosa were high, which was in consistent with the research results by Je et al.10. For stress distribution according to anchorage system, the stress applied to implant fixture in the MBL model was higher than the stress applied to implant fixture in the HBC model. It was suggested that the volume of the Milled bar was larger than the volume of the Hader bar due to the effect of the shape of the bar and that the stress was delivered to the bar better due to more firm attachment to overdentures. As a result, for stress concentrated in the bone around the implant fixture, the stress when using the Milled bar was larger than the stress when using the Hader bar. On the other hand, if the Hader bar was used, the stresses that were applied to the gingival mucosa appeared to be larger and the stresses that were applied to both implant fixture and supporting bone appeared to be smaller. The use of the Hader bar was shown to be more favorable in order to attain the effective stress distribution.
Jemt et al.25 reported that occlusal forces in overdenture patients were 48 - 258 N (an average of 128 N). And Mericske-Stern et al.26 reported that the occlusal forces in overdenture patients were 50 - 250 N. Siegele and Soltesz27 set the load applied to the implants to be a vertical force of 100N and a horizontal force of 25 N, 25% of the vertical force. And many other researchers28293031 set the vertical force and the horizontal force to be 100 - 300 N and about 1/4 of the vertical force, respectively to perform the study. Skalak28 reported that the size of the load affects the size of stress, but that there was no effect of the size of the load on the distribution of the stress. In this study, a vertical force of 100 N that was perpendicular to the occlusal plane was applied to the central groove of the first molar on the operation-side and excluded the horizontal force from the study.
In the study of a three-dimensional finite element analysis that assessed the effect of the direction of the load on the implants, high stresses occurred mainly in alveolar crest.32 The stress concentration when exposed to lateral force was greater than the stress concentration when exposed to vertical force. And if the load was applied to the cantilever, most stresses were concentrated on the implant neck close to both the joints of the prosthesis and the cantilever.3334 White35 reported that if the load was applied to the front portion of the implant even in the presence of the cantilever, the stresses were distributed the portion and were delivered to other parts infrequently. And he reported that if the load was applied to the cantilever, the stresses were concentrated in the distal alveolar region of the implants closest to the cantilever. In this study, the superstructure in the form of the cantilever was not designed. But the implants were biased to the front in maxillary overdenture. And the load position existed at the rear of the load. So it can be considered that the cantilever effect has occurred. For the distribution of stresses, the stresses were concentrated on the joint between the rearmost implants on the load-side and bar. These results were similar to the study results. If the clips cannot be placed due to the narrowing of the distance between the anterior implants in overdenture using both the Hader bar and the clips, the clips then can be by extending the bar to the distal rearmost implants. At this time, the cantilever action occurs. The closer to mesial region the clips are located, the smaller the amount of catilever action occurs. So this will be more favorable for the stress distribution.36 Thus, it can be thought that we need to study the difference in the stress distribution according to both the position of the load and the presence of the cantilever in the superstructure.
Additional support for the palatal mucosa is not normally recommended for maxillary overdentures supported by four implants that were successfully placed.37 However, it was reported that covering palatal mucosa provides both additional support and stability for the maxillary overdenture.38 Ochiai et al.39 and Je et al.10 performed photoelastic analysis and reported that palatal coverage in maxillary implant overdentures was advantageous to the stress distribution. In this study, the stress distributions were also compared according to the presence of palatal coverage using a three-dimensional finite element analysis. And it was found that when palatal region was covered regardless of the type of anchorage system, the stresses applied to bone around the implant fixture was decreased. This was interpreted as the results of a certain amount of dispersion of the stresses caused by the load in the palatal. In the case of not covering palatal region in the HBC model, the stress was high in both left lateral incisor and right first premolar implant part. But the stress was rather low in both the implant on load side, left first premolar and lateral incisor. However, the difference was not large. And increase in the overall stress of the implant was observed when not covering palatal region. If the palatal coverage was not performed in the MBL model, the stresses in all implants with the exception of the right lateral incisor were found to be large. And the differences were larger than that in the Hader bar. It was found that palatal coverage had more effect in the Hader bar than in the Milled bar. As the results of the biomechanical analysis, it was suggested that in the maxillary implant overdentures, by covering palatal region, the stress concentration on the implant can be reduced, helping maintain the supporting bone around the implant.
Because the results of this study was suggested under the condition that both implant fixture and bar were firmly connected as one structure, it could not be analyzed the stresses applied to internal joints or superstructure in the implants when observing abutment screw or the internal joints between the abutment and the internal implants. Until now, there has been no research that reproduced the stress that occurred when applying torque to the abutment screw and connecting it to the fixture using the threedimensional finite element method.40 In order to study a variety of problems occurring in clinical circumstances, such as implant abutment screw loosening and fracture and the fracture of superstructure, we need to perform additional studies through a detailed modeling on the joint.
CONCLUSION
In order to investigate the effect of both bar attachment system (Hader bar using clips, Milled bar using Locator) and palatal coverage in denture on the stress transmission for creating the maxillary overdenture using four implants that were placed in edentulous maxillary anterior space, we compared the types of stress distribution in the bar attachment system, implants, implant supporting bone and mucosa during unilateral loading on the first molar by using the three-dimensional finite element analysis. The following conclusions were drawn from the conditions above. As in all models, the highest stress occurred in the buccal distal joints between the bar and the rearmost implant fixture on the load side. For the supporting bone in implant fixture, the highest stress occurred in the distal buccal cortical bone of the rearmost implant on the load side. The bar, the implant fixture and cortical bone in the MBL model had higher stress than the bar, the implant fixture and cortical bone in the HBC model. But mucosa and trabecular bone in the MBL model had lower stress than the mucosa and trabecular bone in the HBC model. When not covering palatal region with denture in all bar attachment systems, a higher stress occurred in the implant fixture. And the difference in size of the stress that occurred in implant fixture according to the presence of the palatal coverage was larger in the MBL model than in the HBC model.
Through the results above, it was found that the if you used the Hader bar rather than the Milled bar and produced denture in the form of the entire palatal coverage for creating implant overdenture in the maxilla, it could be more advantageous for the distribution of stresses that were applied to supporting bone around implants.


 XML Download