

 PDF
PDF ePub
ePub Citation
 Print
Print


INTRODUCTION
Dental implant and conventional fixed dental prosthesis (CFDP) are the most representative treatment methods for restoring a missing tooth. Patients and dental clinicians are inclined to favor implant over the CFDP because implant allows restoration of the edentulous area without damaging the teeth adjacent to it.1
Due to lack of the clinical trials aimed to compare the implants with CFDPs over a long time period, it is unclear whether implants are more effective than the CFDPs. However, it is normally believed that the implant brings a higher cost and takes a longer time than the CFDP. In order to address this matter, studies using cost-effectiveness analysis have been conducted recently. These studies provided considerable information for the clinical decision-making process. During this process, complex factors such as cost, survival rate, complications, and patient satisfaction should be considered in order to select the most appropriate treatment method.2
Previous studies by Pennington et al.3 and Kim and Solomon4 dealt with comparisons among the root canal therapy (RCT), the implant, and the CFDP from a cost-effectiveness perspective, but they did not present the criteria of treatment selection for restoration of edentulous area as a single treatment perspective. Bouchard et al.5 adopted various 4-step treatment strategies for comparison, including the use of the implant, the fixed dental prosthesis (FDP), or the removable dental prosthesis (RDP) as a subsequent treatment in case of failure in implant or CFDP. Aforementioned studies did not consider complex aspects of patient satisfaction or quality of life. Because CFDPs and implants were not analyzed as single treatments in most of the cost-effectiveness analysis studies, the information obtained from these studies did not directly facilitate the selection of treatment methods for restoration of edentulous area. Cicciù et al.67 reported that the survival rate of screw-retained prostheses was higher than that of cemented-retained prostheses; the survival rate of cemented-retained prostheses was 98.4% with an average of 34.7 months follow-up, and the survival rate of screw-retained prostheses was 100% with an average of 44.3 months follow-up. Considering the cost aspect, prosthetic components used for cemented-retained implant are generally cheaper than those for screw-retained implant, since the fabrication of cemented-retained prostheses is easier.
Since no studies have compared the cost-effectiveness of implant and CFDP in Korea, the purpose of this study was to conduct a cost-effectiveness analysis of implant and CFDP from a single treatment perspective, using data from Korean Dental Hospital and Statistics Korea. For each treatment method, factors such as initial cost, treatment costs of complications, survival rate, complications rate, and patient satisfaction were comprehensively considered by the Markov model over 50 years. We also investigated how much more the patients were willing to pay per 1 quality-adjusted prosthesis year (QAPY) for the implant strategy in comparison with the CFDP strategy over the years after prosthodontic treatment. Average management costs and incidence rates of the aesthetic, technical, and biological complications were investigated. Through the analysis, the expected cost and the quality-adjusted prosthesis expectancy (QAPE)8 of each treatment method were calculated to enable a comparison of the cost-effectiveness between the two treatment methods. In this study, a survey-based QAPY was introduced, and the QAPE was obtained thereafter.
MATERIALS AND METHODS
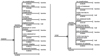
The Markov model implemented in the TreeAge, a decision-tree analysis software (TreeAge Pro 2011; TreeAge Software Inc., Williamstown, MA, USA), was used as the cost-effectiveness analysis model. It was often adopted to analyze the discrete-time events recurring over time. This model, which was also used in medical research, tracked the changes in cost and effectiveness associated with transitions from one state to another during cycles. Each transition between states was evaluated based on transition probability. 9 In Fig. 1, the Markov model used for our cost-effectiveness analysis was depicted. For instance, with implant as the initial state, the transition probability to the 'survive' state was 0.9944, and the transition probability to no complications in the 'survive' state was 0.9223. The transition probability was an incidence rate and could be considered independent of cycle length. Each complication was treated, thus cost was paid and subsequent effectiveness was obtained. In this study, the starting point of the Markov model was designated as the moment when the tooth was lost. The ending point was assigned to be when the restoration state could no longer be sustained by the abutment loss of implant or CFDP. The Markov model for each selection was independently run.
The results from meta-analysis studies were used to determine the survival rates and complication rates of the implant and CFDP. The incidence rate of each complication was adopted from Jung et al.10 for implant and from Pjetursson et al.11 for CFDP. Other studies also reported similar incidence rates of complications. Aesthetic, technical, and biological complications that occurred by the incidence rates were observed over a cycle length, which was taken as one year. The model was built based on the accumulation of the treatment costs and incidence rates associated with each of these complications.
The maximum of the analysis duration for the Markov model was set as 50 years. The annual discount rate (r = 0.03) was applied to the model in the cost-effectiveness analysis. Generally, the discount rate refers to a case in which the future values are lower than the present ones.12
A cost was incurred when the implant was inserted in the edentulous area, and the probabilistic bifurcation to either the 'survive' state or the 'fail' state of the implant occurred thereafter. The probabilistic incidence of each complication took place in the 'survive' state, and the Markov model ended in the 'fail' state. When a complication occurred, corresponding cost for the treatment of the complication was incurred. If no complication occurred, the 1-year period passed without an additional treatment cost. As the Markov model ran over 50 cycles, cumulative cost of each treatment method was calculated with discount rate. Data regarding the average cost of initial treatment and complication management for the implant and CFDP were collected from the electronic medical records (EMR) of outpatients at Chonnam National University Dental Hospital for the entire year of 2013.
The total cost in this study was the cost including both the direct and indirect cost. The direct cost included initial treatment cost and complication management costs, and indirect cost included transportation cost and hourly labor compensation cost spent on the treatment or complications management. For the initial treatment cost of the implant, the cost differences related to various treatment items such as bone graft, first/second implant surgeries, and implant materials were taken into account for the calculation. For the initial treatment cost of CFDP, the cost differences related to materials, such as the gold crown or porcelain fused to a metal crown, were considered for the calculation. To calculate the diversity of treatment costs for each complication, claim frequencies regarding the used materials, the treatment method, and the type of clinician - generalists or specialists - were weighted. The average cost of each treatment was calculated from these weights. For the indirect cost, the transportation cost was set as the number of visits multiplied by the bus ticket price for a round trip, and the labor compensation cost was set as the time required for a treatment or a complication management multiplied by average hourly wage by age and by employment rate by age. The hourly wage and employment rate differed for each age group. The data was investigated from Statistics Korea.
The quality-adjusted prosthesis year (QAPY)8 is derived from the quality-adjusted life year (QALY), which is used for cost-effectiveness analysis in medical studies. Like the QALY, the QAPY can have values between '0,' a missing tooth, and '1,' a prosthesis remaining in perfect status over one year. Any artificial tooth that has had the prosthodontic treatment is given a value between 0 and 1 for the QAPY, depending on its quality of prosthetic status. In this study, the QAPY was newly defined according to the function, phonation, and aesthetics. These three items were evaluated based on the survey of patient satisfaction13 (Table 1). The QAPY defined in this study took diverse aspects of effectiveness into consideration such as above three items14 - due to the increased significance of physical appearance today. The range of scores representing the degree of patient satisfaction for each item was from 1 (minimum) to 5 (maximum), and equal weights were assigned to the three items.
The QAPYs of the implant, the CFDP, and the missing tooth were individually calculated. The QAPYs of the implant and the CFDP were adjusted by the QAPY of the missing tooth. The adjusted QAPYs of the implant and the CFDP were obtained as follows:
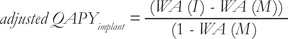
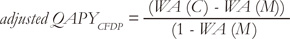
where WA (I), WA (C), and WA (M) were QAPYs calculated without adjustment for the implant, for the CFDP, and for the missing tooth, respectively (Table 1). Because the results of the patient satisfaction survey were obtained without considering the complication type, identical QAPY was taken into account regardless of the type of complication. Similar to the quality-adjusted life expectancy (QALE), quality-adjusted prosthesis expectancy (QAPE) was evaluated by the average obtained from cumulative QAPY with the annual discount rate in the current study. QAPE was used to reflect effectiveness (Fig. 2B). For instance, if no complications are observed in the first year, the first QAPY becomes the QAPE. When soft tissue complications occurred in the second year, the second QAPY was added to the QAPE in the first year. This process was continued over 50 cycles. The kinds of complications and corresponding treatment methods and direct and indirect costs of implant and CFDP were investigated in Table 2.
A cost-effectiveness ratio is derived by dividing the cost by the effectiveness.15 Two cost-effectiveness ratios were calculated in the current study by dividing the cost associated with each strategy by the QAPE associated with each strategy. For any strategy, a lower cost-effectiveness ratio indicates that the treatment strategy is more cost-effective. A 'dominant' strategy indicates that the particular strategy has a relatively lower cost and higher effectiveness compared to other strategies.12
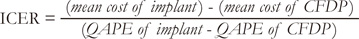
Cost-effectiveness was assessed through the calculation of incremental cost-effectiveness ratios (ICERs), that is, the ratio of differences in mean costs between the treatment A (implant) and the treatment B (CFDP) to the differences in mean effects between the treatment A and the treatment B. Treatment and management costs were estimated in 2013 Korean won (US $1.00 = KRW 1,095 won on average).
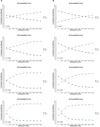
Sensitivity analysis determines how sensitive a dependent variable is to any change in the independent variable when uncertain variables exist in a given analysis model.16 This sensitivity analysis provides the degree of validity of the results from the analysis model. In the current study, the sensitivity analysis was performed by the Monte-Carlo simulations. The Monte-Carlo simulation is used when the parameters in a decision analysis model are defined as a probability distribution.16 The process of calculating the outcome after choosing an arbitrary value from each parameter defined as the probability distribution was carried out repeatedly. From this, the outcome values were expressed as the distribution, and the confidence ellipses were obtained. Cost-effectiveness acceptability curves (CEAC) were presented as a decision-making approach for summarizing information on uncertainty in cost-effectiveness, using incremental cost-effectiveness scatter plots of the bootstrapped incremental costs and effect pairs for implant versus CFDP (Fig. 2).
RESULTS
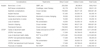
The initial direct cost of implant was higher than that of the CFDP: 1,339,170 ± 292,114 won for the implant vs. 1,292,960 ± 378,378 won for the CFDP, with their difference being within 10%. The total initial cost of implant was also higher than that of the CFDP: 1,689,221.6 ± 292,114 won for the implant vs. 1,358,208.12 ± 378,378 won for the CFDP. The difference of total initial costs became bigger than that of the initial direct costs between the implant and the CFDP. The cumulative direct cost of the implant and the cumulative direct cost of the CFDP had one point of intersection at the 10th year (Figure not shown). In spite of the higher initial direct cost of the implant, the cumulative direct cost of the implant was seen lower with non-significant trend from the 10th year since the prosthodontic treatment, due to relatively low cost for the treatment of the complications of implants. The cumulative total cost of the implant including indirect cost became closer to that of the CFDP as time passed, but two curves did not meet each other for 50 years after prosthodontic treatment.
Whereas a total of 10 visits to the hospital were needed for implants, an average of 2 visits was needed for CFDPs. In order to calculate the indirect cost for implants and CFDPs, the factors including transportation cost, hourly labor compensation cost, and time for both the transportation and treatment were calculated and considered. For implants, the transportation cost for the 10 visits was 24,000 won, while for CFDPs, the transportation cost for the 2 visits was 4,800 won. For both implants and CFDPs, the average hourly wage was 15,085 won, the employment rate of Gwangju was 0.57, and the total time required for transportation and treatment was 4 hours. Average management costs of the complications was investigated in Table 2.
The implant showed high satisfaction outcomes in all categories: aesthetics, function, and phonation (WA(I)=0.9707). On the other hand, the CFDP showed outcomes of lower satisfaction (WA(C)=0.8240) than the implant. However, since the level of satisfaction in patients with a missing tooth (WA(M)=0.6613) was higher than anticipated, the QAPYCFDP value that was converted based on the WA(M) appeared to be lower than expected. The adjusted QAPYs of the implant and the CFDP were obtained as follows:
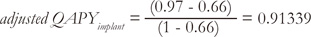
since 1 - 0.66 corresponds to 1 - 0. The QAPY of the transitions to 'Fail' state (missing tooth) over a year was set to 0 for both treatment methods. Accordingly, the difference between the QAPY values of the implant and CFDP was increased by such adjustments (Table 1). The QAPY value was higher for the implant than the CFDP, and the QAPE values were also higher for the implant than for the CFDP for the entire duration. Besides, the QAPE of the implant was more rapidly increased than that of the CFDP.
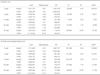
When only the direct cost was considered, the ICER was 194,437 won per QAPY at 0 year after prosthodontic treatment, indicating that the cost for the implant strategy needed an average of 194,437 won more than the CFDP strategy per 1 QAPY. However, after ten years, the CFDP strategy needed on average 1,287 won more per 1 QAPY compared to the implant strategy. However, when the indirect cost was considered along with the direct cost, the difference between the implant and CFDP strategy increased. At 0 year after prosthodontic treatment, the cost for the implant strategy needed an average of 746,665 won per 1 QAPY more than the CFDP strategy. After 50 years, the implant strategy needed 11,784 won more per 1 QAPY than the CFDP strategy. The implant strategy led to an increase in expected 4.23 QAPY over a time of 10 years, 7.19 QAPY over a time of 20 years, and 12.63 QAPY over a time of 50 years (Table 3).
The CEACs for the comparison between Implant and CFDP in Fig. 2 were depicted at the 5th year, the 10th year, the 20th year, and the 50th year after the prosthodontic treatment. When only direct cost was considered, there was a 56% probability that CFDP was more cost-effective than implant with no willingness to pay (WTP) per QAPY gained at the 5th year after the prosthodontic treatment. The proability of being more cost-effective than CFDP with a WTP of 40,000 won and 80,000 won was 53% and 59%, respectively, for the implant. The implant strategy was more cost-effective than the CFDP strategy in the range of WTP ≥ 10,000 won at the 10th year from the prosthodontic treatment. There were higher probabilities of implant strategy being more cost-effective than CFDP, irrespective of a decision maker's willingness to pay per an additional QAPY from 20 years after the prosthodontic treatment.
When a total cost including indirect cost was considered, the CFDP strategy was more cost-effective than the implant strategy up to WTP of 75,000 won, while the implant strategy was more cost-effective than the CFDP strategy from WTP of 75,000 won at the 10th year after the prosthodontic treatment. At the 20th year after prosthodontic treatment, the proportion of point was a 55% probability that implant was more cost-effective than CFDP at WTP of 40,000 won. While the probability of implant being more cost-effective increased as the WTP increased, the probability of CFDP being more cost-effective decreased as the WTP increased.
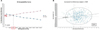
Fig. 3B shows the scatter plot of the bootstrapped incremental cost and incremental effectiveness (QAPY) pairs for Implant versus CFDP. The majority of the scatter points are located in the north-east quadrant of the cost-effectiveness plane, indicating that implant is associated with higher total costs (above the x-axis) and better effects than CFDP. The dashed line denotes the threshold of 40,000 won per QAPY. At a willingness to pay of 40,000 won, the implant is likely more cost-effective with the probability of 0.53 at the 5th year.
DISCUSSION
The purpose of this study was to conduct a cost-effectiveness analysis of the implant and CFDP from a single treatment perspective. When only the direct cost was considered, from the 20th year after the prosthodontic treatment, implant was shown to be more cost-effective regardless of the WTP. Moreover, at the 5th year after the prosthodontic treatment, implants were more cost-effective when the WTP was more than 35,000 won, and at the 10th year after the treatment, implants were more cost-effective when the WTP was more than 10,000 won. However, when the indirect cost was added to the direct cost, implants were more cost-effective only when the WTP was more than 75,000 won at the 10th year after the prosthodontic treatment and more than 35,000 won at the 20th year after the prosthodontic treatment.
The initial and complication treatment costs in this study were the treatment costs averaged over the generalist and the specialist group. The results of the cost-effectiveness analysis based on disparate treatment costs of the generalist and the specialist did not demonstrate any significant differences in the results of this study; therefore, the average treatment cost was used in this study.
The cumulative direct cost of the implant was lower than that of the CFDP after the 10th years of the prosthodontic treatment. Although the initial direct treatment cost of an implant was slightly higher than that of a CFDP, overall direct treatment cost of the CFDP became higher because of the relatively higher complication treatment cost of the CFDP. The effectiveness of the implant was confirmed to be superior over the entire duration. The implant strategy was considered more "dominant" in the cost-effectiveness than the CFDP strategy after the 10th year after the prosthodontic treatment, when only the direct cost was considered. This finding was consistent with the results of the previous cost-effectiveness studies,35 which showed that implants are more cost-effective compared to CFDPs due to implants' cost-effectiveness ratio being lower than CFDPs'.
Cicciù et al.67 reported long term success rates of more than 98%, which is similar to the result of the present study. Bouchard et al.5 used the survival rate only to assess effectiveness, while the current study reflected on the aspects of patient satisfaction on their quality of life. Unlike the present study, Bouchard et al.5 did not find the CEAC. Through drawing the results for CEAC, the present study has illustrated the relation between the WTP and proportion of cost-effectiveness. From these CEACs, one can know that implants are more cost-effective with a lower amount of WTP when the direct cost was the only cost being considered. However, when the total cost was considered, implant strategy was more cost-effective with a higher amount of WTP.
Since the treatment costs of private dental clinics might show significant variations, all treatment costs were calculated using the medical records of a major university dental hospital in order to increase the study reliability. A cost-effectiveness analysis with another university-level dental hospital in a different region might be necessary to consider the regional cost differences. It is believed that the information based on patient satisfaction can assist dental clinicians and patients in making reasonable choices in the clinical decision-making process for restoration of a missing tooth.
The study by Kim and Solomon4, in which the cost-effectiveness analysis of RCT, implant, and CFDP were performed, indicated that the CFDP is more cost-effective than the implant, which was consistent with our findings of the total cost including indirect cost. In terms of the total cost, due to the large number of visits implant strategy required, CFDPs was calculated to be more cost-effective. However, in the future, the results might change so that implants might be more cost-effective, since a decrease of the cost-effectiveness ratio for the implant can be expected when future factors (i.e., reduction in treatment costs and increase in patient preference due to advancements in dental implants and management skills) are considered.
Within the limitation of this study, a criterion for WTP threshold was arbitrarily used due to the lack of previous research on the WTP threshold in Korea, and the result could be interpreted according to this criterion. However, this study's pattern will remain consistent regardless of the new WTP threshold.
CONCLUSION
The implant could be considered the dominant treatment strategy from the 10th years after the prosthodontic treatment when indirect cost was not considered. When indirect cost was added to the direct cost, CFDP was more cost-effective unless the WTP was more than 75,000 won at the 10th year after the prosthodontic treatment. However, the tendency of being more cost-effective changed from CFDP to implant as time passed.

 XML Download