

 PDF
PDF ePub
ePub Citation
 Print
Print


INTRODUCTION
Lithium disilicate ceramic promises esthetic, minimally invasive restorations. It is available for CAD/CAM application as well as for a classical lost-wax technique with a heat-pressed ceramic. Both seem to show equal clinical performance. 1 Especially the monolithic design is expected to reduce the susceptibility for chipping, which is known to be high in zirconia-cored and feldspathic veneered restorations. 2 Thereby the indication and reported application of the material cover all kinds of single tooth restorations from inlays and partial crowns, up to full mouth rehabilitation in patients suffering from massive erosion or amelogenesis imperfecta.345 An adhesive or a conventional luting is applicable for crowns made from lithium disilicate.6789 When crowns are adhesively bonded, fracture strength of the restoration increases even if the bonding is compromised by aging through physicochemical conditions of the oral cavity over time.101112 Generally, the usage of a resin cement is advised for all ceramic restorations.913
In a recent systematic review, Pieger et al. identified eight clinical studies about lithium disilicate coping up to ten years.14 To estimate clinical survival, collectively 326.5 crowns were assessed in a mean observation interval of 3 years. All these crowns were cemented with self-adhesive resin cement or resin-modified glass ionomer cement. Furthermore, only three of these studies investigated the heat pressed lithium-disilicate "e.max press" (which has a higher Weibull Modulus than the former "Empress 2"; both Ivoclar-Vivadent, Schaan, Principality of Liechtenstein).15 Two out of these three studies included monolithic crowns. Although luted crowns made from e.max press has been introduced to the market over 10 years ago, the published clinical evidence is still rare. Such data is needed to validate indications and enable the dentists to decide the clinical application and cementation mode for their treatments.1617
The evaluation of a clinical follow-up shall disclose adverse events regarding technical complications and biological integrity. This allows the estimation of the short-term performance. Furthermore, these observations should reveal information about the clinical outcome as well as risk factors and limitations of indication for such single tooth restorations.
MATERIALS AND METHODS
Besides metal-based restorations, patients was offered a metal-free alternative with pressed lithium-disilicate crowns, as far as a paragingival or slight subgingival preparation design was applicable to enable an adhesive protocol for crown delivery. No further inclusion or exclusion criteria were set. The treatment followed a standard operating protocol (SOP) of the Department, which encompasses the following demands: (1) tooth preparation is performed according to all ceramic standards (2) circular chamfer of 0.8 mm and at least 1 mm of occlusal reduction. Root canal treated teeth were provided either with Cosmopost (Ivoclar Vivadent) or Rebilda Post (Voco, Cuxhaven, Germany). Impressions were taken with polyether materials in double mixing technique (Impregum Penta & Permadyne Garant, both 3M ESPE, Seefeld, Germany). Temporaries were fabricated chairside with ProTemp (3M ESPE, Seefeld, Germany) using a thermoplastic moulding. Temporaries were luted with eugenol-free cement, preferably Temp Bond NE (Kerr Corp., Romulus, MI, USA) or otherwise Dycal (Dentsply DeTrey, Konstanz, Germany). Crowns were luted preferably with the composite resin "Multilink Automix" or otherwise with "Variolink" (both Ivoclar-Vivadent) according to the manufacturers' protocols. If neither of these protocols were clinically possible, crowns were luted with the resin cement RelyX Unicem (3M ESPE).
The crowns were manufactured by trained dental technicians, who are experienced with the e.max-ceramic system (Ivoclar Vivadent). The dental labs were officially contracted to the Department of Prosthodontics.
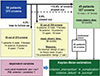
With respect to esthetics, only the anteriors were veneered at the buccal surface using the feldspathic ceramic 'e.max ceram' (Ivoclar-Vivadent). All treated patients got regular dental check-ups including quality assessment according to the modified CDA-criteria.181920 Figure 1 shows the modified CONSORT diagram of the treated and evaluated cohort. Within a cohort of 58 patients, 32 crowns did not match the clinical standard of single tooth crowns for preparation, blocking or luting (Fig. 1, Table 1). All but 20 restorations were luted with Multilink Automix (Ivoclar-Vivadent) according to the manufacturer's protocol. The 20 crowns (in 2 patients) were bonded with Variolink using Syntac and Adhesive (all Ivoclar-Vivadent).
Beside quality evaluation according to the modified CDA-criteria, all observed events were classified as either a complication or a failure (Table 2).182021 For time to event analysis, the Kaplan-Meier-Method was applied.22 The first date of any adverse event calling for intervention compromises the "complication rate" and the date of an observed failure compromises the "survival rate" (Table 2). The rates are determined at 24 and 48 months, including their 95% confident interval borders. As the number of observed crowns in each patient differs widely, a randomized sample of one crown out of each patient was drawn to make the overall estimation.23 Therefore, the random integer function was applied and the distribution was tested not to be significantly different from cohort's distribution regarding both the anterior and posterior region. Finally the arithmetical average was calculated for Kaplan-Meier estimations. Complication rates were estimated for crowns regarding two dependent variables: root canal treatment (yes/no) and position of the crown (anterior/posterior). Differences between the dependent variables were calculated via Log-Rank test using a 5% level of significance. All datasets were entered and calculated with JMP 11 statistical package (SAS Institute, Cary, NC, USA).
RESULTS
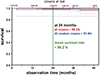
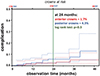
During a mean observation time of 30 months (median = 28 months, SD = 11.6), 7 (4 male, 3 female) out of 58 patients did not show up for dental examination follow-up. With these patients, 4.3% of all restorations (16 crowns) were 'lost to follow-up'. Furthermore, 6 patients with 32 crowns were closed out because of certain clinical situations and thereby deviation from the consented treatment SOP (Fig. 1, Table 1). The total of 327 single crowns in 45 patients were observed and included to evaluation. The number of crowns a patient had ranges of 1 (n = 14 patients), 2 to 4 (n = 12), 5 to 13 (n = 9), and 14 to 28 (n = 10). The restorations were checked at least once after insertion; 27 patients showed up at least two times; 13 patients, three and more times (Table 3). The restorations were distributed within the jaws as shown in Fig. 2. Following events were observed and classified as failures: three crown fractures after 34, 40 and 51 months (patient#67/ FDI = 22; #34/45, #5/11; #67/22), a root-canal treated tooth fractured horizontally (#13/31), a mandibular left first molar (#59) needing root canal treatment, and two patients (#17/13, #34/37) with caries at the margin. These events revealed an estimated survival rate average of 98.2% at 24 months and 96.8% at 48 months (Fig. 3).
Beside these failures, further complications had to be handled: three crowns showing loss of retention in two patients (#42/27,47; #5/11) were rebonded with Multilink automix (Ivoclar-Vivadent). Five chip-offs were detected in five patients, affecting a left maxillary lateral incisor, a left maxillary canine (incisal-buccal surface), an upper left second premolar (distal part of the buccal cusp), an upper right second premolar (mesial marginal ridge), and an upper left second molar (distal marginal ridge).
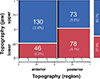
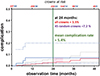
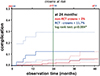
In summary, the prevalence of complication and failure was 4.6% (15 events on 14 out of 327 crowns) affecting 11 patients (24%). The complication rate is estimated on average 5.4% at 24 months and 7.1% for 48 months (Fig. 4). Regarding the dependent variable of topography within a jaw, no significant difference could be detected between the overall complication rate of anterior and posterior crowns (Fig. 5). If the status of root canal treatment was to be taken into account, the complication rate of root filled crowns was significantly higher (P < .01) than for vital abutment teeth (Fig. 6).
The quality of the crowns throughout the whole observation time is shown in Table 3.
This distribution shows a high proportion (over 90%) of excellent ratings (Alfa) for color, marginal fit, and caries. At the last observation date, the distribution of overall CDA-ratings was 90% (n = 294) Romeo, 7% (n = 23) Sierra, 1.5% (n = 5) Tango, 1.5% (n = 5) Victor.
DISCUSSION
The 327 lithium disilicate crowns evaluated in this clinical follow-up is comparable to the 382 crowns at risk after 2 years, reported in a recent systematic review.14 However, only Only 45 patients accounted for the presented data. This is the reason the overall survival estimation of all crowns in all patients was extended by a set of randomly drawn 45 crowns (one out of each patient).23 This cohort had sufficient observation time and could be regarded as a "validation" of the overall estimation. Thus, the average of both estimations within the 95% confident interval gives a reliable value of survival and complication rate. However, every fourth patient was affected by an event calling for clinical intervention.
The distribution and qualitative analysis of the observed events showed the importance of careful patient selection and clinical handling, especially in complex cases: 6 out of 14 affected restorations were provided in four patients by the same dentist (treating a total of five patients with 26 restorations). This indicates an operator bias with a factor for technical sensitivity of the system and approach.24 Two out of three debondings were observed in one patient, who received 21 restorations within one treatment session. The other debonding occurred in a patient who got treatments on all upper anteriors. The three debondings in 327 crowns (<1%) are below the luting failures in conventional fixed restorations (2%),25 and in line with the prevalence in adhesively bonded all ceramic crowns.726 Therefore it was not evident that monolithic crowns were more susceptible to retention loss, as concluded by Lekesiz.10 The caries at the crown margin was found in patient #17 at the palatal side of the upper left canine from a preceding Bravo-rating of the margin. This patient received 28 crowns within one session and the dentist reported a mistake while luting the crown at the upper left canine, resulting in the penetrable marginal gap. Even though monolithic crowns are not likely to chip, minor ceramic fractures were observed in areas of high load and less tooth support (especially on marginal ridges) on 3 out of 151 posterior monolithic crowns (2%). The previously reported prevalences of such chip-offs in monolithic posteriors were 1.3% by Fabbri and colleagues and 1% by Cortellini and Canale.527 Nevertheless, the prevalence of chip-off in monolithic crowns is still below chipping in Zirconia crowns.28 Fractures of frameworks were rare (0.9% prevalence) and were observed as late complications (on average after 41 months). This was comparable to the prevalence of 0.6% reported in the systematic review14 but different from the reported 5% of core fractures in anteriors by Fabbri et al.5 The quality of restoration margins was in line with clinical findings for all ceramic crowns.29 The amount of about 5% missing data for marginal discoloration was due to the share of 5% of marginal finishing lines situated 1 mm subgingivally at the buccal side. The color integrity of the crowns showed over 99% excellent ratings over time. This was above the currently reported quality and might be due to the following: the data in literature covered the former lithium disilicate material (Empress 2, Ivoclar-Vivadent), and the ingots were not available in the variety of colors and translucencies as provided for the e.max-system. Furthermore, the previous studies encompassed a large amount of crowns luted with glass ionomer cement, which is known to be opaque and white and may change the color outcome. The present cohort showed the high number of restorations in one patient (up to 28 restorations). Therefore, the possibility of perfect color match was higher due to simultaneously restored neighbouring teeth. Furthermore, the fabrication of crowns by dental technicians experienced with the emax-system allowed a high esthetic outcome, especially when combined with the use of a composite resin for luting, which was available in at least two different shades (Multilink Automix: translucent and yellow). This result supported the finding that the system is quite capable to provide crowns of high esthetic outcome that is stable over time.30
In addition to the previous findings, no pulp irritation or hypersensitivity was reported. The tooth that encountered an endodontic problem received an extensive core build-up during the former prosthodontic treatment. Regarding endodontic health, the applied adhesive luting protocol could be considered as a save option. The higher complication rate for root canal treated teeth could be attributed to the pre-existing biological inferiority reported for RCT teeth.31
It can be concluded that heat pressed and adhesively bonded single tooth crowns made from the second generation lithium disilicate perform clinically excellent. Especially, their esthetic and biocompatibility are of high quality while presenting a comparable marginal integrity for all ceramic crowns. The performance is compromised by early events, which are heavily related to the clinical handling and biological impairment, such as a root-canal treatment of the tooth.

 XML Download