

 PDF
PDF ePub
ePub Citation
 Print
Print


INTRODUCTION
Alongside functionality, aesthetics is to be considered in dental ceramic restoration; the influential factors in aesthetics are shape and color. To achieve this aesthetic ceramic restoration, it is important to restore the shape and color of the adjacent tooth. However, every individual has different tooth shades, and the process of reproducing the right shade is difficult. In general, commercial dental ceramics have a limited number of shades, such as A, B, C, and D series. In addition, the scope of the shade guide used clinically is restrictive, with intervals between colors that are too large for accurate shade selection. To reduce the interval between shades, dental technicians are making efforts for adjustment of ceramic thickness with the mix of porcelain powder, improvement of the condensation method, and selection of stain and glazing. As a shade matching system, a shade guide method123 that selects already defined colors (shade tab) through comparison is a convenient method to determine tooth color. An instrumental tooth shade analysis quantifies and expresses colors objectively via a dental colorimeter and spectrophotometer.
As solids are three-dimensional structures (length, width, and depth), color also has three major properties that can be described with the same degree of precision, depending on the shade system used.4 The International Commission on Illumination (CIE) L*, a*, b* (CIELAB) color system was introduced in 1976. Advantages of the CIELAB color system5 are that colors can be classified into L*, a*, and b* coordinates and converted to numerical values.6 L* is similar to the brightness (value) in the Munsell color system and represents the lightness and brightness of color. a* And b* describe the chromatic characteristics of color. a* Belongs to the red-purple/blue-green axis in Munsell color space and b* belongs to the yellow/purple-blue axis.4 In this space, the color difference is the three-dimensional distance between the locations of two colors, ΔE (delta E). Spectrophotometric analyses using the CIELAB system have been used in previous researches on shade.789101112
Dental ceramic has been selected as material for matching natural tooth.13 The influential factors of ceramic restoration aesthetics is translucency and color.14 Translucency is one of the crucial factors to determine the failure of shade congruence of natural teeth and restorative material.415 Many previous studies included firing temperature16 and firing frequency of porcelain,171819202122 stain and glaze,2324 and thickness of opaque1125 and ceramic262728 as influential factors for shade and translucency of dental ceramic restorations. However, there is insufficient research on the mix of ceramic powders that are commonly used in a dental laboratory.
This study aimed to evaluate the effect of mixed ceramic powders on the shade and translucency of dental ceramic after going through the firing process. The null hypothesis was that the shade and translucency of the specimen manufactured in varying mixing ratios are not influenced by the ratio of powder added.
MATERIALS AND METHODS
A2 and A3 body powders manufactured by each of the following brands were selected: IPS e.max Ceram (Ivoclar Vivadent, Schaan, Liechtenstein), Vintage Halo (SHOFU Inc., Kyoto, Japan), and Ceramco 3 (Ceramco-Dentsply, Burlington, NJ, USA). For each product, the A2 powder was mixed with the A3 powder at ratios of 0 wt% (A2: 100 g, A3: 0 g), 25 wt% (A2: 75 g, A3: 25 g), 50 wt% (A2: 50 g, A3: 50 g), 75 wt% (A2: 25 g, A3: 75 g) and 100 wt% (A2: 0 g, A3: 100 g), respectively. Pure A2 powder from a given manufacturer was used as a control. Each powder mixture was stored in a plastic container with a zirconia ball. The ball mill was set to mix at a steady rate for 2 hours.
After filling the silicone mold (W: 13 mm, L: 14 mm, H: 2 mm) with the appropriate solution and powder mixture, samples were condensed using a supersonic vibrator (SHOFU Inc., Kyoto, Japan). In adherence to the firing schedule recommended by the manufacturer, 150 specimens were manufactured: 10 pieces per mixing ratio of the three products. Rectangular specimens were grounded using a diamond dresser (SHOFU Inc., Kyoto, Japan) and finished with sandpaper (Grit 180, 320, 600, and 1200). The size of each specimen (W: 8.5 mm, L: 10.5 mm, H: 1.5 mm) was standardized using a digital caliper (Model CD-6 BS, Mitutoyo Co. Tokyo, Japan). The width and length of the specimen were similar to the upper central incisor,29 and the height was equivalent to the thickness of porcelain-fused to metal (PFM).
A spectroradiometer (PR 670, Photo Research, Chatsworth, CA, USA) was used to obtain measurements in ambient light. The specimen was fixed on a black tile after placing a lamp (GretagMacbeth Instruments Corp, Research Triangle Park, NC, USA) with a D65 light source within a light box. A spectroradiometer (PR 670, Photo Research,) with spot diameter of 2.63 mm was used to measure color at the same point on each specimen. The translucency parameter (TP) values were obtained by calculating the color difference of the specimen over the white (L*: 94.02; a*: -0.22; and b*: 2.68) and the black tile (L*: 4.85; a*: -1.50; and b*: -1.98). Similar to the previous studies, 3031 optical contact was achieved by using optical fluid (distilled water), which is the coupling medium between ceramic specimen and background board.
CIE L* a* b* values measurements were obtained in triplicate for each specimen. Color difference5 and TP32 were calculated as follows:
Where ΔE*ab = color difference; ΔL* = difference in brightness; Δa* and Δb* represent the color difference for colorimetric coordinates a* and b*, respectively.
Where TP = translucency parameter; L* represents the brightness coordinate; a* and b* represent colorimetric coordinates. Subscript W refers to color difference on a white background, while subscript B refers to color difference on a black background.
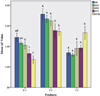
All mean values were analyzed using statistical software (IBM SPSS V20, IBM Corporation, Chicago, IL, USA). Two-way ANOVA was performed to examine the difference of specimen type (three brand types and five different mixtures) on L*, a*, b*, TP values and color differences (ΔE*ab) (Table 1, Table 2, Table 3, Table 4, Table 5). Statistical significance was verified at a confidence level of 95% (α = 0.05). One-way ANOVA was performed to assess color differences among three products depending on mixing ratio (Fig. 1). The Bonferroni multiple comparison method was applied when significant differences were detected among groups. The significance level was set at 0.05. However, in the tests of the three-dimensional coordinates L*, a* and b*, which represent the same entity, the significant level was divided by the number of coordinates (0.05/3 = 0.017) by applying the Bonferroni correction to prevent increase of type one error rate.
RESULTS
For color and translucency analysis, the A2 (100 %) group was represented as M0; A2 (75%) + A3 (25%) as M25; A2 (50%) + A3 (50%) as M50; A2 (25%) + A3 (75%) as M75; and A3 (100%) as M100. For product analysis, IPS e.max Ceram was denoted as E-powder; Vintage Halo as V-powder; and Ceramco 3 as C-powder.
Table 1 summarizes the comparative L* values of the three brands and five mixing ratios. Comparative L* values of three brands were different; C-power was the highest and V-power and E-powder followed. Trends of mixtures were different in each brands; as A3 ratio increase, M0 to M100, L* values increased in E-powder while decreased in V- and C-powder.
Table 2 summarizes the comparative a* values of the three brands and five mixing ratios. Mean a* values of three brands were different; V-power was the highest and C-power and E-powder followed. Trends of mixtures were different in each brands; as A3 ratio increased, M0 to M100, a* values increased in all brand materials.
Table 3 summarizes the comparative b* values of the three brands and five mixing ratios. Mean b* values of three brands increased as A3 ratio increased, M0 to M100; increase in E-powder was slower while faster in V-power and C-powder.
Table 4 shows the translucency parameter (TP). Mean TP values were lowest in C-powder among three brands. While TP values increased in V- and C-powder as A3 ratio increased, TP values decreased in E-powder.
Table 5 shows the color difference (ΔE) of the mixed powders. Mean color difference (ΔE*ab) compared to pure A2 (M0) was the smallest in E-powder and the largest in V-powder. As A3 ratio increased, mean color differences (ΔE*ab) increased in all three brand materials.
Mean color differences (ΔE*ab) between E-powder and V-powder were larger in lower A3-ratio mixtures. Similarly, mean color differences between E-powder and C-powder were larger in lower A3-ratio mixtures. However, color differences between V-powder and C-powder were larger in higher A3-ratio mixtures (Fig. 1).
DISCUSSION
There are varieties of natural teeth colors and the translucency of teeth allows reflection, penetration, absorption, refraction, and scattering of the light. Hence, blending of light also occurs besides that of the colors in natural teeth. Representing the color of natural teeth with limited materials of dental ceramics is very difficult due to its diverse and complicated appearances. However, accurate selection of color, appropriate use of materials, and high level of dental technology will assist in the approach to obtain the color of natural teeth.
Tooth colors show perceptible differences between different teeth within the same oral cavity. This explains why perceptibility and acceptability limits are generally divided.33 Douglas et al.34 reported perceptibility and acceptability tolerance of color difference for 50% of the observers as ΔE = 2.6 and ΔE = 5.6, respectively. Kristiansen et al.35 recorded the acceptance criteria of color difference for dentists, dental assistants, patients, and researchers as ΔE = 2.18, ΔE = 1.78, ΔE = 2.69, and ΔE = 2.56, respectively and the acceptance criteria of average color difference as ΔE = 2.29. Previous studies defined perceptibility thresholds (PT) and acceptability thresholds (AT) of shade difference as ΔE = 1 and ΔE = 3.7, respectively.3637 Ghinea et al.38 reported PT and AT of ΔE = 1.80 and ΔE = 3.46, respectively. The threshold for the color difference used in this study was based on that defined by Paravina et al.39 They reported the PT and AT values as ΔE = 1.22 and ΔE = 2.66, respectively. In this study, 5 of the 12 color differences values between the M0 group and the other groups were below the AT value of 2.66 and PT value of 1.22 (Table 5); all presented the inter-brand color difference value over the AT value of 2.66 and PT value of 1.22 (Fig. 1). This indicates that various recognizable colors can be expressed by mixing A3 powder.
This study measured the color of each ceramic specimen produced by mixing one powder (Shade A2) with another powder (Shade A3) at determined ratios. As shade A3 was further added to the mix, E-powder showed an increase in L* value and a decrease in V-powder and C-powder, a decrease. Mean a* and b* values increased for all E-powder, V-powder, and C-powder. A linear correlation (direct or inverse proportion) was shown between L*, a*, and b* values and the mixing ratio of ceramics (Tables 1, 2, 3). The post-hoc comparison results revealed that there were significant differences in L*, a*, and b* values within groups. As shade A3 was further added to the mix, E-powder showed a decrease in the translucency parameter, while V- and C-powder showed an increase in TP (Table 4). Of note, E-powder showed an inverse tendency when compared to V-powder and C-powder L* and TP values (Tables 1 and 4). This limited study make it hard to find out the reason for these results, but it is supposed that E-powder was produced to fit all ceramics, while V-powder and C-powder were produced for porcelain fused to metal (PFM) restoration.
In this study, external illuminants rather than an internally loaded light source used colors measured by a spectroradiometer located at a certain distance. However, in most dental clinics, the colors of natural teeth are selected by using a shade guide under indoor lighting (fluorescent lamp). Moreover, as the shade tab was manufactured with synthetic resin or by adding ceramic filler to synthetic resin, there exists a color difference when compared with manufactured ceramic restorations.
Generally, ceramic powders in a dental laboratory are mixed based on the information of natural teeth colors, which are chosen by comparing with the shade guide. Alternatively, an experience-based mix may be conducted. Therefore, there is a need to choose a color with a system that analyzes and precisely measures the tooth color, rather than using the shade guide, for obtaining a color that matches up with natural teeth. In particular, the mixing of powders will have to be done quantitatively, based on data from the colorimetric system.


 XML Download