

 PDF
PDF ePub
ePub Citation
 Print
Print


INTRODUCTION
Currently, Co-Cr alloys are extensively used in prosthodontics due to a combination of favourable properties in a variety of applications in fixed and removable restorations.1,2 However, joining of Co-Cr dental frameworks is often necessary to repair broken restorations3 or to achieve a passive fit of cast frameworks for metallo-ceramic restorations of implant retained superstructures.4,5,6 Modern dental technology offers several joining techniques, but the most commonly used in the dental field are gas-torch soldering,3 tungsten inert gas (TIG)7,8 and laser welding.7,9,10 The use of laser welding has been increased in the last years11 as it combines several advantages over the others. Laser welding is less time consuming and more accurate compared to soldering, minimizing the inaccuracies introduced by transferring the framework from the master cast and by the heat distortion of the investment material.12,13 The welding is possible even close to veneering materials (resin or porcelain) due to localised laser beam heating, avoiding adverse consequences (cracking or discoloration).14 Additionally, corrosion resistance is not jeopardized due to galvanic coupling of dissimilar metals as in the case of brazing/soldering technology where alloys with different elemental composition are used as brazing filler materials.10 Overall, the laser welding technology is considered as a rapid and economic way for joining dental frameworks.14
The quality of laser welded joints is dependent on a variety of factors. These include material properties (i.e. thermal, mechanical, surface reflectivity, laser beam absorbance capacity), laser beam parameters (i.e. pulse shape, mean power, pulse energy), the use of shielding gas and the dental technician's skill and experience.15,16,17,18 The cross-section of the dental framework to be welded becomes important due to the relatively shallow melting depth of laser welding. In the case of thin metallic objects such as clasps or frameworks of removable partial dentures, substantial melting depth can be achieved by laser welding of sectioned faces butted against each other.19 This operation is called "deep welding" and is carried out without the use of a filler alloy.19 This is not however feasible for larger cross sections such as those of sectioned lingual bars, bridge connectors or implant retained superstructures. While laser pulses with increased power deepen the melting depth, they adversely affect the extent of surface and internal porosity. 16,18,19 To overcome this limitation, the use of different shaped weld seams (i.e I, Y, X, V) in combination with filler metals has been proposed.10,19 The latter weld seams are named after the shape formed when the two surfaces are butted against each other. The welding begins at the point of contact by welding on the filler metal and continues towards the surface of framework. Despite the variety of proposed seam welds, only the mechanical properties of X and Y geometry has currently been tested for Co-Cr alloys.10,20 In addition the elemental distribution of Co-Cr alloy and filler metal at the alloy-joint interface has neither been tested nor compared till today between different joint designs.
Therefore, the aim of this study is the mechanical and interfacial characterization of laser welded Co-Cr alloys with two different joint designs. The null hypothesis of this study is that the mechanical properties of laser welded groups are similar to that of intact cast material.
MATERIALS AND METHODS
Thirty rectangular dumbbell shape (length: 30 mm, thickness: 1.5 mm and width 3.0 mm at the central reduced section and 6.0 mm at the shoulders) resin patterns (Pattern Resin LS, GC America Inc, Alsip, IL, USA) were invested in a phosphate bonded silica investment material (Bellastar XL, Bego, Bremen, Germany) and cast with a Co-Cr dental alloy (Wironit LA, Bego, Bremen, Germany) with nominal composition (% wt: Co:63.5 Cr:29 Mo:5 Si:1.2 Ta<1 Mn<1 N<1 C<1) employing a dental casting device (?autilus Cc Plus, Bego, Bremen, Germany). The cast specimens were equally divided in three groups (R, I, K, n=10). Group R consisted of intact specimens, Group I of specimens was sectioned with a straight cut and Group K of specimens with a 45° bevel made at the one welding edge employing a custom made device. Before laser welding, the sectioned specimens were cleaned in an ultrasonic bath with distilled water and then with steam jet for 1 min. In order to create dull surfaces, sectioned parts and adjacent areas of the joint were sandblasted with 150 µm alumina grains at 10 mm distance with 3 atm propulsion pressure. The preparation of dull surfaces is recommended to reduce the laser beam reflection during welding procedure. Then the sectioned specimen pairs of groups I and K were cleaned with acetone and sequentially fixed in a custom made device. For group I, the distance between the welded parts was kept constant at 0.2 mm while for group K the parts were aligned and kept in contact. The sectioned specimen pairs were laser welded using the company recommended wire (Wiroweld, Bego, Bremen, Germany %wt Co:63.5 Cr:29 Mo:5.5 Si:1 Mn:1) in a laser welding device (Laser Star 970 Series, Riverside, RI, USA), employing 260V peak power, 3.5 ms pulse duration, 1.5 Hz pulse repetition, 0.2 spot diameter and weld spots overlap of approximately 80%. The excess of metal was removed from the side of the joints with finishing stones. The specimens of all groups were ground with SiC papers up to 4000 grit in a grinding polishing machine (εcomet III, Bueler, Lake, Bluff, IL, USA) under continuous water cooling and five specimens from each group were polished employing 6 and 3 µm diamond pastes (DP Paste M, Struers, Ballerup, Denmark). The polished specimens were put in an ultrasonic bath with ethanol for 3 min, then rinsed with water and dried.
The polished specimens were then imaged in an SEM (Quanta 200, FEI, Hillsboro, OR, USA) employing back-scattered electron (BE) detector under the following conditions: 30 KV accelerating voltage, 104 µA beam current, 10-6 Torr chamber pressure (high vacuum), and 300x nominal magnification. For each specimen, an EDX spectrum was acquired at the joint center for groups K and I and at the specimen center for group R using an X Flash 6|10 Silicon Drift Detector (Bruker, Berlin, Germany) under the aforementioned operating conditions, employing a 430 × 430 µm sampling window and 300 s acquisition time. The quantification was carried out in a standardless mode using ZAF (atomic number, absorbance, fluorescence) correction factors with the dedicated software (ESPRIT ver 1.9, Bruker, Berlin, Germany). The elemental distributions of Co, Cr, Mo, Si, Mn and O at the alloy-joint interface were determined by EDX analysis operating in area scan mode with 126 × 108 µm sampling window while the gradients of Co, Cr and Mo were studied by line scan analysis employing two analysis points per micron.
Specimens were subsequently loaded up to fracture in a universal tensile testing machine (Instron 6022, Norwood, MA, USA) with 1.5 mm/min crosshead speed and the stress-strain curves were recorded. The tensile strength (TS) and elongation (ε) after fracture were determined for each specimen and the mean value and standard deviation were used to characterize each group.
Then the fracture specimens were imaged in an SEM and Secondary Electron (SE) images were taken in various magnifications.
The elemental composition, the TS and the ε were statistically analyzed by one-way ANOVA and SNK multiple comparison test (α=.05) using the SigmaPlot statistical package (Systat Software, Inc. San Jose, CA USA). Weibull statistics (WinSMITH™ Weibull & Visual 2.0M, Fulton Findings™, Torrance, CA, USA) were used to analyse the tensile strength data. Ranked (ascending) TS test values were plotted against the double logarithm of 1/(1 - median rank). Median rank regression methods were then applied to fit a straight line through the data points. The two parameter Weibull distribution function was used (Pf = 1 - exp [ - (σ/σσ)m ], Pf: Probability of failure, σ: strength at a given Pf value, σο: Characteristic strength and m: Weibull modulus). Significant differences between Weibull m and characteristic strength values were detected based on the lack of overlap of the 95% double sided confidence intervals.
RESULTS
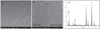
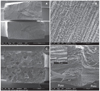
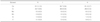
Fig. 1 illustrates characteristic BE images from the center of R specimen (Fig. 1A) and from the interface between parent alloy and the welded region (Fig. 1B) along with a representative EDX spectrum. The interface is readily distinguished due to the difference in microstructure. The cast alloy demonstrates a distribution of a heavier phase while no mean atomic number contrast is shown for the welded region. EDX analysis showed that there are no significant differences (P>.05) in elemental composition among the groups tested (Table 1).
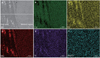
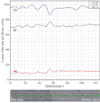
Fig. 2 illustrates a representative BE from the alloy-welded region interface from groups I and K with the corresponding elemental distribution of probed elements. X-ray mapping revealed that all elements are homogeneously distributed in the joint region. Contrary Cr, Mo and Si followed the distribution of the white areas in BE image with the distribution of Co being complimentary to previously mentioned elements. Mn and O showed also a homogeneous distribution in the cast alloy too. The line scan analysis depicted that the interface is depleted in Co and enriched in Cr and Mo (Fig. 3).
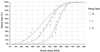
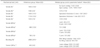
The tensile strength and elongation after fracture are presented in Table 2. Group I showed significantly lower (P<.05) tensile strength than group R while group K showed intermediate values without statistical differences (P>.05) from both aforementioned groups. Both welded groups (I and K) illustrated significantly lower (P<.05) elongation after fracture compared to group R. The results of the Weibull analysis including the Weibull modulus m and the characteristic strength (σο) are presented in Table 3 along with their 95% confidence intervals. Similarly to the tensile results, group I showed statistically lower m and σο compared to group R (P<.05) while group K showed intermediate values without statistically significant differences from groups R and I (P>.05). For all groups tested the r2 value was found above 0.9 denoting a good fit of the tested data to the Weibull distribution. The survival probability versus tensile loading for all groups is presented in Fig. 4.
Representative fracture surfaces from group R are presented in Fig. 5A and B where extensive dendritic structure is identified. Fig. 5C and D shows representative SE images from the surface of I and K groups. Fracture surfaces illustrate gross internal porosity (Fig. 5C) but in higher magnification a fine dendritic structure is revealed (Fig. 5D).
DISCUSSION
The groups tested showed significant differences in mechanical properties and thus the null hypothesis must be rejected. It is widely known among researchers and technicians that there is not till today a consensus for the selection of optimum welding parameters based on materials properties and geometry of a given restoration. The I joint has been extensively tested for Co-Cr alloys.10,11,17,20,21,22,23,24,25 Butting the parts to be welded however poorly simulates the clinical situation of sectioned implant retained superstructures or bridge frameworks as material loss during sectioning rules out direct contact. Previous studies support that a minimum joint opening distance of 0.2 mm between the sectioned parts must be used to simulate the real situation.26,27 Conversely, in the K joint, it provides a good starting point at the center of the weld so as to initiate welding towards the surface of the framework. In addition, this joint design decreases the material addition which is required to fill the empty space when compared to the cases of X or V joints.
No significant differences (P>.05) were found in elemental composition after EDX analysis (Table 1) among groups denoting that cast material (R group) and the welded regions (I and K) share equal elemental content. BE image revealed the characteristic cast structure of Co-Cr alloys with a diffuse distribution of a second phase with higher mean atomic contrast occupying the interdendritic spaces.2,28 The dendritic microstructure facilitates the formation of inderdendritic porosity, decreasing the mechanical strength and the ductility of cast Co-Cr alloys.2 No differences were found in the microstructure of R (Fig. 1A) and cast alloy adjacent to the alloy-welded region interface for both welded groups (Fig. 1B) implying that the microstructure is not altered by the thermal energy transferred during the welding procedure. This outcome was expected as no microstructural changes have been observed after heat treatments of cast Co-Cr alloys even for prolonged times in high temperatures.29 The diffuse higher phase is enriched in Cr, Mo and Si and depleted in Co as it is presented in the x-ray mapping, a finding which is in agreement with a previous study.30 Conversely, no mean atomic contrast was identified in the welded region as has also been identified in previous publications.11,14 This might be explained by the rapid solidification of material eliminating the segregation of alloying elements during solidification.2 Interestingly, the line scan revealed an increase in Cr and Mo content at the interface (Fig. 3) which might be attributed to the intense contribution of Cr and Mo at the oxide layer of cast Co-Cr alloys.28 However, this is only a speculation which requires further experimental testing.
The tensile properties of the reference group were found similar to the nominal values given by the alloy manufacturer TS: 940 MPa and ε: 8%) while the TS of group I is similar to the previously reported 751 (109)25 and 700 (100)20 MPa. The lower mean TS value of group K failed to differentiate to group R. The sample population in previous studies remained low with only eight specimens per group in one study25 and less than six for the rest.10,11,17,20,21,23 Despite the increased number of specimens used in this study, the statistical analysis power was however found lower (0.69) than the desired 0.8. This denotes that the absence of a statistically significant difference may be due to the relatively small sample size and should be thus cautiously interpreted.
Table 3 demonstrates the mechanical properties of laser welded Co-Cr alloys along with a brief description of the experimental parameters tested in the current dental literature. Despite the diversity of experimental parameters, the general trend is that the welded groups have similar or significantly lower fracture strength compared to the reference groups. This finding is easily attributed to pores, gaps and other flaws developed at the joint during the welding procedure. 10,11,21,23 These multiple flaw type populations can be responsible for the relatively poorer agreement of the welded groups' failure probability curves in comparison to that of the cast group R (Fig. 4).31 The characteristic strength σο signifies the tensile stress below which 63.2% of the specimen population are expected to fail and thus the higher the better for the longevity of each group. Based on the results of this study, Weibull analysis indicated a significantly higher probability of failure for group I compared to R (Table 2,Fig. 4). The Weibull modulus m is a measure of the strength variability (the lower the m the higher the variability of strength). In a clinical scenario group I would therefore be expected to be more likely to fracture in low loading conditions as it is schematically presented in the sigmoid failure probability curves in Fig. 4. It seems that the I joint is more vulnerable in pore formation and unfused areas during welding.10,11,21,23 Conversely, it is suggested that the K joint might be less sensitive to pore formation as welding is initiated from a certain point and the material is added towards the surface of the framework spot by spot Fractography revealed internal pores (Fig. 5) in both I and K groups and thus internal porosity still remains a complication. Fractographic analysis of group R (Fig. 5A, B) is in accordance to previous studies, indicating a dendritic brittle fracture.11,21,23 This dendritic structure is also retained for the welded groups but with a much finer structure which can be identified only in a high magnification (Fig. 5D), a finding that might be explained by the rapid cooling rate of the welding spot.
The quality of laser welded joints is dependent on a variety of factors16 and the current knowledge is limited to only a few of them. Dental technicians and operators are provided with only a few general guidelines for laser welding procedures but these are far from a widely accepted consensus including framework dimensions, materials type, joint geometry and laser conditions to achieve more reliable joints. Further research is definitely required to deepen our knowledge in the field in order to optimize the laser welding procedure for dental alloys.
CONCLUSION
While the microstructure of laser welded Co-Cr joints is dissimilar to that of the cast alloy, no significant difference in elemental composition exists. The I joint configuration is mechanically inferior to R. Within the limitations of this study, it is suggested that the K shape joint configuration should be preferred over the I, as it demonstrates improved in vitro mechanical strength and survival probability.

 XML Download