

 PDF
PDF ePub
ePub Citation
 Print
Print


INTRODUCTION
Porcelain fused to metal restorations have played a crucial role in aesthetic dental restoration since the development of ceramics in 1965.1 The rigid metal alloy core enables use of a wide range of metal ceramic crowns, from single crown to the long-span fixed partial denture that supports the veneering ceramic. However, the metal alloy has some limitations; it blocks light transmission and causes the umbrella effect and aesthetic disharmony.2 To overcome these limitations, all-ceramic restorations are appropriate for anterior restorations. Although many attempts have been made to improve its physical properties, the all-ceramic restoration is relatively fragile and therefore, it has been applied only to anterior restorations or short-span prostheses. These limitations have spurred the adoption of new ceramic materials and development of different fabricating techniques. For example, dental porcelain materials developed by an enforcement mechanism have been introduced and heat-pressed ceramics using the lost-wax technique are widely known as a new fabrication technique.
Yttrium zirconia is one of the most widely used restoration materials to resolve the aforementioned troubles in metal alloy core and porcelain core. Following the introduction of Computer aided design-Computer aided manufacturing (CAD/CAM) technology, yttrium zirconia has gained rapid acceptance in clinical dentistry. This popularity is based on the material's aesthetic benefit and strength. Yttrium zirconium has been used for many aesthetic restorations. Also, the material enhances the speed, accuracy, and reliability of manufacture. Moreover, the transformation toughening that strengthens yttrium zirconia allows zirconium crowns to substitute for metal ceramic crowns.34
Despite such advantages, use of the zirconia prosthesis has been limited by its opaque shade, which lacks visual harmony with adjacent teeth. To alleviate the problem, veneering and staining techniques have been introduced. However, those methods lead to other issues, such as unstable durability of veneered ceramics and attrition of the opposing teeth. Although zirconia dental prostheses per se display high fracture strength and excellent clinical performance compared to all-ceramic restorations, high fracture rate in veneered ceramics due to the resulting mismatch in the elastic modulus and thermal expansion coefficient between the zirconia core and veneered ceramic have been reported.5
The present study investigated the effects of the two different core materials (metal core vs. zirconia core), core thickness (0.5 mm vs. 1.0 mm) and two veneering methods (conventional layering technique vs. heat-pressing technique) on the fracture of the porcelain veneered prostheses using the biaxial flexure strength test and Weibull analysis.
MATERIALS AND METHODS
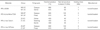
Forty nickel-chromium (Ni-Cr) alloy (Wiron 99; Bego, Bremen, Germany) cores and 40 zirconia (IPS e.maxZircad; IvoclarVivadent, Amherst, NY, USA) cores were prepared. Twenty of each type of core was 0.5 mm in thickness and the remaining 20 were 1.0 mm in thickness. This comprised four groups with 20 cores per group. Each group was divided into two subgroups depending on the veneering method (conventional layering technique and heat-pressing technique). Thus, the final veneering porcelain samples included eight groups with 10 samples per group (Table 1).
Forty disk-shaped specimens having a 15 mm diameter were prepared for the metal core based on the ISO standard 6872:2008(dental ceramic). The 40 waxed (Preparation wax; Bego, Bermen, Germany) specimens were divided into two groups with thicknesses of 0.7 mm (n = 20) and 1.2 mm (n = 20). Both groups were invested (CB-30; Ticonium, Gardenia, CA, USA), cast in Ni-Cr alloy (Wiron 99; Bego, Bermen, Germany) and sanded to a finish with 300, 600, 1000 and 1200 grit sand paper to a thickness of 0.5 mm or 1.0 mm.
The other forty disk-shaped specimens were prepared by milling and drying zirconia blocks (IPS e.maxZirCAD; Ivoclar Vivadent, Amherst, NY, USA) followed by sintering at 1,500℃. Like the metal core, the specimens were wet-ground with sand paper to produce the disks of 15 mm diameter and thickness of 0.5 mm (n = 20) or 1.0 mm (n = 20).
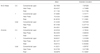
The 80 cores were sand-blasted with a pressure of 2.0 bar and ultrasonically cleaned for 10 minutes (Ultrasonic cleaner 2210; Branson, Danbury, CT, USA). For conventional layered veneering porcelain, opaque porcelain and dentin porcelain was prepared by mixing the powder/liquid, sintering following the manufacturer's instruction, and manufacturing the veneering porcelain with a thickness of 1.0 mm. For the heat-pressed veneering porcelain, the top of each core was waxed in a disk-shaped wax pattern. This was followed by an ordinary burn out process and injection of the heat-pressed porcelain ingot for the veneering process to produce a thickness of 1.0 mm. Table 2 summarizes the materials and methods used in the porcelain sintering process. The samples in the M0.5C, M0.5P, Z0.5C, and Z0.5P groups had disk-shaped cores with a 15 mm diameter and 1.5 mm thickness, while the M1.0C, M1.0P, Z1.0C and Z1.0P groups had disk-shaped cores with a 15 mm diameter and 2 mm thickness. To reproduce the oral environment, samples were tested after 6000 cycles of thermocycling in distilled water with a temperature of 5℃ and 55℃ (Invertech, Kwangju, Korea). The retention period was 15 seconds for each reservoir.
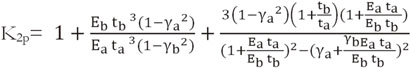
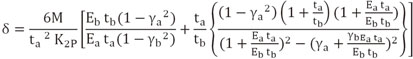
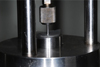
The biaxial flexural strength was measured by the piston using the three ball method following ISO standard 6872:2008. The universal testing machine (Instron, Norwood, MA, USA) was used to measure the strength for the fracture with a crosshead speed of 1.0 mm/min (Fig. 1). The veneering porcelain was placed on the tensile surface and the core material was placed on the compressed surface. The thin plastic sheet (0.05 mm thick) was placed between the sample and the piston. The load for the fracture of the sample was recorded. The biaxial flexural strength was calculated using the equation below. The samples used in the study did have a heterogeneous structure where two different materials were physically attached to each other, while keeping their own physical characteristics. Since the bilayer structure has a relatively weak interface and is more vulnerable compared to the monolithic structure, it was not proper to apply the conventional equation to calculate the biaxial flexure strength. Therefore, we made use of Roark's formulae based on the bending theory, which reflects the characteristics of each material and analyzes the stress on the tensile surface and the stress on the compressed surface separately. The formulae are :

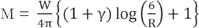
R = equivalent radius
M = maximum bending moment
r = radius (a = compressive side's, b = tensile side's)
t = thickness
T = total thickness
E = elastic modulus
δ = tensile stress
γ = Poisson ratio (γa,γb = 0.25)
The tensile stress obtained from the formula was used to compare and analyze the fracture strength of the groups. After conducting the biaxial flexural strength test, we observed the fractured samples with an optical microscope (Leica Microsystems GnbH, Wetzlar, Germany).
Since the strength of the ceramic could readily deviate from the standard distribution, Weibull analysis measured the failure probability at scale parameters and shape parameters. The Weibull parameters of shape and scale were obtained by making use of median rank regression method to measure unreliability. To assume a Weibull distribution and create a survival graph, Weibull calculator software (Excel; Microsoft, Redmond, WA, USA) was used.
RESULTS
SPSS version 18.0 (SPSS Inc, Chicago, IL, USA) was used to analyze the elements affecting fracture strength.
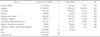
The average and standard deviation of the fracture strengths for core materials, core thicknesses and veneering techniques are summarized in Table 3. The metal core groups showed higher fracture strength than the zirconia core groups. The overall average strength of the metal core groups was 54.49 MPa, which was higher than the zirconia core groups (48.39 MPa). In particular, the strength of the metal core groups was 47.11 MPa for the 0.5 mm thickness and 61.87 MPa for the 1.0 mm thickness, representing a difference of 14.7 MPa. The difference of meanvalues between the conventional layering groups (41.54 MPa) and the heat-pressing groups (67.44 MPa) was 25.90 MPa.
For zirconia core groups, the fracture strength was 46.82 MPa for the 0.5 mm thick cores and 49.97 MPa for the 1.0 mm thick cores. The difference value in the fracture strength depending on the thickness was 3.15 MPa. However, the difference of mean values between the conventional layering groups (41.52 MPa) and the heat pressing groups (55.27 MPa) was 13.75 MPa. The results of the three-way ANOVA based on the descriptive statistics are shown in Table 4. The mean differences in the fracture strength were statistically significant at the 0.05 level, indicating that the three factors (the core material, thickness, and veneering method) have significant effects on the fracture strength. Among the factors, the veneering method had the highest impact on the fracture strength, followed by the core thickness and core material.
Two-way ANOVA test with four metal core groups and four zirconia core groups was done to identify the factors influencing the fracture strength for each group. In the metal core groups, both the veneering method and the metal core thickness were observed as distinct factors that influenced fracture strength. The veneering method was the most influential factor in the fracture strength (F = 117.348, P = .000) followed by the core thickness (F = 38.076, P = .000). The heat pressing groups had significantly higher fracture strength than the conventional layering method. The thicker the core was, the higher fracture strength the core had (Table 5). However, in the zirconia core groups, only the veneering method showed significant impact on the facture strength at the .05 level (F = 43.219, P = .000), while the core thickness did not have any statistically significant effect on fracture strength (F = 2.263, P = .141) (Table 6). Similar to the results in metal core groups, the heat-pressing groups had significantly higher strength than the conventional layering groups in zirconia core groups.
The number of cracked surfaces on samples was observed by optical microscopy (Fig. 2) followed by a correlation analysis. The positive correlation coefficient (Pearson Correlation = 0.735, P = .000) indicated statistically significant linear relationship between the fracture strength and the number of cracked surfaces (Table 7).
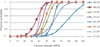
Table 8 shows the results of the Weibull analysis for the biaxial flexural strength. The shape parameter indicates the probability of fracture at varying stresses. In all samples, the values of the shape parameter exceeded 1, meaning that the probability of fracture increased as stress increased. The second row in the table presents Weibull scale values, which indicated that strain with 63.2% of the materials show fracture. Fracture probability versus fracture strength was analyzed for each group (Fig. 3). From the group comparison analysis, two important findings were obtained. First, consistent with the results of fracture strength test, the fracture possibility increased as the fracture strength increased. Second, M1.0P was the highest scale parameter followed by Z1.0P, M0.5P, Z0.5P, M1.0C, Z0.5C, Z1.0C and M0.5C.
DISCUSSION
In dentistry, several studies reported that not only the occurrence frequency of porcelain fracture was less than 3% for 20 years but also survival rate was 95.5% for 7 years in the metal ceramic crown.67 However, the superiority of the metal ceramic crown in terms of fracture is still a controversial issue. For example, Sailer et al.8 reported that the chipping rate of the metal ceramic crown is four times less than the porcelain veneered zirconia prosthesis. Other studies suggested that the chipping of the porcelain veneered zirconia prosthesis is the main factor leading to failure, showing the failure rate is 15.2% for 35.1 ± 13.8 months.910 In Contrast, Quinn et al.11 proposed that there is no difference in the fracture rate between the metal ceramic crown and porcelain veneered zirconia. Therefore, in this study, we compared the porcelain veneered zirconia to the porcelain fused to metal in terms of fracture strength with the same standard.
Recently, a number of studies have investigated how a weak interface bonding between zirconia and veneering porcelain causes clinical failure. Alhasanyah et al.12 suggested that a proper size of core support in the zirconia prosthesis improves the fracture resistance to chipping, showing that the fracture load of 1.7 mm core is as strong as that of the metal ceramic crown, whereas 0.6 mm and 1.2 mm zirconia cores with identical whole thickness crowns have the same fracture strength and these values are smaller than values of the metal ceramic crowns. Despite the empirical findings, previous studies have some limitations. First, the thickness of veneering porcelain varies for each core. So, the studies are hindered in identifying the isolated effect of core thicknesses on fracture strength. Second, the 1.7 mm zirconia core has some limitations in clinical applications, such as the excessive tooth preparation and shade problem. To alleviate the issues, we investigated the isolated impact of core thickness on fracture strength by fixing the thickness of veneering porcelain and proposed a clinically applicable range of a core thickness.
Consistent with the previous studies, we found a positive correlation between the core thickness and the fracture strength for the metal core groups with 1.0 mm veneering ceramic. One plausible explanation for the finding is that increases in the metal core thickness decrease the flexure and tensile stress for the veneering porcelain and inhibits the interface separation. Contrary to the metal core groups, difference of the fracture strength with 0.5 mm and 1.0 mm core thickness among the zirconia core groups was not significant. This infers that the zirconia core ≤ 1.0 mm thick may not resist flexure. The result that the fracture strength values of the 0.5 mm metal core groups, 0.5 mm zirconia core groups and 1.0 mm zirconia core groups were markedly smaller than the fracture strengths of the 1.0 mm metal core groups supports this suggestion. Therefore, in the limiting situation of ≤ 1 mm thickness of the zirconia core, reinforcingthe veneered zirconia is required. To strengthen the veneered zirconia, choosingthe strong veneering ceramic might be one of the most effective methods.
Millen et al.13 measured the fracture toughness of the bilayer ceramic with the same thickness but with different coping to veneer thickness ratio and found that the veneer thickness rather than coping thickness is a more important factor of the fracture toughness. In particular, they showed that the veneering porcelain > 2 mm in thickness had strong fracture toughness. Consistent with the study, our findings also suggested that the veneering porcelain character (vs. coping thickness) has a more significant impact on the fracture strength although there is a positive relationship between the core thickness and the fracture strength of the bilayer specimen.
Accordingly, various fabrication methods of the veneering ceramic have been introduced to enhance its strength. Among them, the heat-pressed veneering method is the preferred technique in fabrication of the veneering ceramic, while the conventional layered veneering method is still widely used. In contemporary dentistry, many studies have examined how the heat-pressed veneering technique influences the fracture strength of the bilayer ceramic prosthesis. This method has two advantages. First, the heat-pressed porcelain on metal has a strong bonding between a metal and a ceramic compared to the conventional metal ceramic crown.14 Second, since the porosity in the ceramic prosthesis weakens the material's strength, the homogeneity of the heat-pressed porcelain materials increase the physical strength.15 Besides the physical advantages, the heat-pressing method has some clinical benefits, such that it accelerates the working speed of the dental technician and decreases the technique sensitivity. Therefore, by using this method, we are able to fabricate a more reliable prosthesis with a certain level.1617 Our findings indicate that the bilayer ceramics specimen had a low value of Weibull modulus, while for the ceramic materials the Weibull modulus ranged from 5 to 20. This result indicates that even heat-pressed ceramics have a structural limit caused by a defective interface and/or a difference in a heat expansion coefficient between two different materials.1819 The heat-pressing technique has been used for porcelain-fused-to-metal and for porcelain veneered zirconia. Heat-pressed porcelain based zirconia prosthesis shows a significantly higher performance than the conventionally made zirconia porcelain.2021 The defect free interface between the zirconia core and the veneering porcelain decreases the zirconia ceramic chipping and delamination.2223 Christensen reported that the prosthesis using heat pressing technique (vs. traditional method) had a lower fracture rate 2 years later in both zirconia and metal ceramics.24 Consistent with the previous studies, we also found some evidence that the heat pressing technique provides stronger fracture strength than the conventional layering technique. High fracture strength of the heat pressed ceramic, homogeneity of the material and decreases in the interface porosity may be influential.
Gonzaga et al.25 explained that the magnitude of the fracture strain was proportional to the number of fragments and the accumulated elastic energy applied to the sample increased for the higher strain. It may be that the core with low elasticity coefficient, dense veneering ceramic and strong interface have roles as storage for the strain and a strain over the capacity may cause more extensive and fritter fracture. This is similar to our experimental data and may be interpreted as an evidence to support the measured fracture strength.
In this study, the metal core groups showed higher fracture strength than the zirconia core group at 1.0 mm thickness, while the two groups had less difference in fracture strength at 0.5 mm thickness than 1.0 mm thickness. Our findings suggest that the core material influences the flexural strength of the bilayer prosthesis and interacts with core thickness. Despite of the clinical and empirical contributions, this study has some limitations in that we used only 1.0 mm veneering porcelain. Thus, we need to investigate the effect of the veneering porcelain on the fracture strength by varying its thickness. Also, additional studies on the proper thickness of the zirconia ceramic with the similar bending resistance to the metal ceramic should be pursued in the future.
CONCLUSION
Within in limitation of this in study, the following conclusions were drawn:
The core material, core thickness and fabrication method of the veneering porcelain affect the fracture strength and the magnitude of the impact is highest in the fabrication method of the veneering porcelain in porcelain fused to metal and porcelain veneered zirconia. The heat-pressed veneering technique provide higher fracture strength value than the conventional layering technique.


 XML Download