

 PDF
PDF ePub
ePub Citation
 Print
Print


INTRODUCTION
Bonding agents (BA) are an essential part of composite adhesion,1,2,3 and are used in various fields (e.g., repairing old composites, veneering laminates on composite restorations, and bonding orthodontic brackets).4,5,6 They are critical in forming proper bonding and prevention of microleakage, secondary caries, sensitization and restoration failure.3 Although BAs constitute a small proportion of a bonded restoration, they are the weak link in the system and possibly the most common cause of failure which might result in marginal discrepancy by their shrinkage, thermal expansion, or wear.1,2
The degree of conversion (DC) is the proportion of single carbon-carbon bonds in a polymer matrix to double carbon bonds between monomers.7,8 It implies the conversion of monomer to polymer and is an index for the extent of polymerization (EP).8,9,10 It can be studied via methods such as differential scanning calorimetry,8 or differential Fourier transform infrared spectroscopy, which is the most sensitive method for estimating the DC.11 The studies indicate that clinical performance of dental composites is affected by DC.7,8,9,10,12 An inadequate degree of conversion might weaken bonding strengths, lower the physicomechanical properties, release toxic materials such as monomers and initiators,13,14,15,16,17 and cause permeability of bonded interfaces.18 After polymerization, BA films might behave as permeable membranes,19 allowing water to flow from the dentin substrate to the top of the adhesive layer, which can negatively affect the longevity of the bonded restoration.20,21,22,23 Inappropriate polymerization might lead to unfavorable changes causing restoration detachment, caries formation, or discoloration around the adhesive, which are of clinical concern.24
DC can affect shear bond strength (SBS) and microleakage. SBS is an essential in vitro property of composite resins, and reflects the retention of the composites. Microleakage is the main cause of tooth sensitivity and secondary caries,3,25 and might cause pulpitis, or reduce restoration longevity.25 After the introduction of bonding agents, minimizing the microleakage has been a serious goal.3
Bonding agents have been developed to be capable of initiating the polymerization of resin monomers and its continuation in order to act as a link between the hydrophilic tooth surfaces and the hydrophobic filled composite resins.13,14,15,16,17 Therefore, changes in their formula may affect their characteristics; and, studying their formula is important.
Therefore, we aimed to find a proper formulation for an experimental bonding agent, by first analyzing a commercial product, and then creating different experimental formulas with similar and dissimilar formulations to the commercial BA, and finally assessing their DC, SBS, mode of failure, and microleakage.
MATERIALS AND METHODS
This explorative experimental in vitro study is based on three sub-projects, each with its own design and sample size and results. These allowed us to produce and select the best formula for a bonding agent. The materials (and their abbreviations) are presented in Table 1. The protocol was approved by the research committee of the Tehran University of Medical Sciences, Faculty of Dentistry.
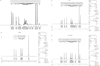
The monomers of the commercial bonding agent (Scotchbond Multi-Purpose) were analyzed. The analysis of the monomers of the commercial bonding agent was carried out using the proton nuclear magnetic resonance (H-NMR) spectroscopy (Avance 500, Bruker, Bremen, Germany). The signatures of the commercial material as well as the signatures of the pure monomers HEMA and Bis-GMA were read, compared, and interpreted (Fig. 1A, Fig. 1B, and Fig. 1C). After extensive analysis of the H-NMR spectra, the weight ratio of "HEMA:Bis-GMA" was calculated to be 0.66 in the commercial material.
A formula (F1) was first produced with the "HEMA: Bis-GMA" ratio of the commercial material (=0.66). The H-NMR spectroscopy of that formula showed a signature very similar to the formula of the commercial bonding agent (Fig. 1D).
Four other experimental materials with the same "HEMA:Bis-GMA" ratio were produced. In these five formulas, the variable proportion was the proportion of the photoinitiator and reducing agent. These two components were needed for a proper polymerization of the material. The experimental bonding agent was prepared as follows: At the first stage, the solid phase of the formula, the photoinitiator [camphorquinone (CQ)], was dissolved in the HEMA monomer. After the complete dissolution of the powder, Bis-GMA was added to the solution and blended. Finally, the reducing agent [dimethyl-para-toluidine (DMPT)], which is a flowable liquid, was added to the final system.26 All the procedures were done in a dark room at environment temperature. The materials were stored in completely light- and air-sealed dark glass boxes. The materials were blended with accurate weight ratios, measured using a digital weigh (Libror AEU-210, Lot Number: 97983, Shimadzu, Kyoto, Japan).
The "photoinitiator-to-reducing agent (PI:RA)" proportion plays an important role in proper polymerization of bonding agents.13 Therefore, five different proportions of photoinitiator (CQ) to reducing agent (DMPT) were produced in order to find the optimum formula (Table 2).
The materials' degrees of conversion (DC) were assessed using the differential Fourier transform infrared spectroscopy (FT-IR) method. This was done by assessing their FT-IR spectra before and after light curing them, and comparing their FT-IR signatures with that of the commercial BA (as the control).
Three different formulations with constant PI:RA formulas (based on the best formula [F1]) and variable "HEMA:Bis-GMA" ratios were created (2 new formulas as well as the F1 itself, Table 2).
In order to select the best proportion of "HEMA:Bis-GMA", the three experimental formulas were studied in terms of their DC, shear bond strength (SBS) and their microleakage, while the commercial material acted as the control. The details of these two studies are as follow.
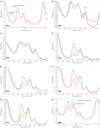
All the seven formulas and the commercial material (as the control) were assessed in terms of their DC. Three specimens were made of each material (n = 3 × 8 = 24). Using the Fourier transform infrared (FT-IR) spectroscopy (Magna-IR Spectrometer 750, Nicolet, Madison, WI, USA), the absorption rate of aliphatic double bond (C=C) that is the peak at 1635 cm-1 and the absorption rate of aromatic single bond (C-C) that is the peak at 1608 cm-1 in each sample was measured before and after light-curing (Fig. 2).
The DCs were recorded for further analyses. The F1 formula had a proper DC and a very low coefficient of variation (Table 3). Therefore, it was selected for further steps.
The sample size for the assessment of shear bond strength (SBS) of experimental versus commercial bonding agents was in accordance with the ISO TR 11405 standard: 120 specimens for the shear bond strength test (15 randomly assigned specimens per group × [4 groups of dentin (3 experimental formulas and 1 commercial) + 4 groups of enamel (3 experimental formulas and 1 commercial)]). The specimens were made of 120 intact caries-free recently-extracted human third molars (extracted for treatment purposes only). The teeth had been rinsed and cleaned off of blood and remaining periodontal tissues and calculi. They had been disinfected using the bactericidal/bacteriostatic solution of 0.5% chloramine for 1 week. Then they were stored in distilled water at 4℃, until being used for the experiments.27
The teeth were sectioned to obtain enamel and dentin disks. Enamel disks were obtained by sectioning through the buccal surface of the teeth. Dentin disks were picked from the tissue farthest from the pulp. These dentin disks were cut from an about 1-mm distance of dentinoenamel junction (DEJ). This was because the dentin layer close to the pulp was not as proper for bonding purposes.27 Each disk had a thickness of 1 mm.
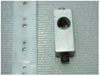
The disks were mounted in a circular metal template (Fig. 3) with a radius of 7.5 mm, using a self-curable resin (Bayer, Newbury, West Berkshire, UK). After removing the fixed specimen, tooth surface was finished using 400-grit silicon papers.27
The experimental and the commercial control bonding agents were cured according to the instructions of the commercial manufacturer: After rinsing and drying the tooth, it was isolated. Then it was acid-etched for 15 seconds and was gently air-dried for 5 seconds. Afterwards, the primer was applied to the surface and was gently air-dried for 5 seconds. The primer of the commercial material (Scotchbond Multi-Purpose Primer) was used for all the tested experimental materials as well. Then the adhesive was applied to the surface and was light-cured for 10 seconds using a quartz-tungsten-halogen (QTH) light curing device (IEC601-1 class I, type BF, Coltolux 75, Coltène, Coltène/Whaledent, Cuyahoga Falls, OH, USA) with a calibrated light intensity of 800 mW/Cm2. Afterwards, a standardized layer of a hybrid composite (Z100) was placed on the enamel and dentin tissues, using a celluloid template with a circular hole (radius = 1.5 mm, Fig. 3). The composite was light-cured exactly according to the instructions of the manufacturer.27
After polymerization, the specimens were removed from the mold and stored in distilled water placed in an oven (WTE Binder, Tuttlingen, Germany) at 37℃, for 13 days.6,27
A shearing rod attached to a universal testing machine (Zwick, Model 1494, Lot Number: Z020, Ulm, Germany) exerted the shear force to the samples (parallel to the flat bonding area), at a crosshead speed of 0.5 mm/min until fracture. The SBS was calculated in Megapascal (MPa) by dividing the fracture load (Newton) by the composite surface area (= 1.5 mm × 1.5 mm × 3.14 = 7.065 mm2).6,27
A stereomicroscope (Olympus szx-12, Olympus, Tokyo, Japan) was used to visualize the fractured surfaces of the specimens at ×6.5 magnification to determine the fracture type.27
An assessment of the microleakage of experimental bonding agents and commercial bonding agent was conducted. The sample size of this experiment was determined according to the ISO TR 11405 standard: 80 junctions [40 enamel junctions and 40 dentinal junctions] on 40 specimens for the microleakage test (10 randomly assigned teeth per group × [4 groups of dentin (3 experimental formulas and 1 commercial)]). Specimens were intact caries-free recently extracted and disinfected maxillary third molars (details similar to the teeth collected for the SBS experiment).
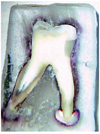
On the buccal or lingual surface of each tooth, a cavity was cut, with the following properties: the gingival floor was 1 mm below the cementoenamel junction (CEJ), occlusogingival height was 3 mm, mesiodistal width was 5 mm, and cavity axial depth was 1 mm into the dentin. The cavity was rinsed, etched, dried, and filled with the same method used for the dentin disks mentioned earlier, except that the composite application differed slightly. The composite was applied incrementally into the cavity, with layers of no thicker than 2 mm. The filling was finished and polished. According to the ISO TR 11405 standard, the teeth were thermocycled for 500 cycles between 5℃ and 55℃. The root apices were sealed. All teeth surfaces except the restoration and a 1-mm margin around it were sealed by two layers of nail varnish. Then, the teeth were merged in 2% fuchsine solution, and were kept at 37℃ for 24 hours. After washing the fuchsine, teeth were merged in transparent resin. They were then sectioned longitudinally. The sections were assessed at occlusal and gingival portions of the filling, under a ×10 stereomicroscope. The ranks were: (0) no dye penetration (Fig. 4); (1) dye penetration less than half of the axial depth; (2) dye penetration more than half of the axial depth, but not reaching the full axial depth; (3) dye penetration partially reaches the axial wall, but does not completely cover it; and (4) dye penetration passes the axial wall and covers the axial wall completely.3,27
Twelve months after the above experiments, the F1 formula that was being stored in a dark bottle was tested again in terms of its DC (using FT-IR).
The DC data were analyzed using the Kruskal-Wallis, Dunn post hoc, and Mann-Whitney U tests. A Spearman correlation coefficient was used to assess the potential correlation between the formulas' materials (as well as the ratios of monomers and also the PI:RA ratio) with DC.
Since according to the Kolmogorov-Smirnov test, the SBS data were distributed normally, parametric tests were used for assessing the SBS values. Data were analyzed using a two-way analysis of variance (ANOVA) and its LSD post hoc test. As well, a Weibull Analysis was used to show the association between the bond failure probability and the magnitude of shear force. Lower m values indicate a broad range of scattered results with a long tail, while greater m values indicate more uniform and reliable results and a shorter tail. The probability of failure was estimated for 5% and 90% of forces. The Spearman correlation coefficient was used to assess the potential correlation between the tissue types and formulas' materials (as well as the ratios of monomers and also the PI:RA ratio) with SBS.
The distribution of mode of failure in different groups was assessed using a chi-square goodness-of-fit test.
The microleakage data were analyzed using the Kruskal-Wallis and Mann-Whitney U tests. The Spearman correlation coefficient assessed the correlation between the tissue types and formulas' materials (and their ratios) with microleakage. The statistics program was SPSS 20.0 (IBM, Armonk, NY, USA). The level of significant was set at 0.05 for all the above analyses.
RESULTS
In the first step, the DC of five experimental agents and one control commercial were compared using the Kruskal-Wallis test (Table 3, formulas 1 to 5). This test detected a significant difference (P=.021) between the DC of the 5 experimental BAs (F1 to F5). The Dunn test indicated that only between F2 and F4, there was a significant difference. The Kruskal-Wallis test taking into account the commercial one (Scotchbond Multi-Purpose) as well, calculated a significant difference between the DC of the 6 groups (P=.022). The Dunn test, comparing each group with the control did not show any significant differences (all five P values >.05). The Kruskal-Wallis test assessing the three formulas (F1, F6, and F7) showed a significant DC difference (P=.032). The Dunn test comparing F1, F6, and F7 showed a significant difference only between the F6 and F7. The Kruskal-Wallis was also used to compare the DC of the Scotchbond Multi-Purpose with the three experimental formulas (F1, F6, and F7). The comparison was significant (P=.042). The Dunn test did not identify any group as different from the control. The Kruskal-Wallis test also compared all the 8 groups together, and detected a significant difference among the DCs (P=.008). However, the Dunn test did not indicate any groups significantly different from the control. The results of the Mann-Whitney U test (comparing with the control) are demonstrated in Table 3.
The F1 formula after one year showed DC results not statistically different from the same formula tested one year ago according to the Mann-Whitney U test (P=.376).
The Spearman correlation coefficient did not show a significant correlation between the DC with Bis-GMA and HEMA, or their ratio. However, a marginally significant (and given the small sample size, a noteworthy) correlation was observed for CQ, DMPT, and their ratio (the Rho values = -0.358 for CQ and CQ:DMPT and +0.358 for DMPT, all the three P values =.111).
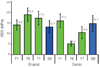
For the shear bond strength test, the two-way ANOVA indicated a significant difference between the two tissues (dentin vs. enamel, P=.0001) in a way that dentinal bonds were weaker. However, there was no difference between the SBS of the four materials (P=.283). The interaction of tissue and material was significant (P=.0000), meaning that the effect of BAs differed on each tissue type (Table 4, Fig. 5). The LSD post hoc test did not detect any differences between the groups of materials' SBS means.
The Spearman correlation coefficient did not show any significant correlations between the SBS and the materials' formulas (the percent of monomers and PI and RA, as well as the ratios of monomers and the PI:RA ratio) (all Rho values between 0.1 and -0.1, all P values >.5). However, there was a significant correlation between the tissue type and SBS (Rho = -0.350, P=.000).
The adhesive mode of failure was predominant in most of the groups (Table 5).
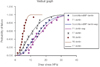
The Weibull analysis of SBS on dentin indicated a high reliability of overall results (according to the r2) and various Weibull moduli, with F6 having the most reliable result and F1 as having the best stress resistance. This formula (F1) had also a proper Weibull modulus (Table 6, Fig. 6).
In the microleakage test, the Kruskal-Wallis test did not detect any difference between the four bonding agents at occlusal (P=.788) or gingival (P=.508, Table 7) sites. The Mann-Whitney U test showed a significant difference between the microleakage of all materials together at the occlusal site versus the gingival site (P=.041). The Spearman coefficient did not show any significant correlations between the microleakage and the materials' formulas either on dentin or on enamel, or on both together (all Rho values between 0.16 and -0.16, all P values >.3). However, there was a significant correlation between the tissue type and SBS (Rho = 0.230, P=.040).
DISCUSSION
The results of this study indicated that the first experimental formula (62% Bis-GMA, 37% HEMA, 0.3% CQ, and 0.7% DMPT) which resembled the commercial material had an optimum characteristic. Other formulas might have better degrees of conversion or shear bond strengths on enamel, but their SBS was less on dentin. The F1 formula as well showed a proper microleakage and also showed a proper lack of autopolymerization during room storage, since its DC had not reduced after one year.
One of the most important determinants of a proper DC is the amount of photoinitiator, which is usually CQ at amounts between 0.17% to 1.03 weight percent.28 The DC might range between 55% and 75% because dimethacrylate monomers might exhibit considerable residual unsaturation.13,14,15,16,17 Reducing agent is added to the system to boost the effect of photoinitiator, and can improve the DC considerably.29 Most of the experimental formulas in this study revealed proper DC rates, except F2 and F7 with PI:RA ratios of 1.0 and 3:7, respectively. The latter was the ratio available in F1 as well; however, in F1, a proper DC (66%) was observed. This difference implied that not only the PI:IR ratio plays a role in DC, but also the ratio of HEMA:Bis-GMA is important to DC. Nevertheless, the statistical analyses implied that if something matters, it is not the monomers, but CQ, DMPT, and their ratio, in a way that more DMPT and less CQ could cause a higher degree of conversion; although this needs larger samples. Low CQ values have other advantages as well. The amount of CQ should be kept at the lowest possible to prevent discoloration.28 Excess photoinitiator amounts might also disrupt shelf life and also might reduce the biocompatibility.30 Another factor to determine the proper CQ amount is the coefficients of variations of the DCs of the materials. F1 and F4 had the lowest (and best) CVs. Since F1 had a less DC amount, it might favor its clinical usage.
The limitation of this part of the study was the rather small sample size. However, given the extensive total size of the study and the limited budget, it was not possible at the moment to conduct more FT-IR experiments. Besides, this method is very accurate and is not usually done in a large number of repeats.
F6 showed a very high enamel SBS. However, it had the lowest dentinal bond strength, which is always a more important determinant for selecting BAs. This is because enamel bond is already stronger and more predictable than dentinal bond strength, being reported as usually about 15 to 30 MPa.6,31,32 Thus it is much simpler to obtain that dentinal bond, especially with its heterogeneous structure, the flow of tubular fluid, having more organic content, and being covered by a smear layer.3,33,34 Therefore, the bond strength of composite resin to dentin may be weaker.3,34,35 Therefore, F1 seemed the most appropriate material in terms of SBS. This was confirmed by the Weibull analysis. The Weibull probability of failure might be a proper substitute for analyzing SBS data and may be useful in selecting less technique sensitive materials or methods.6,36 In this study, the lowest probability of failure was obtained in F1. However, the bond strengths of all experimental groups fell within the acceptable range.6 F1 had the highest Weibull modulus (m) after F6. A higher "m" means a proper reliability of the results. Besides, F1 had the highest value of normalizing parameter, which meant a less probability of failure for a given stress.
This section of the study could be as well benefited by thermocycling which might negatively affect the SBS.5,37 However, water storage was used as the aging protocol. Besides, a very large sample of human teeth could improve the reliability and generalizability. Human enamel contains less lattice defects and smaller crystal grains than bovine teeth, which might affect the findings related to SBS.5,38 Therefore, using a large sample of human teeth might be advantageous.5
Failure modes indicate that materials with high bond strengths show cohesive failure through the composite. However, materials with low shear bond strength might show adhesive failure rather than cohesive failure. Fractures within the composite resin (cohesive failure) seem to be more appropriate for bearing occlusal loads.6,39 All the cases except F1 bonded to the dentin showed significant predominance of adhesive failure. It cannot be certainly determined using a light microscope whether failure was truly adhesive.6
Microleakage test is an important in vitro test of dentin bonding agents.29 All the materials acted well on this test. No significant difference was observed in the microleakage of all the four formulas (Scotchbond Multi-Purpose, F1, F6, and F7) either at the dentin junction (the gingival site) or the enamel junction (the occlusal site). This might be related to the similar primer of all the formulas, and was consistent with the results of another study comparing BAs from fourth and fifth generations.40 However, there was a difference between the microleakage extents at the enamel versus dentin junctions. Due to the high mineral content of the enamel as well as its crystal structure, enamel etching may efficiently alter its surface profile by increasing the depth and number of micropores which leads to stronger adhesive tags and reduced gap size.3,41,42 However, at dentinal margins, the bonded composite had poorer results. Due to its organic matrix and having a lower fraction of mineralized content, dentin is naturally wet which this may interfere with bonding to a hydrophobic material.3,33,34
This part of the study was limited by some factors. Fuchsine solution varies in viscosity and other characteristics from saliva.3 However, the authors tried to increase the validity and reliability of the results by sampling several human teeth and aging them.3 Besides using many human teeth was an improvement over some recent studies that had used a smaller sample of bovine teeth.43
CONCLUSION
Considering its proper degree of conversion, its proper microleakage, and its proper shear bond strength and modes of failure on both enamel and dentin, The F1 formula with 62% Bis-GMA, 37% HEMA, 0.3% CQ, and 0.7% DMPT seems a proper formula for mass production of bonding agents. Also, the percentages can be even more fine-tuned with creating slightly different formulas and testing them again. Additionally, more experiments such as evaluating its performance under different temperatures and using different light curing units are warranted. The microleakage was higher at the dentinal junction compared to the enamel junction. The shear strength of bonds to the enamel was greater compared to dentin. No correlations were observed between the SBS or microleakage with Bis-GMA, HEMA, CQ, or DMPT. However, the degree of conversion might benefit from a less amount of CQ and a higher amount of DMPT, although this pilot implication was not statistically confirmed and needs studies with a larger sample size and with a greater range of changes in CQ/DMPT values for confirmation.


 XML Download