

 PDF
PDF ePub
ePub Citation
 Print
Print


INTRODUCTION
Color change assessment is a complex and psycho-physiological process which depends on many variables. The dentin tissue which shows variable translucency and has various thickness is considered to be the main source for tooth color. The perceived tooth color is a result of returning light which reflects from the enamel surface and comes out inside the enamel and dentin.1 The color of the ceramic restorations is affected by various factors such as brand,1,2,3 thickness of the layered the ceramic,3 condensation techniques,2 smoothness of surface,4 number of firings5,6 and firing temperature3 and thickness of dentin.7,8 External view of the layered ceramic may show a specific variability depending on the thickness of the core and veneering ceramic. If the thickness of ceramic is insufficient, it becomes hard to achieve clinically the ideal color. In previous studies,9 it was reported that the feature of translucency10 and shade of ceramic11 may depend on the type and the thickness of ceramic material.
In certain studies,5,6,12,13 the effect of the number of firings on color change was investigated and it was generally found that the color didn't change noticeably. However, in other studies,2,14,15 it was considered that the noticeable color change occurred as a result of repeated firings.
The most accurate and objective evaluation of color differences can be made by devices such as colorimeter and spectrophotometer.16,17 In dentistry, the results of color measurements are variable because standardized illuminating light may spoil, move to incorrect directions, may be absorbed, transmitted and reflected while diffusing from the colorimeter due to translucent and optical properties of tooth and dental ceramics.18
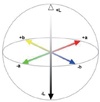
The determination of color change is usually performed using the Commission Internationale de I'Eclairage (CIE) color system (Fig. 1). This system shows the color parameters (L*, a*, b*) and the color change (ΔE).19,20 ΔE value reports whether or not there is a color change that noticeable for human eye. If ΔE value is more than 1, the color change can be noticed visually by %50 of human beings. However, because of the uncontrolled factors in oral environment, the color change is clinically acceptable, if the ΔE value is 3.7 and less.20,21
In CIELab system, all colors relatively matches with the mixture of mainly red, green and blue. The values of blue, green and red have been mathematically converted into L*a*b* scale and the space of color have been determined. L* axis gives the coordinates of lightness and darkness and these coordinates change between 0 (extremely dark) and 100 (extremely light). Negative a* axis gives chromatically the green and positive a* axis gives chromatically the red. The positive b* axis gives chromatically the yellow and negative b* axis gives chromatically the blue.22,23
The surface of dental restorative materials needs to be polished and smooth; otherwise, rough surfaces result in decreased in flexural strength,24 increased surface staining on teeth due to the increased abrasion in opposing tooth surfaces25 and accumulation of plaque and calculus.26,27 As a result, the susceptibility to infection in oral soft tissues and caries increases28,29 and the esthetic quality of the restoration can decrease.30 Smoothness of dental ceramics may be achieved by glaze method. The glaze method involves subjecting dental porcelain to temperatures that are 20℃ to 60℃, lower than the fusing temperature of the porcelain.31,32
The aim of this study was to evaluate the color change and surface roughness in dental porcelain with different thicknesses during repeated firings. The null hypothesis of the study is that the repeated firings significantly affect the color and the surface roughness of the restorations. Repeated firings also damage surface characteristics and dentin thickness of the restoration may spoil ideal color of porcelain.
MATERIALS AND METHODS
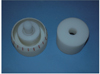
Totally 21 disc-shaped metal-ceramic samples (IPS Classic, Ivoclar Vivadent, Shaar, Liechtenstein) were prepared. Base-metal alloy (Colado NC, Ivoclar Vivadent, Shaar, Liechtenstein) containing nickel-chrome with 0.5 mm thickness was used as substructure. A custom made two-pieces teflon mold which allows the standardization33 was used for preparation of the samples (Fig. 2). First piece had a 10 mm diameter piston which attached to cylindrical cavity of the second piece with a screw system and could rise and descend in the cavity. First part was divided into 10 equal ranges with this screw system. When it was calibrated based on zero point, piston was moves downward with a sensitivity of 0.1 mm with one unit turn and piston was descended 1.0 mm with 10 turns. The piston adjusted to the depth of the cavity, attached lower piece was turned about amount of the necessary volume and the needed ceramic thickness was determined. Veneering porcelain was condensed and hand vibrated; excess moisture was removed with absorbent paper tissue to minimize porosity and then firing process was performed according to manufacturer's instructions (Ivoclar Programmat P90, Ivoclar Vivadent AG, Schaan, Lichtenstein).
The samples were divided into 3 groups (N=7) according to dentin thicknesses. The total thickness of the discshaped metal-fused porcelain samples were arranged 1.4 mm for 1st group, 1.7 mm for 2nd group, 2 mm for 3rd group.
For glaze process, the glaze paste and liquid were mixed on a clean glass slab and applied to the all sample in a homogeneous texture by one experienced clinician. The glaze process was conducted in accordance with manufacturer's instructions.
The first glazing processes for each group were determined as control firing group. Then, every sample was subjected to repeated firings up to seven times. The glaze paste smeared on the surfaces of samples before each firing. Color measurements were performed and recorded for each sample in control groups (C), 1st, 3rd, 5th and 7th firings.
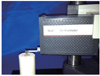
Color measurement of the samples was made using a colorimeter (Minolta CR 321, Konica Minolta, Tokyo, Japan) (Fig. 3). Color measurement was performed from 3 different points of each sample. The instrument calibration was evaluated after the measurement of each group and then the instrument was recalibrated. The CIE Lab values of measurements of each sample were determined and recorded.
The color analysis of samples was made for control, 1st, 3rd, 5th and 7th firings. Total color differences (ΔE) were calculated using the following equation : ΔE* = [(ΔL*)2 + (Δa*)2 + (Δb*)2]1/2. ΔL, Δa and Δb are the differences in the CIE color-space parameters of the 2 colors.33
A Perthometer M2 (Mahr GmbH, Göttingen, Germany) (Fig. 4) device was used to determine surface roughness. In this study, the measurement rate was designated as 5.6 mm, the cut off value as 0.25 mm, and sampling width as N=5. The mean surface roughness (Ra) values of every sample were recorded. The measurements were carried out at the central positions of the samples.
Statistical analysis of the results for the repeated measurements was performed using ANOVA test. The Tukey test was used to determine whether the differences originated by conjunction. ANOVA and Tukey tests were performed for each color changes value (ΔE) and surface roughness value (Ra) using SPSS 11.5 (SPSS Inc., Chicago, IL, USA).
RESULTS
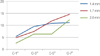
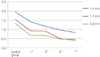
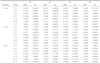
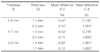
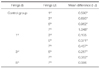
According to the repeated firings and thickness, results of color change characters (ΔL, Δa, Δb) and the color change (ΔE) were showed in Table 1 and results of surface roughness were showed in Table 2. ΔE value showed the minimum value at first firing after control firing in samples with 2 mm-thickness (2.59)(Fig. 5). ΔE values were below 3.7, clinically acceptable, only for 3rd-5th and 5th-7th firings of 1.4 mm thickness and C-1st and 3rd-5th firings of 2 mm thickness. When passed on the 3rd firing from control, ΔE values raised in all porcelains and this rise increased as the number of firings increased. Surface roughness (Ra values) were decreased for all groups during the repeated firings and Ra value showed minimum value at 7th firing of 1.7 mm thickness (Fig. 6). According to the results of ANOVA test; findings were statistically significant for the test conducted (P<.05). The confidence interval for the ANOVA test was determined as 95%. The number of sub-units in each groups was determined as N=7. Tukey tests were also supported the results of ANOVA. Generally, the analysis of the color parameters, the ΔE-color changes and the Ra-average surface roughness values in terms of different thickness showed statistically significant results (P<.05) (Table 3). Analysis of the Ra-average surface roughness values in terms of repeated firings were found statistically significant (P<.05)(Table 4).
DISCUSSION
The null hypothesis of the study, the porcelain thickness and repeated firings significantly affect the color of the restoration and they damage surface characteristics of porcelain, was sustained. The colors of metal-based ceramic samples used in this study were affected by firings. However, the color change was at clinically acceptable level when the metal-based porcelain with ideal thickness (2 mm thickness of porcelain together with 0.5 mm metal substructure) was glazed once again after the first glaze. In the other firings and porcelain thicknesses excluding the one mentioned above the color change reached undesirable levels. This reports us that the porcelain thickness is very important in metal-based ceramics and repeated firings should be avoided. When the changes in ΔE value between repeated firings were examined it was seen that the values generally changed between 2.59 and 14.59 (Table 1).
ΔL is a parameter that measures the amount of lightness-darkness of color. In present study, ΔL* value increased as the number of firing increased, the reason was probably devitrification and opacity of porcelain surfaces. When the ΔL values between control and 1st firing groups were evaluated it could be remarked that ΔL value didn't change so much, but ΔL values between control and the other firing groups (1st, 3rd, 5th and 7th) were increased remarkably. However with the increased number of firings as result of the increase of the ΔL* values the least affected group is the group with 2 mm thickness of porcelain.
When the Δa color parameter was evaluated, the difference between control and 1st firings was minimal. Δa values increased for 1.4 and 1.7 mm thickness and decreased for the 2 mm thickness with increased number of firing. This value especially showed upward tendency in porcelains especially with 1.4 and 1.7 mm thickness as the number of firing increased, however for the porcelains with 2 mm thickness, this value showed minimal difference. Generally, the Δa values showed negative tendency but the Δa results for porcelains with 2 mm thickness were not so significant and it was not at clinically critical level.
The a* value is related to the red-green parameter of color and in present study, Δa showed negative values and the green character of color was clarified for the samples with 1.4 and 1.7 mm thickness. The b* value indicates the yellow-blue characters, therefore in present study, as Δb shifted to negative, the color at firings following the 1st repeated firings showed a tendency to blue in the samples with 1.7 and 2 mm thicknesses and to yellow in porcelains with 1.4 mm thickness. Moreover, the results of Δa and Δb showed that the porcelain thickness was important. If porcelain got thinner discoloration occurred, additionally that the great number of firing affected the color negatively, however they also showed that only the 1st repeated firing did not noticeably damage the color components.
The repeated firings may cause opacity and, to minimize this, repeated firings should be avoided and, in this respect, especially the preparation of porcelain at the ideal thickness is an important factor.
The color change occurs because repeated firings affect metal oxides in porcelains.34 In previous studies, it was stated that metal oxides did not have stable structures and firing temperatures broke pigments and the color change occured.35,36 In present study, the color parameters changed parallel with the other studies. Mulla and Weiner,37 reported that color change occurs especially after the first firing same with our study. These changes were mostly towards orange and blue. Ozturk et al.15 stated that repeated firings and various dentin thicknesses changes ΔE value higher than 3.7 in IPS e-max porcelains and yellow component of color became noticeable. These results are similar with our study and yellow component of color became clear in samples with 1.4 mm thickness after 1st additional firing.
When Ra which shows the average roughness of surface was evaluated, it was seen that average-Ra in the porcelain with 1.4 mm thickness was 1.95 µm in control step. It decreased to 0.82 µm in 7th firing and roughness moved to smoothness as the number of firing increased. Likewise, Ra in porcelains with 1.7 mm thickness decreases from 1.54 µm to 0.4 µm, Ra in porcelains with 2 mm thickness decreases from 1.32 µm to 0.45 µm. That is to say; surface roughness decreased as the number of firing increased regardless of thickness. However this decrease occurs because of detrimental-physical effect of excessive firings on surfaces. The number of firings increased the surface smoothness; however as this situation occurred by deforming the porcelain repeated firings are not desired for metal based porcelains and if needed, only one repeated firing can be made after the 1st firing. It can be concluded that as firings increased the surface smoothness gets noticeable in the porcelains with 1.4 and 1.7 mm thickness, this increase wasn't so distinct in the porcelains with 2 mm thickness. This condition reports us that if the porcelain is thinner than it should be, it can be affected more by the repeated firings and probably can deteriorate more. Therefore, as it is in the results of color analysis, it is very important that the porcelain thickness should be in optimal level.
Generally, ΔE increased as the number of firing increased and Ra values decreased in inverse proportion and the porcelains with 2 mm thickness showed the best results in terms of porcelain aesthetic and its ideal physical features.
The effect of factors such as thickness and repeated firings on color and surface roughness indicates color change. Cubas et al.38 stated that there was significant changes in color parameters together with the increase in the number of firings, which is in accordance with the present study. The changes in parameters revealed improper values in ΔE in Cubas et al.'s38 study, parallel to present study. Yılmaz et al.39, reported that repeated firings significantly changed the color of a dental ceramic in 3rd and 4th firings. In present study, the color change occurs in initial firing after the 1st repeated firing.
As the number of firings increases, dimensions of the pores cause an increase at the rigidity of porcelain and a decrease at the flexibility of porcelain. Repeated firings also cause porcelain's color pigments to burn and create devitrification. Barghi40 researched the effect of repeated firings on color and glaze and found that after nine firings, a natural glaze layer appears on the surface and the choice of metal alloy did not affect the color or glaze. Mackert and Williams41 researched the effects of repeated firings on the formation of micro fractures in the porcelain and they concluded that repeated firings affected the frequency of micro fracture after 1st, 3rd, 7th and 15th firings, but this finding was not clinically significant.
Barghi40 stated that the glazed layer melted to some extent, and by filling the gaps on the surface, it increased the smoothness. Yılmaz and Ozkan42 further stated that the best material in terms of surface smoothness was found to be IPS Classic, a metal-reinforced ceramic of feldspathic structure, and the best method was found to be the glaze method. As the number of firings increased, the surface roughness decreased. The decrease in surface roughness and increase in smoothness during repeated firings deform the glaze layer, in turn altering the surface form. In present study, in a parallel with Yılmaz and Ozkan's42 study, as the number of firings increased the surface roughness decreased in the same way glaze layer deteriorated.
In order to obtain a natural appearance in ceramic restoration, it is need to combine porcelain layers which have different opacity and color. Most ceramics consisted of two layers one of which is a strong substructure and the other is a weaker veneer porcelain which has different opacity, color and thickness in order to keep the aesthetic appearance.43 The thickness of core, veneer and other ceramic materials, which occurred the result of this ceramic combination was indicated as a critical point for the final appearance of all-ceramics44,45 or metal-ceramics.12,13 Shokry et al.8 examined the effect of thickness on color and stated that when thickness increased the ΔE value changed and it was found that core/veneer relationship affected a* and b* values. Jalali et al.43, reported that thicknesses and substructure caused a detectable color mismatch in clinically relevant core-veneer thicknesses of IPS Empress 2. As parallel to Shokry et al.8 and Jalali et al.,43 in present study, thickness is a significant factor and when thickness decreased the ΔE value changed more and a* and b* values were affected more by this condition.
In dentistry, the results of the colorimeter device may be variable since the standardized light may be corrupted, absorbed, transmitted and may move to wrong directions because of the translucent, optical features of tooth and dental ceramics.18 However, with the use of these small aperture devices, a considerable fraction of the light entering the material assessed is lost, because it emerges on the surface outside the window of measurement. This loss of light is termed edge-loss, and may be a cause of color measurement errors.18,23,42 The edge-loss effect may occur particularly when translucent materials are used and the diameters of the materials are smaller than diameter of the colorimeter.23,42 The materials used in the study were translucent and this can affect the results of the study. Therefore, increasing the number of both clinical and laboratory studies using various assessment devices and examining the color measurement of devices such as colorimeter and spectrophotometer will be useful.
CONCLUSION
Repeated firings significantly affected the ΔE-color changes and the Ra-average surface roughness values (P<.05). The repeated firings increased the surface smoothness but they caused deterioration on the surface.
As the number of firings increased surface features became clinically undesired levels.The firings deteriorated the color features of porcelain and this was the primary factor for the color change.
The ΔL* values were prominently increased by repeated firings. However, if it is necessary, only one additional firing is not seen as a serious problem for ΔL* value of the porcelains with 2 mm thickness. The Δa* value for the porcelains with 2 mm thick-ness was not affected by firings. However it is not the same for the other samples.
The Δb* value, was not affected by the 1st firings but Δb* values were significantly affected by repeated firings of porcelain with 1.7 mm thickness. If the total thickness of porcelain is less than 2 mm (together with the 0.5 mm metal substructure), repeated firings will have significant detrimental effect on the surface properties and color of porcelains. Therefore, repeated firings should be avoided.


 XML Download