MATERIALS AND METHODS
Sixteen groups of experimental alloys with varying proportions of Cu, Al and Ni were prepared, and the details of all groups are summarized in
Table 1.
Highly purified (>99.99%) copper droplets, and aluminium and nickel beads (Wako Pure Chemical Industries Ltd., Chuo, Osaka, Japan) were used in this study. Each group weighed 35 g, with the calculated amounts of all elements established by using an analytical balance (Precisa 262 SMA-FR, Precisa Instruments AG, Dietikon, Switzerland). The elements were melted together inside a 25 mm diameter cylindrical graphite crucible, contained within a fused silica crucible sleeve, using a vacuum induction casting unit (Linn HFS 3 Vacutherm, Linn High Therm GmbH, Eschenfelden, Germany). The vacuum was measured at approximately 50 mbar, and ultra-high purity argon was then fed in during the procedure. The ingot was bench-cooled within the crucible, and covered with a graphite cap.
The alloy compositions were determined after melting using a scanning electron microscope (JSM 4510 LV, JEOL Ltd., Akishima, Tokyo, Japan) and energy dispersion scanning (INCA x-act, Oxford Instruments PLC., Abingdon, Oxfordshire, UK). The solidus, liquidus and melting range of each alloy was evaluated using a differential scanning calorimeter (DSC8270, Rigaku Corporation, Shibuya, Tokyo, Japan). Approximately 1 g of each sample was heated at a rate of 10℃/min, extended to 1300℃. The measurements were made using "d*TREK" software (Rigagu Corporation, Shibuya, Tokyo, Japan) on six samples for each group.
A 'PMMA sheet' (Sumipex TL, SumiplexTechsheet Co., Ltd., Kaosiung, Taiwan) was cut into smaller specimen patterns, 10 mm × 10 mm × 2 mm, to be used for corrosion, hardness and static immersion testing. The tensile dumbbell preformed patterns, with a screw threaded end, diameter of 3 mm and 18 mm in gauge length, in accordance with ISO standard (ISO 22674:2006),
11 were constructed in a split-silicone mould (Xiameter RTV-3481, Dow Corning Corp., Midland, MI, US) using an acetal copolymer rod (Ertacetal C, Dotmar EPP Pty. Ltd., Acacia Ridge, QLD, Australia), and combined the screw thread via the injection of a molten blue inlay wax (Type II, Class I, Kerr Corporation, Romulus, MI, USA).
The whole patterns were constructed and invested in cristobalite investment (Cristobalite PF, Shofu Incorporated, Higashiyama, Kyoto, Japan) using a vacuum mixing device (Vacuret-S, ReitelFeinwerktechnik GmbH, Bad Essen, Germany). The casting of all specimens was performed in a vacuum induction casting unit (Linn HFS 3 Vacutherm, Linn High Therm GmbH, Eschenfelden, Germany). Five impeccable specimens were prepared from each alloy for each test.
Five specimens (10 mm × 10 mm × 2 mm) of each group were mounted in epoxy resin (EpoKwick, Buehler, An ITW Company, Lake Bluff, IL, USA). The surface of each specimen was flattened and finished using a metallographic grinder/polisher (Rotopol-21, Struers A/S, Copenhagen, Denmark) through a standard metallographic procedure, starting from FEPA P 200 to FEPA P 2000 silicon carbide paper (CarbiMet 2, Buehler, An ITW Company, Lake Bluff, IL, USA), and finished with 1 µm diamond paste (Meta DI, Buehler, An ITW Company, Lake Bluff, IL, USA).
The surface hardness was determined using a microhardness tester (FM-700, Future-tech Corporation, Kawasaki, Kanakawa, Japan) via a Vickers' indenter controllable load of 1 Kgf for 15 sec. Five readings were carried out in the center and the corner regions of each specimen. All records were collected and analyzed statistically.
Five dumbbell specimens were loaded in tension using a universal testing machine (Model 5566, Ins t ron Corporation, High Wycombe, Buckinghamshire, UK) at a crosshead speed of 1.5 ± 0.5 mm/min at room temperature (23 ± 1℃) until a fracture occurred.
The ultimate tensile strength, proof strength at a 0.2% offset, modulus of elasticity and the percentage elongation were determined and recorded.
Two square specimens (10 mm × 10 mm × 2 mm) from each group were attached with stainless steel nuts using conductive silver epoxy resin (Fast Setting #05062-AB, SPI Supplies/Structure Probe Incorporated, West Chester, PA, USA). Next, the whole assembly was covered with an electrically insulating epoxy binder (UHU 2, Adhesives, UHU GmbH & Co. KG, Bühl/Baden, Germany) also embedded in epoxy resin (EpoKwick, Buehler, An ITW Company, Lake Bluff, IL, USA). The exposed surfaces of the embedded specimens were prepared with a grinder/polisher (Rotopol-21, Struers A/S, Copenhagen, Denmark) using a standard metallographic procedure, ending with FEPA P 4000 wetted silicon carbide paper. The exposed area of the test specimens was approximately 100 mm2. The specimens were then ultrasonically cleaned in 95% ethanol for 1 minute.
The experiment was carried out in a 0.9% sodium chloride electrolyte (pH 7.4 ± 1), within double-walled corrosion cell at 37℃, using a saturated calomel electrode (SCE) and platinum wire as a reference and counter electrode. The temperature was controlled via circulated water passing through the cell wall, using a thermostatically controlled water bath (A10, Thermo Scientific Incorporated, Waltham, MA, USA). The electrodes were connected to a Potentiostat/Galvanostat (Solartron 1285A, Farnborough, Hampshire, UK). The measurement was monitored using electrochemical software (CorrWare and CorrView Version 3.20b, Scribner Associates Inc., Southern Pines, NC, USA).
Bubbled nitrogen gas was then produced through the electrolyte, at a rate of 100 cm3/min for at least 30 minutes, and then streamed into the cell. The open circuit potential (Eocp) was registered for 2 hours. Subsequently, the potentiodynamic was scanned for 5 minutes after finishing the Eocp measurement, at a rate of 1 mV/sec from -150 mV of Eocp up to a potential of +1000 mV. The curvature of the Eocp, in mV (SCE), versus time, and the curve of potential versus the logarithm of current density, were both recorded.
Two quadrilateral specimens from each group, with a total surface area of approximately 200 mm2, were blasted using standard metallographic procedures, in order to remove the surfaces at least 0.1 mm of material. Finally, FEPA P 4000 wet silicon carbide paper was employed. The surface area of each specimen was recorded, ultrasonically cleaned in 95% ethanol for 1 minute, rinsed in distilled water, and then dried with oil-free compressed air. An aqueous solution comprising 0.1 mol/L lactic acid and 0.1 mol/L sodium chloride, with a pH value in the range of 2.2 to 2.4, was prepared immediately before use.
A 100 mL bottle (SCHOTT Duran, Duran Productions GmbH & Co. KG, Hattenbergstraße, Mainz, Germany) was used to contain the aqueous solution. Each test specimen was suspended by being hung on nylon strings in separate bottles, at 37 ± 1℃, for 7 days. The bottles were tightly sealed to prevent evaporation. After 7 days all specimens were removed, and the test solutions were collected and analyzed separately using Atomic Absorption Spectrometry (Varian SpectrAA-200, Varian Semiconductor Equipment, Gloucester, CA, USA). The values of each observed element were recorded in µg/cm2/7d.
Six specimens from each group were cut from the sprues of the dumbbell casting. All sides of the specimens were removed using FEPA P 1000 silicon carbide paper, in order to create sample discs measuring 5 mm diameter and 1mm thickness. The specimens were ultrasonically cleaned in 95% ethanol for 1 minute, rinsed with distilled water and then dried with oil-free compressed air.
The cytotoxicity was tested following the general guidelines presented in ISO 10993-5:1999.
12 The L929 (NCTC Clone, ATCC Lot. 2869501, Passage No. 556, American Type Culture Collection, Manassas, VA, USA) was used for the cell line. The monolayer of cell line was suspended in 3% agar (Calbiochem 12177 Agar, Merck KGaA, Darmstadt, Germany) in order to obtain a final concentration of approximately 3 × 10
5 cells/mL, and was prepared in a 90 mm diameter culture dish (Corning Dish, Corning Incorporated, Corning, NY, USA). Ten milliliters of L929 cells, with an intensity of 2.5 × 10
5 cells per cm
3 in a completing cultured DMEM medium (Gibco DMEM, Invitrogen Corporation, Carlsbad, CA, USA), were then applied into the dish. The dish was incubated in a CO
2 incubator (Thermo Scientific Forma Series II, Thermo Fisher Scientific Incorporated, Marietta, OH, USA) with 5.0% CO
2 and 95% relative humidity, at 37℃, for 24 hours. The cell style developed as a monolayer, and then removed the cultured medium. The culture dish was then refilled with new more of the agar cultured medium with contains completed 2×DMEM medium and 3% agar. The cultured dish was left until the agar cultured medium became stiff, and it was then dyed with 1% neutral red indicator (C
15H
17CIN
4, C.I. 50040, Merck KGaA, Darmstadt, Germany). The area within the cultured dish was then divided into 4 sectors (testing zones), and controlled specimens of positive disc (Polyurethane film-ZDEC: RM-A, Hatano Research Institute, Kanakawa, Japan) and negative disc (Thermanox, Thermo Fisher Scientific Incorporated, New York, NY, USA) were located on the upper right and upper left testing zones, accordingly. The bottom two testing zones provided the sample discs. The culture dish was again incubated, in an incubator with 5.0% CO
2 and 95% relative humidity, at 37℃, for 24 hours. The decolorized zones and cell lysis were recorded under an inverted phase contrast microscope (Eclipse TS100, Nikon Corporation, Chiyoda, Tokyo, Japan). Consequently, the ratio of the decolorized zones and the cell lysis were both calculated as a cell response.
The data of the hardness, tensile strength, 0.2% proof stress, modulus of elasticity, percentage elongation and thermal property of the experimental alloys were analyzed using the two-way analysis of variance and Tukey's test, at a significance level of 0.05 (PASW Statistics 18.0.0, SPSS Inc., Chicago, IL, USA).
RESULTS
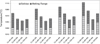
The solidus and liquidus points increased as the nickel content increased. The influence of aluminium content was significantly higher when the aluminium content was at its lowest (3 wt% Al) as depicted in
Fig. 1. The Cu-3Al-6Ni alloy showed the highest solidus and liquidus points (1069.2 ± 0.3℃ and 1113.4 ± 1.5℃, respectively). Additionally, the lowest solidus and liquidus points, with the same nickel content, were exhibited by the 9 wt% Al alloy.
The widest melting ranges (46.3 ± 1.4, 35.1 ± 0.5, 32.7 ± 2.0 and 44.2 ± 1.7℃), with the same nickel content, were measured in the alloys with the lowest aluminium content (3 wt% Al). Likewise, the narrowest melting ranges (27.7 ± 0.1, 28.9 ± 0.2, 26.9 ± 1.1 and 29.1 ± 0.1℃) were found in the alloys with the highest aluminium content (12 wt% Al). Accordingly, the melting ranges of the alloys decreased when the aluminium contents were increased. Furthermore, the melting ranges of the alloys with the same nickel content significantly decreased, once the content of aluminium reached more than 6% (
Table 2).
According to the worst castability of the Cu-12Al-6Ni alloy, those castings could not be completely produced in this group. The physical and mechanical properties of this alloy were therefore discarded.
The surface hardness was influenced by both factors and their interaction which, correspondingly, increased as both elements increased. Aluminium demonstrated a higher degree of increase rather than nickel. The highest surface hardness (305.9 ± 2.5 HVN) was revealed in the Cu-12Al-4Ni alloy (
Table 3).
The tensile strength was influenced by both factors without any effect upon interaction. It increased as the both elements increased. Again, Aluminium showed a higher degree of increase rather than nickel. The highest ultimate tensile strength (595.9 ± 14.2 MPa) was shown in the Cu-12Al-4Ni alloy.
Similarly, 0.2% proof stress was influenced by both factors and their interaction. The alloy with the highest aluminium content (12 wt% Al) showed a significant increase in the 0.2% proof stress, but the elongation was extremely limited.
Table 4 shows the results of cytotoxicity of the cells in the experimental alloys. All alloys exhibited moderately cytotoxicity, similar to the conventional alloys used in dentistry.
13,
14 However, the higher content of nickel showed more decolorization zones. The highest content of nickel (6 wt% Ni) showed the widest decolorization zone (5.0-5.9 mm) that caused the decolorization index up to level three. This confirmed the negative effects of nickel in its biocompatibility.
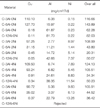
As shown in
Table 5, the elution of copper (0.18, 0.45, 0.91 and 0.37 µg/cm
2/7d) seems to be faded out, when the aluminium content is increased to 9%. This result confirmed that aluminium was acting as a tarnished protector of the copper alloys. The amount of nickel leasing out increased when the nickel contents were increased. The lowest value (1.14, 5.45 and 6.13 µg/cm
2/7d) was demonstrated in the 6 wt% Al alloys. Nevertheless, within the same nickel content alloys, the overall number of elements leasing out in 9 wt% Al groups (62.28, 20.31, 34.34 and 36.42 µg/cm
2/7d) were lower than the others, and the Cu-9Al-2Ni alloy also demonstrated the lowest value (20.31 µg/cm
2/7d).
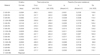
The kinetics, thermodynamics and passivity of the experimental alloys are shown in
Table 6. The open circuit potentials (
Eocp) of the 9 wt% Al alloys (-214.4, -218.5 and -222.1 mV, SCE) existing have higher a potential than the others within the same groups, once the nickel content drops to less than 6%. Similarly, the corrosion potential (
Ecorr) of these alloys (-281.6, -248.2 and -247.8 mV, SCE) exhibits the same manner as the open circuit potential (
Eocp).
The potential of the passive region (Ep) specifies the stability of the passive film, the higher value the better. The 6 wt% Al alloys presented the least value (94.1, 89.6, 84.7 and 116.5 mV, SCE) within the same nickel groups, and this meant that the passive film of these alloys was the easiest to breakdown and lose the oxide film, corresponding to their corrosion rates (0.01, 0.023, 0.035 and 0.031 mpy). The Cu-6Al-4Ni alloy revealed the highest corrosion rate.
There was not enough difference in cathodic current density (Ic) and passive current density (Ip) to determine the alloy passivity. On the one hand, the smaller cathodic current density (Ic) in the passive region indicated a higher degree of passivation and, on the other, the lower passive current density (Ip) indicated better corrosion resistance. The 9 wt% Al alloys exhibited higher corrosion resistance than the others and demonstrated the easiest passivation.
DISCUSSION
The available base-metal alloy in dentistry has a much higher modulus of elasticity than the root dentin.
8 The copper alloys have been developed in this study for use as a post and core material. The aimed properties of experimental materials focused upon the mechanical and physical properties of these materials, to be comparable to those of standard, dental gold alloys. Therefore, a desirable value of the elastic modulus of the experimental alloys would be comparable to gold alloys (70-100 GPa), 180 MPa of 0.2% proof strength, and present 10% elongation.
According to the desired properties, Cu-9Al with 2Ni and 4Ni would be most suitable for further investigation. The amount of aluminium added can increase the ultimate tensile strength, 0.2% proof stress, and modulus of elasticity to the optimal level. Adding more aluminium could increase the strength, elastic modulus, and hardness to be much higher than those of tooth structures, which is not beneficial for the intended application. The elongation also decreased when the concentration of aluminium was more than 9%, and the alloy became brittle. The strengthening effect might be due to the form phase of aluminium with copper, whereby the alloy would form a single-phase (face-centered cubic) alpha alloy, if the alloy containing aluminium contained less than 8%. This alloy has high ductility, and is suitable for cold forming, such as wiring, tubing and sheeting. If the aluminium content was increased to between 8% and 10%, then the alloys were highly strengthened by the appearance of a harder (body-centered cubic) beta phase. This phase made the alloy stronger and more suitable for casting. However, if the aluminium content increased to more than 10%, then it would be difficult to cast, because of the low castability of copper alloy.
15
The amount of nickel incorporated into the alloy compositions also affected the mechanical and physical properties of the experimental copper alloys, but the effects were not as prominent as those occurring from aluminium. An increase in nickel content of 0 to 4% could not significantly affect the ultimate tensile strength of 3-6 wt% Al alloy (189.4 ± 13.3 to 255.2 ± 25.8 MPa). However, from the static immersion tests, the level of nickel added should not exceed 4%, or the elution of nickel increased. Additionally, the results of the biocompatibility tests showed that the experimental alloys with 6 wt% Ni were more toxic than the other groups.
The 12 wt% Al fusion with 6 wt% Ni could not issue complete castings, and it caused many defects and incomplete castings.
The solidus and liquidus temperatures of all the experimental alloys slightly decreased as the aluminium content increased from 3-12%. The effect of nickel content was not noticeable in this aspect. Thus, the melting ranges were only influenced by the aluminium content. They decreased as the aluminium content increased. The solidus and liquidus temperatures were recorded at circa 1000-1100℃, and therefore within the ranges of commercially available gold alloys.
The ultimate tensile strength and 0.2% proof strength of the experimental alloys exceeded the minimum requirements. The optimum strength required for post and core restoration is crucial, because it has to withstand the complex loading forces which occur during chewing.
16,
17 It would be remarkably destructive for the whole restoration, even if a minute amount of deformation occurred along the post and core structure.
The electrochemical behaviors of the experimental alloys showed little difference in the potentiodynamic patterns. Alloys with more aluminium content displayed more stability in the passive film. The aluminium content plays an active role in the corrosion protection of this alloy. Additionally, the formation of a very thin protective film may be due to the characters of these alloys in the 0.9% NaCl electrolyte.
18 The corrosion reaction of copper, especially in a solution containing chloride ions, was quite complicated, but the reactions might briefly be described as the formation of copper (
I) cuprous, and copper (
II) cupric oxides, together with insoluble hydrated chlorides. Meyer and Nally
19 indicated that 0.9% saline solution was considered to be six times more aggressive than saliva and its artificial substitutes. However, Marek and Topfl
20 suggested that 1% NaCl was unsuitable for measurement, other than the screening test for generalized corrosion.
As a result a slight reduction of corrosion current, tracking on the active peak potential was found. One characteristic of the potentiodynamic polarization curves of the alloys was that they reached their own stable passive current density, and were discovered to be more stable when rising to breakdown potential (Ep), which demonstrated the style of their passive behavior.
The electrochemical behaviors of all the experimental alloys can withstand the oxidation potential ranges of the oral cavity
21 (-58 to + 212 mV), due to their passivity potential (
Ep) remaining stable and within the oral oxidation potential ranges.
The goal of all biocompatibility testing is the screening test for dental materials. ISO standard 7405:2008
22 has suggested a series of tests to ascertain that medical or dental materials, and devices, are biocompatible. This aspect would also include the corrosive behavior of the materials, especially elements released into the simulated environment.
The results of the biocompatibility tests presented moderate cytotoxicity, which was comparable to the positive controls, but lessened in terms of cell response (2/2 and 3/2). Nevertheless, the higher content of nickel exhibited more decolorization zones. The highest content of nickel, 6 wt % in this study, revealed widespread decolorization zones and, in turn, indicated that nickel had a negative toxicity effect upon the cells. The nickel ion was found to induce the cell to release an intracellular enzyme lactic dehydrogenase, which stimulated lactic acid production. Lactic acid in the cell would cause DNA damage, leading to the response of the cell to repair the DNA.
23 Several studies have shown evidence of the negative effects of nickel in human cells, and numerous nickel compounds are considered to be carcinogens.
24,
25 However, more evidence has been found in that nickel contained appliances cause contact allergies. More interestingly, their reactions to dental and orthodontic appliances appear to be infrequent in certain circumstances.
26,
27 The results of the biocompatibility presented for the highest content of nickel in this study, 6 wt% Ni, revealed the largest cell response being equal to positive control. For that reason, these alloys were not suitable for application in this situation. However, the element release results showed the lowest levels in the 2 wt% Ni alloys. This would be explained by the reaction of the nickel to aluminum. A small amount of nickel is able to form a completely solidified solution for aluminum, and the rest of the nickel is free in the alloy. However, the total metal ion release (20.3 to 143.9 µg/cm
2/7d) from the experimental alloys into the test solution distributed no greater than the maximum value of the ISO standard specification; not exceeding 200 µg/cm
2/7d.
11


 PDF
PDF ePub
ePub Citation
 Print
Print


 XML Download