

 PDF
PDF ePub
ePub Citation
 Print
Print


INTRODUCTION
The retention of cast metal restorations has been an interesting research topic in the field of fixed prosthodontics for many years. The retention means resistant forces of dislodgment along the path of placement.1 There have been many studies with regard to the preparation of abutments among reports of the retention of cast metal restorations. Among them, investigation of the occlusal convergence angle of the abutment has been the most active.2,3,4,5,6,7,8 Some researchers have reported that a smaller convergence angle or degree of taper is associated with greater retention of a complete veneer crown.2,3,9,10 In previous studies, many researchers have suggested 2°-7° of taper or 4°-14° of convergence angle in order to obtain maximum retention.2,8,11,12 Studies on the occlusal convergence angle from data that was clinically obtained by dental practitioners or students have also been performed. When the abutment is prepared in the mouth, it is difficult to obtain the ideal convergence angle due accessibility, visibility, the intraoral environment, tooth shape, and practitioner's willingness.13,14 In fact, it has been reported that abutment convergence angles prepared by dental students, residents, and specialists and found clinically acceptable were approximately 10°-24°, greater than the theoretical and ideal abutment convergence angle.4,9,15,16,17,18,19,20
As mentioned above, investigation of the abutment convergence angle has focused on two main topics. One was related to the optimal abutment convergence angle to obtain maximum retention, while the other evaluated the clinically prepared abutment angle. However, there have been many methods used to measure abutment convergence angles, as a single method has yet to be standardized. The most commonly used was the tracing method using a protractor.15,16,19,21,22,23 This method used magnified images or printed images of abutments, and two extension lines of oppositional axial walls were presented. Finally, the angle of the two lines is measured to calculate the abutment convergence angle. In recent years, some researchers have tried to measure the abutment convergence angle more precisely using a computer-aid design (CAD) system or a laser beam.13,24,25
There is no exact rule for measurement of the abutment convergence angle or determination of the location of the axial wall. The accuracy and reliability of the measured values may vary depending on the observers or measuring methods. The traditional method of a tracing using a protractor is likely to show less accuracy and reliability since a person must read the convergence angle manually. The CAD system could be an easy and accurate way of measuring the abutment convergence angle. However, its reliability may be questionable despite its advantages, in that an observer must define the axial walls and set up the extension lines. There have been no studies to evaluate the reliability between the traditional method using tracing and the digital method using a CAD system. This study, evaluating and comparing intra- and inter-rater reliabilities between the measuring methods, will be useful clinically in checking the clinician's own tooth preparation skill, and educationally in estimating the performances of the students or residents in prosthodontic abutment preparations.
In this study, the authors sought to evaluate the reliability of two kinds of tracing methods (drawing protractor, digital protractor) and a measuring method using CAD software. The purpose of this study was to find out if CAD software was an easy and reliable measuring tool for abutment convergence angle based on this evaluation.
MATERIALS AND METHODS
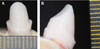
Artificial right maxillary canines (Nissin Dental Product Inc., Kyoto, Japan) were prepared for metal-ceramic crowns by sophomore dental students at Seoul National University. The students performed the abutment preparation on an educational dental model (D85S-TRM.406, Nissin Dental Product Inc., Kyoto, Japan) mounted on a hands-on mannequin (Shinhung Co., Ltd., Seoul, Korea). All of the students had acquired knowledge on the ideal form of the abutment through lectures of fixed prosthodontics. Both high-speed and low-speed handpieces were available, and a round-end tapered cylinder (102R, ISO 223 524 017; Shofu Inc., Kyoto, Japan) type bur with a 4° taper and a flat-end tapered cylinder (101L, ISO 173 524 018; Shofu Inc., Kyoto, Japan) type bur were used as tools. Twenty-four samples were selected for this study from the total 72 prepared artificial abutments. Abutments that had unclear margins and/or undercuts were excluded because they may lead to confusion when measuring the abutment convergence angle. After each abutment was positioned in the same dental model used for the preparation, mesio-distal and buccolingual planes of the abutment were photographed by a digital camera. The position of the dental model and digital camera was fixed in order to reduce errors during the measurement of the abutment convergence angle. In addition, all the samples were taken at one time. A ruler was used for scale in order to calculate the magnification of the printed images.
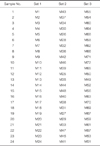
A total of seventy-two images were constructed. Table 1 represents three sets of sample IDs: M1 - M24 (set 1), M25 - M48 (set 2), and M49 - M72 (set 3). A sample was assigned randomly in the each set. Through this random assignment, raters who participated in this study were not aware that they measured each sample a total of three times. These prepared digital images were printed with a high-resolution color printer (CLP-310K; Samsung Electronics Co., Ltd., Seoul, Korea) after magnifying the interesting part of the abutments 17 times with graphics software (Adobe Photoshop CS6; Adobe systems Inc., San Jose, CA, USA) for the traditional tracing method. Digital images were converted to CAD images in order to obtain measurements using the CAD system, so that raters would be able to manipulate their zooming arbitrarily. The images that were provided to the raters for the measurements by tracing or CAD are shown in Fig. 1.
Three graduate students who were seniors at Seoul University School of Dentistry were selected as raters for measuring the abutment convergence angle. All the students had sufficient knowledge of abutment convergence angles through lectures and practical experience. Each student measured one set of abutments each day for three days.
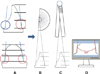
Each rater measured the abutment convergence angle of the samples by three different methods three times as shown in Fig. 2. A drawing protractor and a digital protractor (Digital Angle finder; Guilin GemRed Sensor Technology Co., Ltd., Guangxi, China) were used for the conventional tracing method. In the case of the CAD system, the three raters were taught the usage of the CAD software before measuring so that they were accustomed to using the CAD system. All the measurement values were valid to the first decimal place.
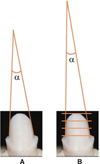
It is required that the occlusal convergence angle be defined in order to evaluate inter-rater reliability. The occlusal convergence angle can be defined as the angle that is made between the two tangent lines of the opposite axial walls of the prepared abutment (Fig. 3). However, the measurement value can differ among raters in the case of an anterior tooth because the buccal surface of an anterior tooth should be prepared with 2 or 3 planes (Fig. 3). Therefore, it is necessary to define how to measure the occlusal convergence angle. Kaufman et al.3 reported that the gingival third of the abutment was the most important for the retention of a full veneer crown. In this study, the authors measured the occlusal convergence angle based on Kaufman's study; that is, the cervical third of the abutment was used to measure the angle (Fig. 2A). The end point of the cingulum was selected as a reference point for the lingual surface (Fig. 2A).
In the many studies investigating occlusal convergence angle, researchers often caused confusion due to the expression of their terms.23 There are two different ways to express the inclination of the abutment axial walls, taper and convergence angle. Sometimes researchers used both terms without any distinction. The taper of an abutment represents the angle between the long axis and one axial wall of an abutment, while the convergence angle represents the angle between two opposite axial walls.23 The term occlusal convergence angle that is used in this study represents the convergence angle.
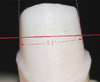
Each rater measured the occlusal convergence angles of 24 abutments three times with three different methods to evaluate the intra-rater and inter-rater reliabilities. After the first set of samples had been measured using a drawing protractor, digital protractor, and CAD, the second and third sets were measured by the same manner after 24 and 48 hours. Measuring tools including a drawing protractor and digital protractor were provided to the three raters. The axial wall of the cervical third of the abutment was traced and the tangential lines were extended in order to measure the convergence angle using a drawing protractor and a digital protractor (Fig. 2A). When measuring with a CAD, it was unnecessary to extend the tangent lines of the axial walls to read the angle. The occlusal convergence angle could be easily measured through a virtual convergence of the two tangent lines (Fig. 4). Once two tangent lines to the cervical third of the abutment were established, the angle between the tangent lines, that is, the convergence angle was automatically calculated on the software.
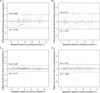
A Bland-Altman plot was created to examine the overall reliability by comparing digital protractor, CAD, and traditional tracing methods. The overall reliability of the traditional method and newly introduced methods were evaluated by plotting. The differences (y-axis) between the measured value of the traditional tracing method (drawing protractor) and the value by digital Protractor or CAD were plotted as an individual point depending on the value (x-axis) by the traditional tracing method. The average and ± 2s (s; standard deviation) of the values from the digital protractor or CAD was shown in each graph. The Intraclass Correlation Coefficient (ICC) was calculated to analyze the intra-rater and inter-rater reliability of each method. A two-way mixed model was used, and a 95% confidence interval was applied. The paired t-test was carried out to determine whether there were statistically significant differences between the bucco-lingual and mesio-distal surfaces of the abutments prepared by the students. All the statistical calculations were analyzed based on the 95% confidence interval set by the R software (R Foundation for Statistical Computing, Vienna, Austria).
RESULTS
A Bland-Altman plot was applied to evaluate the overall reliabilities among the different measuring methods (drawing protractor, digital protractor, and CAD). All the values collected by each rater using each method (in triplicate) were used, and Fig. 5 shows the resulting plots. The tracing method using a drawing protractor was designated as the control. The overall reliabilities of the two other methods, digital protractor and CAD, could be examined in the mesio-distal and bucco-lingual directions. Most of values created by these two methods were within the range of ± 2s which is within the limit of agreement as shown in Fig. 5. Measuring the abutment convergence angle by CAD was evaluated to be reliable under the assumption that the traditional tracing method was reliable. The measured values from both the CAD software and digital protractor tended to be higher than those from the drawing protractor in the mesio-distal direction (Fig. 5B and Fig. 5D). In the bucco-lingual direction, however, the values collected by CAD tended to be lower, and those by digital protractor to be higher, compared to the traditional tracing method (Fig. 5A and Fig. 5C).
The Intraclass Correlation Coefficient (ICC) was utilized to evaluate the intra-rater reliabilities of the abutment convergence angles measured by three raters using three methods (drawing protractor, digital protractor, and CAD), in triplicate. Table 2 and Table 3 show the intra-rater reliabilities according to the different methods. When the abutment convergence angles were measured by a drawing protractor in the mesio-distal direction, the ICC of rater 1 was calculated as 0.947 (95% of confidence interval: 0.899 < ICC < 0.975). Rater 2 had an ICC of 0.818 (95% of confidence interval: 0.681 < ICC < 0.909), and Rater 3's was 0.937 (95% of confidence interval: 0.882 < ICC < 0.970). In the case of a digital protractor, ICCs were 0.954 (95% of confidence interval: 0.912 < ICC < 0.978) for rater 1, 0.868 (95% of confidence interval: 0.762 < ICC < 0.936) for rater 2, and 0.916 (95% of confidence interval: 0.844 < ICC < 0.960) rater 3. When the measurements were repeated using CAD, the ICCs were 0.945 (95% of confidence interval: 0.897 < ICC < 0.974) for rater 1, 0.960 (95% of confidence interval: 0.924 < ICC < 0.981) for rater 2, and 0.947 (95% of confidence interval: 0.900 < ICC < 0.975) for rater 3. The same statistical analysis was applied for bucco-lingual convergence angles (Table 3). When the raters measured the occlusal convergence angles using a drawing protractor, the ICCs were 0.941 for rater 1, 0.874 for rater 2, and 0.948 for rater 3. In case of the digital protractor, the ICCs were 0.969 for rater 1, 0.857 for rater 2, and 0.953 for rater 3. Finally, the ICCs calculated from the use of CAD were 0.966, 0.970, and 0.940 for rater 1, 2, and 3, respectively. The P values of all ICCs were less than 0.05 and, thus, showed statistical significance.
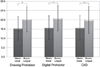
ICCs were also used to determine which method exhibited the most superior inter-rater reliability when the measurements were repeated. Fig. 6 shows the inter-rater reliabilities according to the different measuring methods. When the raters measured the occlusal convergence angle using a drawing protractor in the mesio-distal direction, the ICC value, which means inter-rater reliability, was 0.889 (95% of confidence interval: 0.841 < ICC < 0.925). In addition, the ICC showed 0.873 (95% of confidence interval: 0.819 < ICC < 0.914) for the digital protractor and 0.908 (95% of confidence interval: 0.868 < ICC < 0.938) for the CAD system. In case of the bucco-lingual direction, the ICCs showed 0.878 (95% of confidence interval: 0.826 < ICC < 0.917) for the drawing protractor, 0.874 (95% of confidence interval: 0.822 < ICC < 0.915) for the digital protractor, and 0.931 (95% of confidence interval: 0.901 < ICC < 0.954) for the CAD system. The P values (P) of all the ICCs was less than 0.001 and were statistically significant.
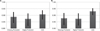
The paired t-test was applied to evaluate whether the average values of the occlusal convergence angles measured in triplicate by three raters were different in the mesio-distal and bucco-lingual directions. The means and standard deviations were 15.3 ± 6.4 for the mesio-distal direction and 20.3 ± 6.8 for the bucco-lingual direction in case of the drawing protractor. When measured by the digital protractor, values were 15.7 ± 6.5 for the mesio-distal direction and 20.8 ± 6.8 for the bucco-lingual direction. For the CAD, the values were 15.6 ± 6.6 for the mesio-distal direction and 19.9 ± 7.3 for the bucco-lingual direction. The occlusal convergence angles in the mesio-distal direction were significantly smaller than those in the bucco-lingual direction (Fig. 7).
DISCUSSION
The Bland-Altman plot and ICC were applied to evaluate reliability in this study. The Bland-Altman plot is a good method for evaluating overall reliability, and ICC is an established statistical method for evaluating intra-rater and inter-rater reliability.26,27,28 In general, the correlation coefficient can be classified as a slight agreement is under 0.20, a fair agreement being from 0.20 to 0.40, a moderate agreement from 0.40 to 0.60, a substantial agreement from 0.60 to 0.80, and a perfect agreement from 0.80 to 1.00.29
The Bland-Altman plot was applied to analyze the reliabilities of the measurement methods involving the traditional tracing method using a drawing protractor, a digital protractor, and CAD. In the measurement of the abutment convergence angle in the mesio-distal direction, the measured values by the digital protractor and CAD tended to be a little higher than the values obtained by the traditional method. It was observed that the values measured by the digital protractor in the bucco-lingual direction were slightly higher compared to the traditional method, while the values measured by CAD were less than those measured by the traditional method. Most of the measured values were distributed within the mean difference ± 2s, the limit of agreement, in both cases of the digital method and CAD. Therefore, it was concluded that both of the tracing methods using a digital protractor and CAD were reliable methods for measuring the abutment convergence angle with the assumption that the tracing method with a drawing protractor was a reliable method.
ICCs were calculated using the values that the three raters measured in triplicate with each of three different methods. The ranges of all the ICCs were from 0.818 to 0.97, indicating that all three methods exhibited perfect agreement. However, the ICC value differences between rater 2 and the other raters using both the tracing methods were larger than those using the CAD method. It is thought that measuring with CAD may not be as dependent on the raters' measurement skill as the other methods. When raters measure the abutment convergence angles by the two tracing methods, they should analyze the convergence angles formed by the two extension lines of the axial walls of an abutment using a drawing protractor or digital protractor. Therefore, the ability to draw consistent lines and measure angles based on the criteria, which usually require more space for the extended lines, could influence the reliability. However, in case of the CAD system, raters could calculate the convergence angles between two lines without manual convergence through the software after the images were magnified to the desired level, which was easy and required no additional space for the measurement. The reliability of the measurement could be less influenced by errors, such as those made while drawing extension lines and reading angles. This may be why the reliability of measurements made by the CAD system was higher than those obtained through the tracing methods (drawing protractor and digital protractor).
The inter-rater reliability of each method was also evaluated. All three methods exhibited ICC values over 0.80 (0.873-0.931) which represent perfect agreement. In both directions (mesio-distal and bucco-lingual), the CAD system demonstrated the highest ICC value (0.908 and 0.931). Less dependence on the measuring skill of each rater may affect this highest inter-rater reliability of the CAD system as mentioned above.
The paired t-test was used to compare the average values of the convergence angles of abutments that twenty-four students prepared in the upper right quadrant with the right maxillary artificial canine in the mesio-distal and bucco-lingual directions. The mean of the bucco-lingual convergence angles showed higher values compared to the mean of mesio-distal convergence angles no matter what measurement method was used. Students prepared artificial teeth in a dental model mounted in a hands-on mannequin which simulated the real oral environment after receiving education in fixed prosthodontics. Many researchers have reported that the bucco-lingual convergence angle of the abutment is higher than the mesio-distal convergence angle.7,13,15,19,25 On the contrary, Kent et al.23 reported that the mesio-distal convergence angle was higher than the bucco-lingual convergence angle in their study. The experience of clinicians, the oral environment, the kind of prepared tooth, and the effort of a clinician were reported to have an effect on the occlusal convergence angle of an abutment.3,14 The higher bucco-lingual convergence angle in this study may be explained based on the aforementioned studies. When preparing the right maxillary canine, the access of the handpiece to the bucco-lingual surface is more difficult than the mesio-distal surface due to the surrounding tissues. Less visibility, the anatomically short cingulum on the lingual surface of the canine, and larger bucco-lingual inclination than the mesio-distal inclination of the canine are also considered to have an influence on the operators.
CONCLUSION
From the results of this study, the CAD system was just as reliable for gauging the occlusal convergence angles of prepared teeth as the other methods based on tracing. All three investigated methods exhibited excellent intra-rater and inter-rater reliability. The measured values were more similar between the raters when the CAD system was used, compared to those measured using tracing and protractors. The application of CAD is an easy and reliable method for measuring the abutment convergence angle. Additionally, the authors confirmed that dental students tended to prepare the mesial and distal walls of a tooth more parallel than the buccal and lingual walls.


 XML Download