

 PDF
PDF ePub
ePub Citation
 Print
Print


INTRODUCTION
Since the emergence of computer aided design/computer aided manufacturing (CAD/CAM) for fabricating dental prostheses, it has become increasingly necessary to re-evaluate the conventional method, even though a prosthesis manufacturing process is generally a lost-wax technique.1,2
The techniques of conventional dental prosthesis manufacturing are well established, and there is no question that high quality of dental prostheses can be prepared through cooperation between dentists and dental technicians. Nevertheless, dental work is still labor-intensive and dependent on the clinician's experience.3 Dentists should make efforts to perform appropriate tooth preparation, form a suitable prosthesis insertion path and designed margins, and manage the soft tissues properly. Using an accurate impression and stable interocclusal registration, the work of dentists with three-dimensional information should be transferred to dental technicians.4,5 The quality of a final impression can affect the overall completeness and margin fit of the final fixed prosthesis significantly.6
Starting with CEREC (Sirona Dental Company GmbH, Bensheim, Germany) in the 1980's, the CAD/CAM field has undergone constant improvements.7,8 The CEREC system was the only one that allowed intraoral scanning until the late 2000's.9 Recently, a range of systems, including iTero (Cadent Inc., Carlstadt, NJ, USA) and Lava COS (3M ESPE, St. Paul, MN, USA) were introduced.10 CEREC is an in-office system with chairside milling, whereas iTero and Lava COS are digital impression devices that export the data to the laboratory via the internet.11 In particular, iTero is an open system that is compatible with any software that accepts STL files.12 The development of digital impressions has allowed the techniques of dentists and technicians to be complementary and systematic.13
Christensen14 reported that 50% of conventional dental impressions do not have the reproducibility of perfect margins for an indirect dental prosthesis, and a survey of dental technicians reported that 90% of conventional dental impressions had inadequate margins.15 Syrec et al.16 measured the mean marginal accuracy for Lava COS and conventional crowns of 49 µm and 71 µm gaps, respectively, based on a two-step wash impression technique. Ender and Mehl17 reported deviations of 49 µm and 40.3 µm for the CEREC system and Lava COS, respectively, whereas 55 µm was measured for a conventional impression in a full arch scan.
To evaluate the accuracy of the digital impression method, many papers have evaluated the accuracy of the resulting fixed prosthesis, which is strongly dependent on the skill of the technicians.18-20 The accuracy of the conventional impression model has been investigated mostly using linear distance measurements.21 On the other hand, the method using micrometers can be affected by the subjective bias or different bias between various operators.22 Quick et al.22 suggested that the use of 3D scanning to evaluate the dimensional distortion of dental impressions was more precise and reliable than the use of microscopy for the measurements. Therefore, some studies used the 3D scanning method but only STL (Stereo Lithography) files were utilized without creating a real working model. Moreover, the measurement was carried out at random points.23,24 Consequently, only few studies have compared the dimensional error by fabricating methods of the model. This study compared the accuracy of the polyurethane model (PM) with that of the gypsum model (GM) using a 3D scanning method at certain measuring points. The PM was produced using an intraoral scanner, the iTero digital impression system, and manufactured using a milling machine (VF-2TR, Haas Automation Inc., Oxnard, CA, USA). The GM was produced using the conventional silicone impression method.
MATERIALS AND METHODS
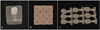
In the experiment, the maxillary first molar artificial tooth (Nissin Dental Prod. Inc., Tokyo, Japan) was selected because it reproduces an ideally prepared abutment tooth for a full veneer crown. The artificial tooth model has a mean axial wall taper of six degrees with a chamfer margin (0.5 mm above the CEJ) and was prepared to have a round internal surface of the margin. The artificial tooth was fixed in an autopolymerizing acrylic resin base (Orthoresin, Degudent, Hanau-Wolfgang, Germany) with a 10 mm thickness. The long axis of the artificial tooth was located perpendicular to the base (Fig. 1A).
The impression was taken using silicone impression material according to the 2-step putty-wash technique. The putty (Express STD Putty; 3M ESPE, St. Paul, MN, USA) was mixed and placed on the partial metal tray. Light-body silicone impression material (Imprint II Garant, 3M ESPE, St Paul, USA) was injected into the space between the putty tray and reference tooth. A Type IV high-strength dental stone (Fuji rock EP, GC Corp, Tokyo, Japan) was mixed at a water/powder ratio of 0.2 for 60 seconds using a vacuum mixer, and poured into the impression body. The model was separated after 1 hour and the stone plaster sample was completed after trimming. This process was repeated nine times (n=9) (Fig. 1B).
A 3D digital impression was scanned with iTero. Scanning was performed whilst maintaining contact with the teeth because this system used the parallel confocal principle and telecentric principle. This study was performed by a well-trained dentist according to the manufacturer's instructions. The digital impression of the reference tooth was taken nine times using an intraoral scanner. For each impression, scanning was performed at the 45 buccal, lingual, mesial and distal directions at the occlusal level and at the occlusal surface. The data file was then sent to the iTero center (Cadent iTero; Cadent Inc). The imaginary model file (STL file), which was completed by detailed modeling, such as a determination of the reference tooth margins at the iTero center, was used to produce a polyurethane model (SikaBlock® M1000, Sika Deutschland GmbH, Stuttgart, Germany) by processing a computerized numerically-controlled 5 axis milling machine (VF-2TR, Haas Automation Inc., Oxnard, CA, USA). The milling machine allows 30,000-RPM high speed machining and linear scales for positioning accuracy. For milling of the PM, the bur of the milling machine was replaced with a new one at each run. The number of burs was 8 (T1-T9, T5 bur was not used.) and the sizes of burs ranged from 0.8 to 6mm for the fabrication of the PM in this study. All this process was repeated nine times (n=9) (Fig. 1C).
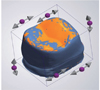
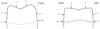
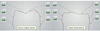
Certified quality-controlled equipment, the 3Shape Convince System (3Shape, Inc., Copenhagen, Denmark), was used to measure the discrepancies between the reference tooth and the models obtained using each impression method. The Q740 3D scanner of the 3Shape system was mounted with 2 image sensor cameras with a high resolution of 5.0 megapixels, and had 16 µm over a 60 mm maximum permissible error of indication. The reference tooth and experimental models were scanned precisely by 3 axis motion including rotation, translation and tilting. On the Convince Standard software of 3Shape system, the registered data of the reference tooth was selected as a reference model, and the 3D data from the reference model and GM image, as well as the reference model and PM image were superimposed. The automatic superimposition has been performed repeatedly until there is no changes; nine 3D configurations were obtained in each case (Fig. 2). The buccolingual and mesiodistal cross-sections at the center of the superimposed 3D configurations were obtained to measure the margin and internal accuracy on the 2D shapes. Six points for comparing the discrepancy were selected and registered on the buccolingual section of the 2D configurations of the reference model; buccal and lingual margin (points 1 and 6), buccal and lingual mid-axial wall (points 2 and 5), and the center of the buccal and lingual incline on the occlusal surface (points 3 and 4). The other 6 points were selected on the mesiodistal section; mesial and distal margin (points a and f), mesial and distal mid-axial wall (points b and e), and the center of the mesial and distal incline on the occlusal surface (points c and d). Overall, a total of 12 registered points were set and the discrepancies between the GM image and reference model and the PM image and reference model were measured (Fig. 3 and Fig. 4).25 The former and latter defined as the 'GM-RM group' and 'PM-RM group', respectively.
The differences between the discrepancies measured in both groups at the each point and the three zones were compared using a Mann-whitneytest on SPSS 18.0 software (SPSS Inc. Chicago, Il, USA). The experiments were repeated 9 times. The mean and standard deviation were calculated. The significant differences between the registered points were tested at the 95% confidence interval.
RESULTS
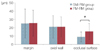
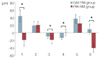
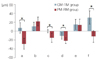
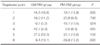
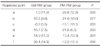
The discrepancies of the GM-RM and PM-RM groups were measured at each point (1-6, a-f). If the GM or PM image was smaller (larger) than the reference model, they were presented as negative (positive) values. To compare the discrepancy only, the mean and standard deviation of the absolute values were calculated at three zones; the marginal, axial and occlusal areas (Fig. 5, Table 1). The mean and standard deviation of experimental values at each point were calculated, as shown in Fig. 6 and Fig. 7, and Table 2 and Table 3.
A comparison of the absolute value of discrepancy revealed the GM-RM group to show discrepancies of 25.2 ± 17 µm, 21.2 ± 14 µm and 9.0 ± 6 µm, at the margin, axial walls and occlusal surface. The PM-RM group showed discrepancies of 25.6 ± 16 µm, 21.2 ± 12 µm and 15.5 ± 10 µm at the margin, axial walls and occlusal surface, respectively. An evaluation revealed a significant difference between the two groups only at the occlusal surface; the GM revealed a smaller mean discrepancy than the PM.
A closer examination at each registered point revealed the GM-RM group to have the largest discrepancy (44.3 ± 16 µm) in the buccal margin (point 1) and the smallest discrepancy (9.4 ± 13 µm) in the lingual margin (point 6) from the buccolingual surface view. The occlusal surface (points 3 and 4) showed negative values (-9.6 ± 5 µm and -12.7 ± 4 µm). The PM-RM group had the largest negative discrepancy (-39.9 ± 12 µm) in the lingual part of the margin (point 6). Negative values (-18.7 ± 16 µm, -18.1 ± 11 µm, -39.9 ± 12 µm) were obtained in the buccal margin, bucco-occlusal surface and lingual margin (points 1, 3 and 6). Significant differences between the GM-RM and PM-RM group were observed in the margins (points 1 and 6) and occlusal surface (points 3 and 4).
From the mesiodistal surface view, the GM-RM group had the smallest discrepancy (-0.2 ± 4 µm) in the mesioocclusal surface (point c) and the largest discrepancy (30.4 ± 15 µm) in the distal margin (point f). The occlusal surface (points c and d) showed negative values (-0.2 ± 4 µm, -10.7 ± 8 µm). The PM-RM group had the largest negative discrepancy (-28.8 ± 12 µm) in the mesial margin (point a) and the highest positive discrepancy in the mesial mid-axial wall (point b) (21.6 ± 10 µm). Negative values (-28.8 ± 12 µm, -15.1 ± 10 µm, -21.7 ± 6 µm, -12.2 ± 13 µm) were obtained in the mesial margin (point a), mesio-occlusal surface (point c), disto-occlusal surface (point d) and distal margin (point f). Significant differences between the GM-RM group and PM-RM group were observed in the margins (points a and f) and occlusal surfaces (points c and d).
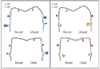
The GM-RM group showed negative values in the occlusal surfaces, whereas the PM-RM group showed negative values in the all registered points except for the midaxial walls and linguo-occlusal surface. Fig. 8 presents a schematic diagram.
DISCUSSION
Since the introduction of CAD/CAM, there have been remarkable developments in dentistry. Currently, a new technique using an intraoral scanning method is widely used.3,26,27 Several types of intraoral scanners are on the market but the information regarding the instrument is inadequate, and few studies have examined their accuracy.28 The accuracy of a prosthesis using CAD/CAM is affected by the scanning procedures, software design procedures, milling procedures and shrinkage effects, etc.18,29 Therefore, in this study, the model stage of the impressions was compared to confirm the accuracy of the models using scanning and model manufacturing procedures only; the errors occurring after this step were excluded.
Sorensen30 suggested the following methods to measure the fit: direct observations, observations after cutting, evaluations by impression taking and evaluations by probes, etc. On the other hand, Moon et al.31 reported that the observations after cutting was the most accurate method but many precise samples needed to be prepared to cut the actual object. In the present study, this disadvantage was overcome, and the desired parts of the section could be observed by performing sample cutting in imaginary space using a 3D scanner with a high resolution 3Shape Convince System. Therefore, both cases, where the values of the GM and PM images were larger and smaller than the reference model, respectively, could be observed and the mean and standard deviation of these values were calculated. When using 3Shape Convince metrology software, 3D scan images can be obtained immediately after maximum superimposing. On the images, the discrepancies can be measured on each registered point selected. Nevertheless, the gaps are not visible and it is difficult to select the measuring points. Therefore, in this study, a comparison was made using the data converted to 2D images to select the margin, axial wall and occlusal surfaces correctly in the buccolingual and mesiodistal sections, and they were observed visually.
A comparison of the absolute mean discrepancies in the three zones (margin, axial and occlusal surface) showed that the amount of discrepancy from the reference tooth was smallest on the occlusal surface and largest on the margins. A significant difference between the two models was observed on the occlusal surface only; the GM had a smaller discrepancy than the PM at the occlusal surface. On the other hand, the mean absolute discrepancy at the occlusal surface between the PM and reference tooth was 15.5 µm.
At each registered point, a significant difference between the GM-RM and PM-RM group was observed in the margin and occlusal surface (P<.05). Each measurement resulted in positive values at the axial wall, and a negative tendency was observed on the occlusal surface of the two groups. The PM-RM group tended to have larger negative values. This means that the occlusal surface of the model can be made lower than the actual abutment, and the margin fitness could be more tight.
The GM-RM group exhibited a larger discrepancy in the buccal margin (point 1), lingual mid-axial wall (point 5) and distal margin (point f) on average, and a smaller discrepancy in the occlusal surface (points 3, 4, c and d), lingual margin (point 6) and mesial margin (point a). This means that the accuracy of the margin is affected by the position. The occlusal surface, which is at the outermost to contact easily with the impression materials, showed the best accuracy. When looking the buccolingual section in the PM-RM group, the mean discrepancy in the lingual margin (point 6) was larger than in the buccal margin (point 1), whereas the mesial margin showed a relatively higher mean discrepancy in the mesiodistal surface. This might be due to differences in the shape of the margin and the degree of sharpness depending upon the location. Common to both models, negative values tended to appear on the occlusal surface. The PM-RM group also showed negative values on the margins. A negative value means that the impression model is smaller than the original reference tooth.
Tjan et al.32 reported that the difference from the master model of approximately 50 µm is clinically acceptable because full sitting of the prosthesis is possible under this condition. On the digital impression model, all the mean values measured were small enough to be accepted clinically (maximum discrepancy of -39.9 ± 12 µm at point 6), which was also in the appropriate range when compared with the mean cement space, 20-40 µm, as a standard.33-36 In comparison of the reference tooth, GM and PM revealed no significant discrepancy, but there were notable differences in the margin and occlusal surface between the two models. On the other hand, applying a sufficient die spacer on the occlusal surface should be considered for a more precise restoration.
This study excluded the adjacent tooth of a single crown. Therefore, further studies of cases with multiple abutments, adjacent teeth, different margin types and different tooth positions will be needed.
CONCLUSION
Although there were some limitations of this study, the digital polyurethane model and the conventional gypsum model revealed different trends on certain parts of the tooth, but they were within the acceptable range. Clinician should consider that the restoration from the polyurethane model could be more tight when it is inserted to the teeth.

 XML Download