

 PDF
PDF ePub
ePub Citation
 Print
Print


INTRODUCTION
Implant dentistry has made a significant impact on the dental field. Not only successful outcomes of the implant treatment but also patients' need for it made the implant treatment as a treatment of choice in a daily dental practice. Osseointegration was the main issue in the early days of the implant dentistry. Currently, however, the dental implant technology has been remarkably improved so that immediate or early loadings of dental implants are also feasible. If osseointegration can be well predicted, the dental implant treatment will have a high success rate.
For measuring the implant stability, Periotest (Siemens AG, Benssheim, Germany)1 and Osstell Mentor (Integration Diagnostics AB, Göteborg, Sweden) are currently used in clinic as well as in laboratory studies. The Periotest device measures the reaction of the peri-implant tissues to percussive force applied to the implant. The Periotest is a method sensitive to the angulation of a percussive force. Resonance Frequency Analysis (RFA) gives clinical informations of not only initial implant stability, but also stability during healing process. Osstell Mentor (Integration Diagnostics AB), one of the resonance frequency measuring devices, is non-invasive and non-destructive in nature since it vibrates the transducer without damaging the osseointegration process.2 RFA provides a useful clinical index for osseointegration and implant stability. It was reported that the RFA value had some correlations with stability of implant-bone interface as well as the implant length exposed above surrounding bone.3-5 Zix et al.4 found that the RFA value was influenced by various factors including stiffness of implant-bone interface, stiffness of bone itself, and stiffness of implant components.
Meredith and his colleagues5 failed to find any correlation between implant-bone contact area and RFA values. It was mentioned in their experiment with tibia of rabbits that the RFA values might be rather related to the stiffness of an implant in the surrounding tissues and also to the height of implant left exposed. Schliephake et al.6 also reported no correlation of RFA values with bone-implant contact area and peri implant bone volume density (BVD). On the other hand, Scarano and Degidi7 did find a significant correlation between bone-implant contact area and RFA values. However, Scarano's study materials included implants retrieved from only 7 subjects, the statistical significance of which was questionable.
Some recent researches showed the positive correlations of RFA values with bone density8,9 or thickness of cortical plate.10,11 Ostman and his colleagues found in their clinical study RFA values in the mandible were higher than those in the maxilla.12 High bone density, increased cortical thickness, and jaw location are somehow strongly related to increased bone-implant contact. These factors are also related to stiffness of bone surrounding the implant. Trisi et al. found in their in vitro study that insertion torque and bone density had positive influence on RFA values. They measured micromotion of implant and showed strong correlations between RFA values and micromotion.13 Da Cunha and his fellows, on the other hand, failed to prove any correlation of RFA values with cutting torque.14
Histomorphometric studies generally showed the amount of intimate contact between implant and surrounding bone. However, they showed only one cross-section of bone-implant contact, and could not be controlled for the degree of maturation or stiffness in the surrounding remodeling bone.5-7,10 In vitro study could not simulate osseointegration process, but simulated resin model could control the degree of maturation in the implant-surrounding material.
The purpose of this in vitro study was to clarify the relationship of resonance frequency values from Osstell Mentor with amount of contact area between implant and its surrounding material and also with stiffness of material around implant.
MATERIALS AND METHODS
Seventy cylinder-shape of resin specimens were prepared under pressure with acrylic resin (Ortho-Jet, Elastic Modulus: 2.38 GPa, Lang Dental Mfg. Co., Wheeling, IL, USA).15 The resin specimens were 30 mm in diameter and 30 mm in height. Another 10 cylindrical specimens with the same dimensions were made with impression putty (Dentasil, Elastic Modulus: 13 × 10-3 GPa, Songbotech, Uijeongbu, Korea).15 The cylinder-shape specimens were divided into 8 groups. Each group contained 10 specimens. Resin specimens were used for control and experimental Group 1 to 6, while putty specimens were used for experimental Group 7. All specimens were used as experimental implant beds to accommodate GS II implants (Osstem Implant Co. Ltd., Seoul, Korea). The implants were 5.0 mm in diameter and 13.0 mm in length. Implant site preparation was performed as recommended by the manufacturer.
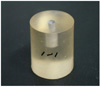
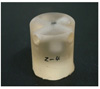
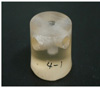
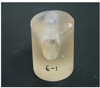
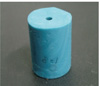
Implants in control group were fully embeded and made full sidewall contacts (approximately 100%) with resin cylinders (Fig. 1). In experimental Group 1, two horizontal holes (ø 6.5 mm) were made in the cylinder, 1.0 mm (1.85 mm in average) below the top of resin cylinder, so that the resin-implant-contact (RIC) of the implant became 50% of one in the control group (Fig. 2). Experimental Group 2 maintained the RIC values as 50%. However, the holes were situated 3.0 mm (3.35 mm in average) below the cylinder top. Larger holes (ø 9.0 mm) were made in Group 3 and 4 resin cylinders, 1.0 mm (2.23 mm in average) and 3.0 mm (3.70 mm in average) below the cylinder top respectively, so that the RIC values accounted for 30% of the control (Fig. 3). In Group 5, the largest holes (ø 12.0 mm) were made 2.0 mm (1.98 mm in average) below the cylinder top for 15% RIC (Fig. 4).
Resin cylinders in Group 6 were made with different powder/liquid ratio. The amount of liquid monomer used for polymerization was increased by 50%. Cylinders in Group 7 were made of impression putty. Full contact (100%) with no holes was simulated in the implants installed in Group 6 and 7 (Fig. 5). All specimens were prepared with 15.0 mm-long drills, which was 2.0 mm longer than the placed implant, so that the bottom surfaces of the implants were excluded in calculation of RIC (Table 1).
The different amounts of contact area between implant and resin block were made by the following methods. First, the whole surface area for the side wall of implant was calculated, and then, the subtracted area through cross-way drilling by the drills with two different diameters was also calculated. For making the 50% contact area, the drill with ø 6.5 mm was used, and for the 30% contact area, the drill with ø 9.0 mm was used. The 15% RIC was simulated when all surfaces of the implant were kept out of contact except the upper contact 2.0 mm.
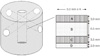
Two holes ran horizontally at the same level in relation to the top of cylinder specimen. These holes crossed each other where the implant was located (Fig. 6). This perpendicular geometry kept the density of simulated implant bed under control, which had been reported to affect the RFA values. This modal analysis should not allow any uncontrolled movement of specimens during the experiment which can affect experiment results. An aluminum block was used to rigidly hold the specimens in place during implant drilling and placement as well as RFA measurement.
GS II implants (ø 5.0 × 13.0 mm; Osstem Implant Co., Ltd.) were placed in the prepared cylinder specimens by the handpiece and hand instrument. Each implant was connected to the Smart peg (Type 6; Integration Diagnostics AB) transducer as recommended for the Osstem Implant system. RFA values or Implant Stability Quotient (ISQ) values were measured by using Osstell Mentor (Integration - Diagnostics AB). For each specimen, the measurements were repeated three times and the mean ISQ value was calculated. The Osstell Mentor was oriented perpendicular to the Smart peg and parallel to the horizontal holes made through the cylinder specimen.
The mean and standard deviation of ISQ values for each group were calculated. Kruskal-Wallis' test (SAS version 8.2, α=.05) was used to find out any significance in the mean ISQ values among all control and experimental groups with different RIC percentages. Statistical significances between each group were verified by Scheffe's test.
RESULTS
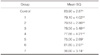
The mean RFA value was found to show the highest value in control group (83.9) and the lowest in Group 7 (36.6). The RFA value in Group 7 was significantly different from those of the other groups (P<.05). Control group and Group 6 showed significant differences from Group 5 (P<.0001). However, among the remaining groups, Group 1 to 5, there were no significant differences in RFA values (P>.05) (Table 2).
DISCUSSION
Successful osseointegration of dental implants is said to be related to their stability. Primary stability is dictated by bone quality, bone volume, implant design and surgical techniques. Secondary stability involves initial healing process around dental implant. It is determined by primary stability, bone regeneration, and bone remodeling at implant-bone interface.16-19 Resonance frequency analysis has been regarded as a promising tool for quantifying implant stability so that successful osseointegration could be objectively predicted. Thus, indications of immediate loading or implants at risk could be identified. However, clinical significance of the RFA method has been also doubted. The previous in vivo experiments arouse conflicting results and controversies.5-7 Thus, the present study dealt with in vitro experiments in a more controlled fashion.
The result showed the highest mean ISQ in control group (83.9) and Group 6 (81.8) which had the highest RIC (100%). As the RIC was decreased, the mean ISQ tended to decrease as well. However, statistical analysis failed to show significant differences among the mean ISQ values of control group, Group 1, 2, 3, 4 and 6. On the contrary, a significant decrease in the mean ISQ value was noted in Group 5 (15% RIC) compared with control group and Group 6 (100% RIC). This result was consistent with in vivo experiment by Meredith et al.5, which observed that increase in the bone-implant contact (BIC) did not necessarily lead to increase in RFA values. He mentioned that RFA values might be more influenced by increase in stiffness of bone as maturation proceeded rather than bone-implant contact area. His result was also in accordance with Schliephake's study which showed RFA values were significantly increased after the bone healing times of three months.6
RFA values of Group 3 and 4 were 78.56 and 77.86 respectively. These values were not significantly different. These two groups had the same RIC (30%) with different contact distributions. In Group 3, implants made contact at upper 1 mm (2.23 mm in average) and lower 2.5 mm (1.27 mm in average) to simulate bicortical fixation. While in Group 4, only upper 3 mm (3.7 mm in average) of the implants was made contact with resin blocks. Group 1 and 2 had the same RIC (50%) with different distributions. Their RFA measurements resulted in similar values with no significance. Both groups simulated bicortical fixation, but differed in the amount of upper contact. According to several finite element analysis studies, the authors showed the highest stress was concentrated on the cervical part of bone-implant interfaces when loaded on implants.20-24 The present study failed to prove any effect of cervical contact amount with implant on RFA values. Martinez et al.25 reported higher RFA values in bicortical fixation than in unicortical fixation. In the present experiment, the results failed to find such a difference between the two situations. It seems that stability acquired by upper 3.70 mm contact in group 4 overruled the advantage acquired by bicortical fixation. It may also be attributed to smaller upper contact area of Group 3 implants and inherent limitations of resin blocks for the simulation of bone-implant interface.
The resin blocks in this experiment were used as a bone substitute to simulate implant bed because of their modulus of elasticity that was close to that of cancellous bone. However, the resin-implant interface was not the best simulator of the bone-implant interface. The resin blocks simulated the cancellous bone only, which was hardly the case in vivo. The resin blocks did not have the modulus of elasticity simulating cortical bone. Thus, this study had some limitations in applying the results to clinical situations. Instead, the present study was planned to show in vitro what the RFA values really indicated related to the implant contact ratio.
The RFA values failed to find significant differences among control and Group 1, 2, 3, 4 and 6. This might also be due to the intimate contact around implant neck surface at least 1.5 mm thick in average. In terms of bone maturation, intimately-related bone around implants may be achieved over 24 months' healing period. The high intimacy between resin materials and implants may have led to different results from in vivo. Within the limitations of this in vitro experiment, resin-implant contact simulated fully matured osseointegration around implant, which led to no significant difference in RFA values regardless of the different RIC's.
Resin cylinders in Group 6 were made with 50% more liquid monomer than those in control. However, RFA values showed no significant difference. Extra monomer did not seem to have an influence on the stiffness of the resin cylinders. Excessive monomer may have escaped during the polymerization under pressure. The mean RFA value in Group 7 was 36.6. It was significantly lower than the control or Group 6 with the same RIC. This decrease is thought to be due to the difference in stiffness of materials surrounding the implant. Group 7 was the only group which used the cylinders made of impression putty. This result was consistent with Meredith et al.26 who found out that RFA values changed after resin polymerization with increase in stiffness. Specimens of Group 7 can be representative of implants within remodeling bones under an active stage. Lower RFA values are due to the decreased stiffness of surrounding bones. Increase in stiffness, osteogenesis and thus increase in RFA values are expected from successfully osseointegrated implants.

 XML Download