

 PDF
PDF ePub
ePub Citation
 Print
Print


INTRODUCTION
The clinical success of all-ceramic restorations and the increase in patient demand for an esthetic treatment results in the development and introduction of many all-ceramic systems. However, fracture of ceramic materials has been one of the most frequently reported complications for all-ceramic restorations.1 Fracture of brittle materials typically causes from a crack propagation which originates from the existing flaws in the material.2 The parameter used to indicate the ability of a brittle material to resist this crack propagation is called fracture toughness or KIc.3 Fracture toughness is defined as the critical stress intensity level at which a critical flaw starts growing. The higher the fracture toughness is the higher the fracture resistance of a ceramic restoration will be.
The introduction of partially stabilized zirconia ceramics for use in dentistry has increased the reliability of all-ceramic restorations due to the occurrence of a transformation-toughening mechanism. The transformation from tetragonal to monoclinic phase after subjected to loading is well documented and results in their high fracture strength and fracture toughness of zirconia-based materials.4 Previously, a glass-infiltrated ceramic (In-Ceram Zirconia®,Vita Zahnfabrik, Bad Säckingen, Germany) has been developed by addition of 33 wt% partially stabilized zirconium dioxide to the original compound. An approximate 15-20% increase of its fracture toughness has been reported for this material compared with the original material, which composes of alumina crystals embedded in a glass matrix (In-Ceram Alumina®, Vita Zahnfabrik, Bad Säckingen, Germany).5,6 Then, yttria-stabilized tetragonal zirconia polycrystals (Y-TZP) have been introduced and widely used as the core materials for fixed partial dentures (FPDs) because of their high fracture resistance and excellent biocompatibility. Clinical performance of zirconia-based FPDs has been reported to be satisfactory with a higher survival rate compared with other all-ceramic restorations.1,7 However, characterization of a remarkably high toughness material is very challenging especially when aiming to measure its KIc value.
Different testing methods have been established to evaluate the fracture toughness values of advanced ceramics such as double torsion, single-edge-notched beam, chevron notch, surface crack in flexure etc.8-10 The differences among these methods are size and shape of the test specimens, size and shape of the critical flaw prepared on the specimen and the loading configurations.11 One of the most reliable methods to determine the fracture toughness of a ceramic material is the single edge V notched beam (SEVNB) method which is recommended by ISO 6872:2008(E).12 It has been shown that SEVNB method is an accurate and reproducible approach.13 However, the difficulties in preparing the V-notch have also been noted especially for the high toughness advanced ceramics.8-10 The inconsistent results of KIc value obtained from SEVNB method of zirconia-based ceramics have been reported when compared with lower toughness materials such as alumina-based ceramics.14
Fractographic analysis is the study of fracture surface topography of brittle materials which contains specific characteristic markings. These markings can be used to identify the fracture origins, fracture path and mechanisms of failure. It can also be used to estimate the stress at failure when stress is typically not measurable.15,16 There have been few studies that used the quantitative fractography as an analytical tool to find the failure initiation sites and also to estimate the in vivo failure stress of ceramic restorations.17,18 These information taken from the failed restorations could provide useful data that could not be retrieved from any in vitro study. The determination for fracture toughness can also be obtained via fractographic analysis. By using the strength test specimens, the evaluation starts with correctly identifying the location, size and geometry of the failure-initiating flaw.15 Combining with the known stress at fracture, the fracture toughness can be determined using the straight-forward fracture mechanic equation.16 The difficulty in the application of this method is the inspection of fracture surface markings which required a qualified examiner.19,20 However, with the gaining of specific information about failure origin and mechanism of fracture, this method could provide better understanding in the fracture process of a brittle material. It is also the practical method that can be used to determine the stress at failure of clinically failed ceramic restorations.
There have been few available studies that used fractographic analysis to quantify the KIc values of some dental ceramics and compared with the values obtained from other methods.15,18 The results from these studies showed that comparable KIc values were obtained from these methods. As mentioned earlier, several testing methods have been established to evaluate the fracture toughness values of advanced ceramics. However, considering the available fracture toughness testing methods conducted in dental studies, it is very crucial to select the suitable methods for the fracture toughness determination of dental materials. The reason for this complexity is that the intraorally restored prostheses behave differently from the tested specimens set up in a laboratory especially due to its loading characteristics. However, attempting to establish some testing protocols using clinically relevant parameters and combine with the standard material testing procedures have continuously been the topic of interests for dental researchers. The objective of this study was to compare the fracture toughness values obtained from of the fractographic analysis method (FTA) and the SEVNB technique of two dental core ceramics: a glass-infiltrated ceramic (ICZ) and zirconia-based ceramic (Y-TZP).
MATERIALS AND METHODS
Two dental core ceramics used in this study were glass-infiltrated (In Ceram Zirconia, Vita Zahnfabrik, Bad Säckingen, Germany) and zirconia-based dental ceramic (Zeno®, Wieland Dental + Technik, Schwenninger, Germany). The glass-infiltrated dental ceramic is composed of Al2O3 and CeO2-stabilized ZrO2 approximately 68% embedded in the glass matrix, and the zirconia-based dental ceramic is yttria-stabilized tetragonal zirconia polycrystals (Y-TZP). For both materials, ten bar specimens (4 mm × 3 mm × 25 mm) were prepared for the SEVNB method and ten bar specimens (2 mm × 4 mm × 25 mm) were prepared for the fractographic analysis method. All specimens were prepared according to the manufacturer recommendations and the guidelines described in ISO 6872: 2008.
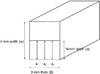
For preparation of the special plaster molds for ICZ specimens, the special plaster (Vita Zahnfabrik, Bad Säckingen, Germany) was mixed with distilled water and poured into a silicone mold. After setting, the outer surface of special plaster molds were trimmed until the final thickness of 0.5 mm was obtained in every surfaces. 45 grams of Vita In-Ceram powder was mixed with 5 mL of Vita In-Ceram liquid (Vita Zahnfabrik Bad Säckingen, Germany). Four drops of additive were added to the mixture and mixed with a glass spatula in a cooled glass beaker in an ultrasonic cleansing machine (Vibraclean 300 (Harvey), MDT Co., USA) to obtain the slip. Then, the slip was gradually added into the plaster mold in order to minimize the internal porosity until the mold was completely filled. The excessive slip was leveled to the top of the mold using a sharp blade until the surface was evenly flat (Fig. 1A). The slip was left to dry for one hour. The slip bars were pre-dried at 200℃ for 45 minutes and sintered at 1,120℃ for 40 minutes in a furnace (Vita vacumat 40, Vita Zahnfabrik, Bad Säckingen, Germany). After sintering, all specimens were ground using fine-grained 30 µm and 15 µm diamond-coated cutting discs until they reached the required sizes. The final specimen sizes were obtained before the glass-infiltration process (Fig. 1B). In-Ceram glass powder (0.8 gram) was mixed with distilled water and the mixture was applied onto the platinum foil sheet. Afterwards, the slip bars were positioned on the glass powder mixture. The specimens were sintered at 1,100℃ for 40 minutes. The excess glass was removed by sandblasting with 50 µm Al2O3 at the maximum pressure of 0.25 MPa.
For zirconia-based dental ceramic, all specimens were made by cutting a partially sintered zirconia block into specimen bars using a low speed saw (Isomet®, BUEHLER®, IL, USA). The cutting size of each specimen group was determined to compensate for the firing shrinkage of a zirconia material. The sintering process was performed in a special furnace (Zeno Fire®, Wieland Dental + Technik, Schwenninger, Germany) according to the manufacturer's recommendations at a temperature of 1,450℃ for 2 hours. All specimens were cooled down to room temperature (20℃) at a rate of 10℃ min-1. After firing, all specimens were cleaned with water in an ultrasonic bath for 15 min.
For single edge V-notched beam method, the V-notch preparation and the fracture toughness testing were conducted according to the guidelines described in ISO 6872:2008. For preparation of the V-notch, five specimens and two dummy specimens were mounted on a flat holder with the 3 mm-wide side of the specimens faced up to receive the starter notch (this side were in tension during the fracture test). The holder was mounted in a cutting machine and a 0.5 mm V-notch was created using a diamond saw in a uniform depth for all specimens. The specimens were cleaned and the notches were polished by filling the notch with diamond polishing paste having a maximum grain size between 3 µm to 5 µm. The razor blade was used to sharpen the starter notch using a gentle back-forth motion as straight as possible. A light microscope was use to examine both ends of the V-notch to ensure the size and shape of the V-notch.
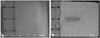
After the notch preparation, all specimens were cleaned with acetone in an ultrasonic bath. These specimens were loaded to fracture using a 4-point bending fixture (20 mm outer span, and 10 mm inner span) attached to a universal testing machine (Model 4465, Instron, MA, USA) with a crosshead speed of 0.5 mm/min at room temperature air. The fracture loads were recorded. All specimens were examined under an optical microscope to assure that the fracture started at the bottom of the V-notch and continued over their entire length. The depths of the V-notch were measured using a light microscope. The depths a1, a2, a3 were recorded to three significant figures as shown in Fig. 2. The following formula (A1, A2, A3, A4) were used to calculate the average (a) and relative (α) V-notch depth and then the fracture toughness (KIc).12 The means and standard deviations of the fracture toughness data were reported.
Where a is the average notch depth (m); a is the relative V-notch depth.
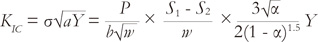
Where KIc is the fracture toughness (MPa·m1/2); δ is the fracture strength (MPa); P is the fracture load (MN); b is the specimen thickness (m); w is the specimen width (m); S1, S2 are the support spans (S1 > S2) (m); Y is the stress intensity shape factor.12
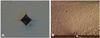
In order to produce a well defined surface controlled flaw for fractographic analysis approach, an indent was made on the polished surface using a Vickers indenter with a load of 49 N. Each indentation had a crack emanated from each corner. Ten ceramic specimens were loaded to fracture using a 4-point bending fixture (20 mm outer span, 10 mm inner span) attached to a universal testing machine. The load was applied with an indent on the tensile surface at the crosshead speed of 0.5 mm/min. The fracture loads were recorded and used for a statistical analysis. The following formula (A5) was used to calculate the flexural strength; δ (MPa).12

Where P is the load at failure (N); L is the centre-to centre distance between inner support rollers (mm); w is the width of the specimen; b is the thickness of the specimen.
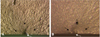
After fracture, these specimens were used for the fracture surface analysis. All specimens were cleaned with ethyl alcohol in an ultrasonic bath and sputter-coated with gold to enhance the perception of the fracture markings. The critical flaw size was measured on the fracture surface using an optical microscope at 160× magnification (Nikon Eclipse E400 Microscope, Nikon imaging Japan Inc., Fukuoka, Japan). The fracture toughness of each material was determined using the Griffith-Irwin equation (A6, A7).21
Where δf is the strength (MPa); c is the crack size (m), a is the cracks depth, b is the half-width.
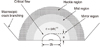
The fracture surfaces were observed using a scanning electron microscope (SEM, JSM-5410LV, JEOL Ltd., Tokyo, Japan) and SEM images were recorded from the representative fracture surfaces. The schematic diagram of the critical flaw size is shown in Fig. 3.
Independent samples t test was performed to determine if statistically significant difference existed between the mean KIc obtained from two different methods for each material. The α was set at 0.05.
RESULTS
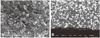
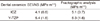
The mean fracture toughness values and standard deviation of two dental core ceramics obtained from two different methods are shown in Table 1. The mean fracture toughness of the glass-infiltrated dental ceramic obtained from the SEVNB method was significantly lower than that obtained from the fractographic analysis. The mean fracture toughness of zirconia-based material obtained from the SEVNB method was comparable with that obtained from the fractographic analysis. The microstructures and the representative photographs of the V-notch of two dental ceramics are shown in Figs. 4-6. For fractographic analysis method, the 49 N Vickers indentation with corner cracks on zirconia-based specimens is shown in Fig. 7. The failure of eight glass-infiltrated and nine zirconia-based ceramic specimens originated from the indentation cracks and used for the statistical analyses. The representative photographs of the critical flaw on the specimens fracture surface are shown in Figs. 7b and 8.
DISCUSSION
Most ceramic materials are well known for their brittle behaviors. Brittle fractures have certain characteristics on the fracture surfaces and analysis of the characteristic markings on the fracture surface has been widely used for failure analysis of advanced ceramics.17-19,22-26 The fracture surfaces of brittle solids contain several informative characteristic markings as shown in Fig. 3. There are few distinct areas surrounding the fracture initiation site, i.e., the mirror region, the mist region, the hackle region, and the macroscopic crack branching region. Size and shape of the boundaries depend on the stress distribution, shape of the crack, or elastic anisotropy of the microstructures. There have been some studies that used quantitative fractographic analysis to find the failure initiation sites and also to estimate the failure stress of the clinically failed restorations.17,18,22 The results from few studies also showed that fracture of clinically failed crowns originated at the internal surface and the core-veneer interface of the restorations.2,27 These findings were inconsistent with the results obtained from the in vitro investigation.2 Therefore, fractographic analysis of the clinically failed prosthesis could provide crucial data for use as guidelines for validating the laboratory testing procedures. In quantitative fracture surface analysis, the position of the critical flaw is located and its size is measured on the fracture surface using an optical microscope. The apparent fracture toughness of each material is determined using the fracture mechanics equation. Some studies have used this approach to determine the KIc values of many dental restorative materials15,17,18,22 and the results showed that fractographic analysis could provide comparable results to other testing methods.15,18
In this study, fractographic method was used to determine fracture toughness or KIc of glass-infiltrated (ICZ) and zirconia-based (Y-TZP) dental ceramics and compared with the KIc values obtained from the ISO recommended procedure or SEVNB method. These two materials used in this study were different in composition, microstructure, preparation process which resulted in the differences in the mechanical properties and clinical application. Therefore the comparison between these two materials was not the purpose of this study.
In this study, the indentation load of 49 N was used as it could provide a suitable controlled flaw for both Y-TZP and ICZ specimen as shown in the Fig. 7a. Different indentation loads were examined beforehand in order to verify the optimum load. The criteria for choosing the optimal indentation load were; (1) The presence of only four radial cracks, with the crack length 2.5 times longer than the half diagonal of the indentation, (2) The symmetry of the indentation, (3) The absence of chipping, (4) The absence of large pores along the perimeter of the indentation, (5) All cracks emanated from the corners of the indentation.3
There have been few studies focused in determining the fracture toughness of ICZ using an indentation strength method.6,28 The reported fracture toughness values were 4.0 and 4.8 MPa·m1/2 which were within the range of the values obtained from the SEVNB and fractographic methods in this study. The author suggested that the residual stresses resulted from the indentation were responsible for a slow crack growth, which occurred immediately after unloading the indenter. Depending on the interval time between the indentation and the crack measurement, the fracture toughness measured could be less than a specific value due to the residual stresses effect.29,30 For a zirconia-based dental ceramic, KIc obtained from the fractographic analysis method and the SEVNB method were also comparable to the results reported in other studies which were 6.4 MPa·m1/2 for fractographic analysis22 and 5.3-5.9 MPa·m1/2 for SEVNB method.10,11
A discrepancy between the KIc values obtained from the SEVNB method and that obtained from the fracture surface analysis was observed for ICZ and Y-TZP in this study, even the discrepancy detected in the Y-TZP group was not significantly different. The possible reason for this discrepancy could be the differences in specimen type and size, and the critical crack size. The effects of specimen type and size, and the critical crack size have been reported in advanced structural ceramics.31 Depending upon the testing method, specimen preparation and the testing environments, the differences in KIc values are commonly obtained even from a similar material.11,32 Different KIc testing techniques could have dissimilar benefit and limitations. Researchers who employ these methods are accountable for making a decision to use a suitable method for their application. Selecting the method that is appropriate for a desired material is, therefore, a challenging task and can affect the outcome of the experiment.
For SEVNB method itself, the discrepancy in the fracture toughness values obtained from this method has been extensively reported and the possible reasons for the variation could be the notch-root radius, additional cracks and stable crack extension.9-11,33,34 Regarding the notch radius, the wider a notch radius is, the higher the fracture toughness value is obtained. The recommended notch radius is less than the size of a major microstructural feature of a material, such as the grain size for a polycrystalline material. For a wider notch tip, lower stress concentration ahead of a notch requires a greater force to extend the crack catastrophically. This is one possible reason for the overestimated fracture toughness of the tested materials. The similar results were also obtained from another study that investigated the effect of the notch root radius on the KIc value.9 The notch root radii ranged from 18 to 167 µm were reported for Y-TZP and the measured KIc ranged from 5.9 to 13.6 MPa·m1/2. The authors confirmed that the notch radius was an important factor for determining the true KIc value of a material. The notch width effect was also reported in another study that used SEVNB method to evaluate the KIc value of other dental ceramics.35 The authors reported that the notch root radius should be of the same size as the major microstructural feature size. However, for Y-TZP materials, notch widths ranged between 15-30 µm were reported as acceptable notch widths because no significant influence was observed on the KIc values of Y-TZP.9,14 Regarding to the microstructure of Y-TZP ceramic as shown in Fig. 4, it was difficult to produce a notch that was extremely narrow for a material with the submicron grain sizes. In this study, the grain size of a zirconia-based material and ICZ were less than 1 µm and 10 µm, respectively. The notch width should be less than 2 and 20 µm for Y-TZP and ICZ. The representative notch features in this study are shown in Fig. 5. The notch tip radius were 17-62 µm for Y-TZP and 55-68 µm for ICZ which were very much wider than the recommended values. However, the obtained KIc values of Y-TZP in this study were in good agreement with the results reported from other studies.9,13 Therefore, the grain sizes of Y-TZP ceramics might not be the only major microstructural feature that controlled the width of the V-notch. For ICZ material, no information about the notch tip radius has been reported.
For preparation of the V-shaped notch, the size of the notch tip depends on the technique, razor blade tip and type of the diamond paste.36 Even the notch radius of 2 µm could be prepared for some materials, but it was more difficult to prepare this V-shaped notch in a material with high fracture toughness. Therefore, care must be taken in this step to ensure that a sharp V-notch is well prepared. Scherrer et al.3 showed the additional penny-shaped cracks generated at the bottom of a V-notch of a low-fusing dental glass (Duceram LFC®) during machining. The computations derived from these specimen was invalidated since straight-through crack conditions were lost and the critical crack length was underestimated for a given fracture stress. The underestimated crack length resulted in the underestimated fracture toughness.
The stable crack growth or pop-in of a small crack to form the initiation crack during the SEVNB test could affect the KIc test results.11,14 Some subcritical crack growth could result in a longer crack length than the notch length and this condition would lead to underestimated KIc value.
Even though it was straightforward in specimen preparation, less time consuming and less amount of specimens required for the SEVNB method, the limitation in notch preparation was experienced in this study. In order to obtain a true fracture toughness of a material, the geometry and size of the notch tips are crucial in the testing procedure. For a fine-grain Y-TZP, it is quite difficult to polish the notch tip to the size of the major microstructural feature as recommended for this technique. Also, the result obtained from a straight-through crack used in this method was considered the long-crack fracture toughness. A short-crack fracture toughness obtained from a small flaw should be more preferable in dental application because the sizes of critical flaws observed in failed restorations were in a range of few hundred microns. In this condition, an indentation-induced flaw and fracture surface analysis technique could obtain more relevant results comparing with the SEVNB method. As mentioned earlier that the fractographic analysis has been effectively used in failure analysis of failed dental restorations, as a characterization tool to obtain important information about the failure origin, fracture path and mechanisms of a specific material including its failure strength and fracture toughness. The difficulties of the fractographic analysis method depend on the nature of the material and its microstructure. For a glass-ceramic, the classic crack features left during crack initiation and propagation can be easily observed.19 The difficulty of detecting fracture marking can increase with the increase crystalline content, grain size and shape, amount of transgranular and intergranular fracture, and relative size of the fractographic features. The differences in material composition and reflectivity can also complicate the task of the fractographic analysis.19
CONCLUSION
The mean fracture toughness of zirconia-based material obtained from the SEVNB method was comparable with that obtained from the fractographic analysis. The mean fracture toughness of a glass-infiltrated dental ceramic obtained from the SEVNB method was significantly lower than that obtained from the fractographic analysis method. The difference in the obtained KIc values could be a result of the differences in the characteristics of the fracture initiating flaws of these two testing methods.


 XML Download