

 PDF
PDF ePub
ePub Citation
 Print
Print


INTRODUCTION
Metal-ceramic restorations have been introduced since 19621 and has been used widely in fixed dental prostheses for many decades as an esthetic restoration. Further considerations to improve esthetics and biocompatibility have led to the use of all-ceramic materials in dentistry.2 However, brittleness was exhibited as a major drawback with limited clinical use of all-ceramics.3 Since the advent of high strength zirconia in dentistry,4 zirconia-based material combined with CAD/CAM technology has broaden the range of their applications in dentistry. Due to its white opaque color, it has to be veneered with feldspathic porcelain for more acceptable esthetic outcome, but cohesive failure of the veneering porcelain have been identified as a main complication.5,6 In an attempt to reinforce the veneering porcelain, several trials, such as high strength CAD/CAM-fabrication of veneering porcelain,7 high strength heat-pressed ceramic,8 and "double veneering" technique,9 have been performed. Other approach to control the veneering failure could be a fabrication of monolithic zirconia which consists of a single zirconia material without any veneering.
To improve the esthetic appearance of ceramic restorations, there are two common surface treatment methods, such as polishing and glazing. Sequential polishing procedures using various diamond points, rubber wheels, and abrasive pastes may give a luster to the surface.10 Glazing can be created either by firing a small coating of transparent glass onto the surface or by heating the restoration up to glazing temperature for 1 or 2 minutes to get shiny gloss surfaces.10 Several studies11-13 have compared glazing with different polishing techniques for ceramic restorations regarding surface texture. They demonstrated that polishing on feldspathic porcelain could be used as an alternative method for glazing. Other studies14-16 investigated the effect of surface treatments on the color of porcelain restorations. According to these studies, surface treatments including glazing and polishing could affect the color of porcelain restorations.
Monolithic zirconia can be colored in a pre-sintered state to match the adjacent teeth. To achieve a natural looking appearance and smooth surface texture, monolithic zirconia can be either glazed or polished. However, there have been no reported studies that have investigated the effects of surface treatments on the color of monolithic zirconia.
The purpose of this study was to investigate the effect of polishing and glazing on the color and spectral distribution of monolithic zirconia. The null hypothesis to be tested was that there was no significant difference in color parameters and spectral reflectance between monolithic zirconia ceramics with the different surface treatments.
Go to : 
MATERIALS AND METHODS
Monolithic zirconia-based ceramic specimens were used for this study (Table 1). Forty-five square-shaped, pre-sintered zirconia blocks (20.0 mm × 20.0 mm × 2.7 mm) were prepared using a cutting machine (618 slicer, Harig, Niles, IL, USA).
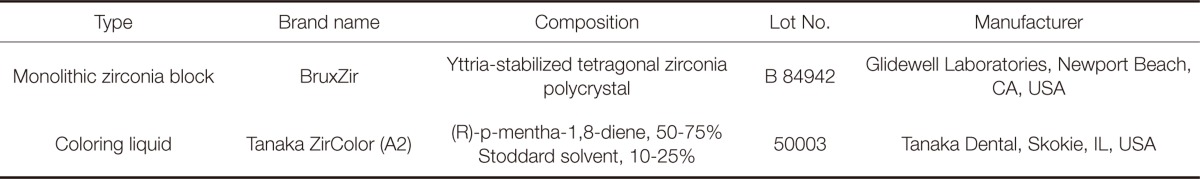
The coloring liquid (Table 1) was applied according to the manufacturer's recommendations with a brush (2850-B, Babara, Kobe, Japan). These specimens were divided into five groups according to the number of coloring liquid applications.
All specimens were then sintered in a zirconia sintering furnace (LHT 0217, Nabertherm GmbH, Bahnhofstr, Germany). The sintering cycle was controlled as the followings: The temperature was raised to 950℃ for 1.5 hours and maintained for 2 hours, and then raised up to 1,550℃ for 1.5 hours and maintained for 3 hours. After sintering process, the shrinkage of specimens was circa 20%. The mean size of sintered specimens was 16.3 mm × 16.4 mm, verified with a Vernier caliper (Mitutoyo, Tokyo, Japan).
The grinding procedure was performed on the opposite side of colored surface of each specimen to adjust the final thickness to 2.0 mm by the horizontal grinding machine (HRG-150, AM Technology, Kyunggi-Do, Korea). Final thickness was checked with a digital height gauge (Digimicro ME-50HA, Nikon Corp, Tokyo, Japan) with the accuracy of 1 µm on five different sites (center and each corner of specimen) of each specimen. The specimen thickness ranged from 1.90 mm to 2.02 mm. Nine specimens of each group were assigned to three subgroups according to the surface treatment (n = 3).
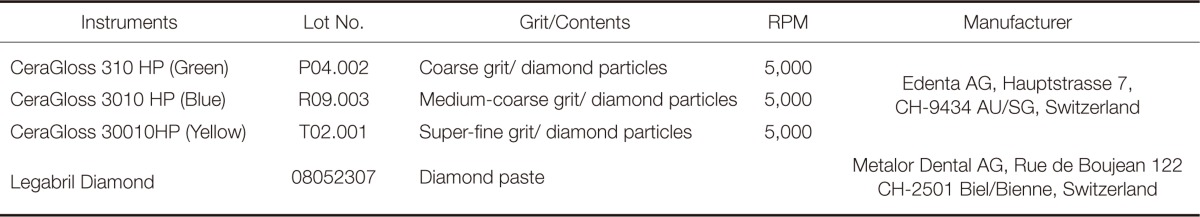
In Subgroup P, specimens were polished with a sequence of three diamond-impregnated silicone discs (green: coarse grit, blue: medium-coarse grit and yellow: super-fine grit, Edenta AG, Hauptstrasse, Switzerland) for 60 seconds each. Then, specimens were polished using a felt wheel (Super-Snap Buff,Shofu Inc., Kyoto, Japan) with diamond polishing paste (Legabril Diamond, Metalor Dental AG, Biel/Bienne, Switzerland) for 60 seconds each consecutively. Details of polishing instrument were described in Table 2.
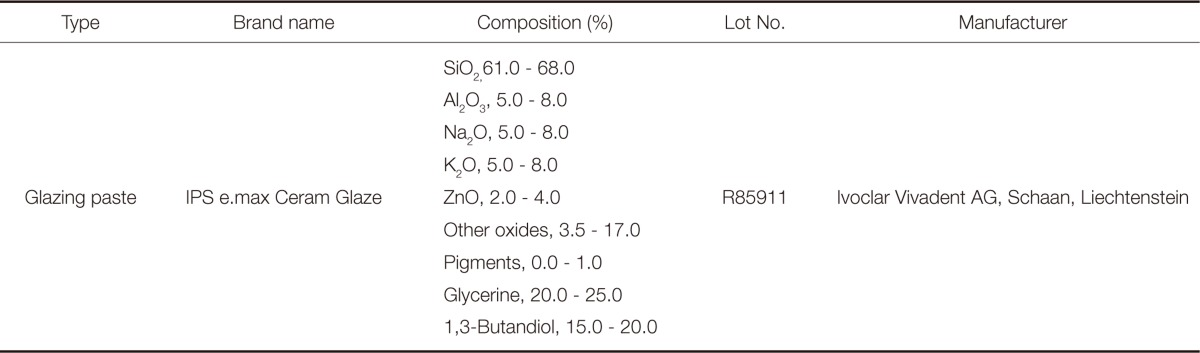
In Subgroup G, specimens were glazed in vacuum in a ceramic furnace (Austromat3001, DEKEMA Dental-Keramiköfen GmbH, Freilassing, Germany) using a glazing paste (IPS e.max Ceram Glaze, Ivoclar Vivadent AG, Schaan, Liechtenstein) (Table 3) for each, following the protocol: The temperature was raised up to 950℃ at the firing rate of 30℃/min, and maintained for 30 seconds, and then cooled down to 300℃ at 15℃/min. Subgroup N indicating no surface treatment served as a control. All specimens were ultrasonically cleaned in distilled water for 5 minutes before testing.
Colors were measured according to Commission Internationale de l'Eclairage (CIE) 1976 L*a*b* color space (CIELAB) in the reflectance mode relative to the standard illuminant D65 on a reflection spectrophotometer (CM-3500d, Minolta, Osaka, Japan), which was equipped with an integrating sphere. Illuminating and viewing configurations of this instrument were CIE diffuse/8-degree geometry and the 10° CIE 1964 supplementary standard colorimetric observer was selected. The aperture diameter of the measuring port of the spectrophotometer (Target Mask CM-A 121, Minolta, Osaka, Japan) was 3 mm. White calibrating plate (CM-A120, Minolta, Osaka, Japan) was performing for the white calibration standard for reflectance measurements, and zero calibration box (CM-A 124, Minolta, Osaka, Japan) was for zero calibration for reflectance measurements. CIE L*, a* and b* values were measured over a zero calibrating box (CM-A 124, Minolta, Osaka, Japan, CIE L* = 0.1099, a* = 0.2107 and b* = -0.4292) with specular component excluded (SCE) under ultraviolet light excluded conditions and spectral reflectance over the white background (CM-A120, Minolta, Osaka, Japan, CIE L*= 96.6880, a*= -0.1755 and b*= -0.1236) were measured in the range of visible wavelengths of 400 to 700 nm at 10 nm intervals. All measurements were performed on five different areas of each specimen including the center of specimen by moving it to each quadrant direction slightly.
Color coordinates, CIE L*, a* and b*, were determined from the reflectance data using a computer software (Spectra-Magic version 1.01, Minolta, Osaka, Japan). Average L*, a* and b* values were used to calculate CIE 1976 a,b (CIELAB) color difference, ΔE*ab of each groupset using the following equation.17
where, the L* coordinate represents the brightness of an object, the a* value represents the red or green chroma, and the b* value represents the blue or yellow chromas and ΔL*, Δa* and Δb* indicate the differences between the CIE L*, a* and b* color parameters of two specimen groups.
SPSS software (version 20.0, SPSS Inc., Chicago, IL, USA) was used for statistical analyses and the probability level for statistical significance was set at α=.05. The differences in the color values were determined by means of one-way analysis of variance (ANOVA) combined with Tukey's multiple comparison test. The correlation between CIE L*, a* and b* values of each surface treatment and the number of coloring liquid applications was found out by using the Pearson correlation coefficient. The linear regression was fitted to analyze the influences of the number of coloring liquid applications on CIE L*, a* and b* values of each surface treatment.
Go to :
RESULTS
Mean and standard deviation of L*, a* and b* values over a zero calibrating box in the reflectance mode within each group as a function of surface treatment are listed in Table 4. As for L* value, there was a significant difference between Subgroup N and P in each group, and between Subgroup N and G in each group except Group I. There was no significant difference between Subgroup P and G in Group I, III and V. As for a* value, there was a significant difference between Subgroup N and P in Group II, IV and V and between Subgroup P and G in Group IV and V. There was a significant difference between Subgroup N and G except Group V. As for b* value, there was no significant difference between Subgroup N and P in Group II, IV and V. There was a significant difference between Subgroup P and G in each group, and between Subgroup N and G in each group except Group I.
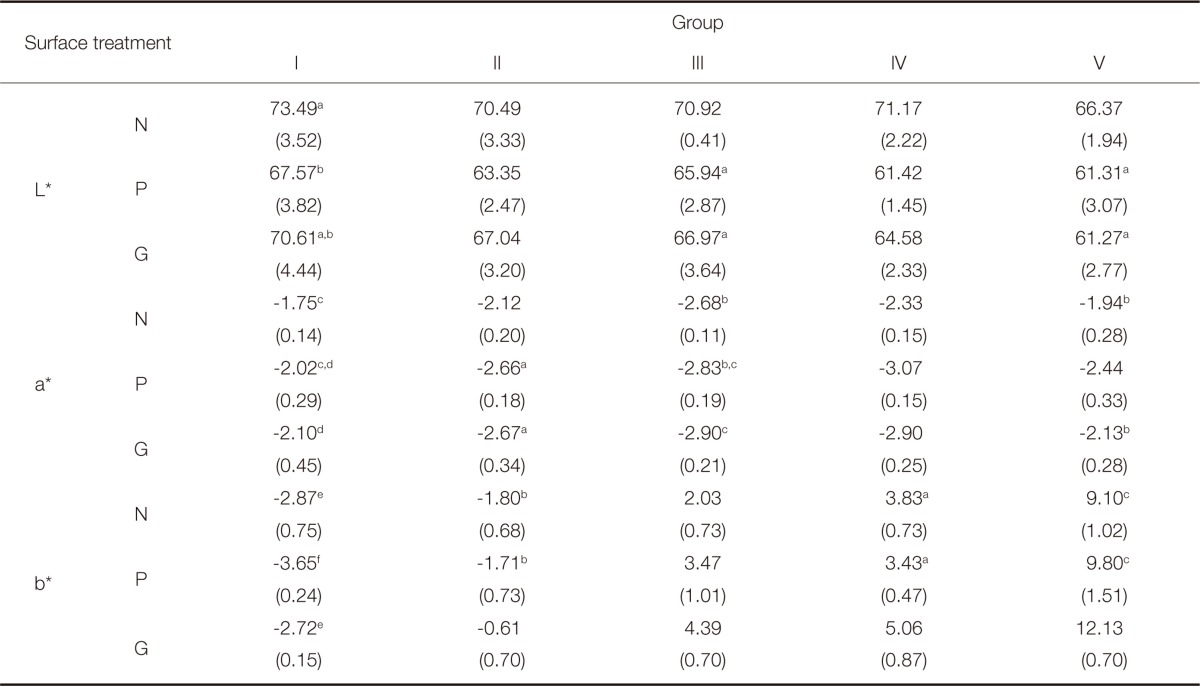
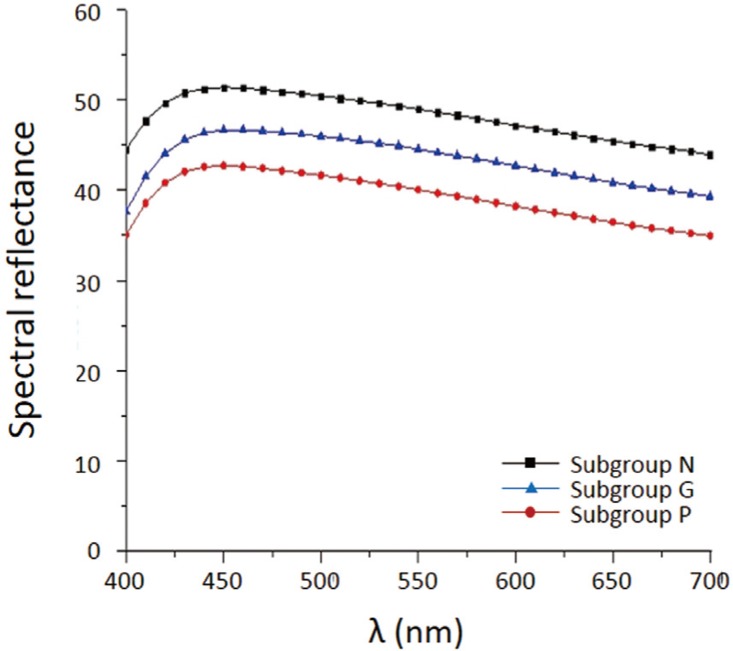
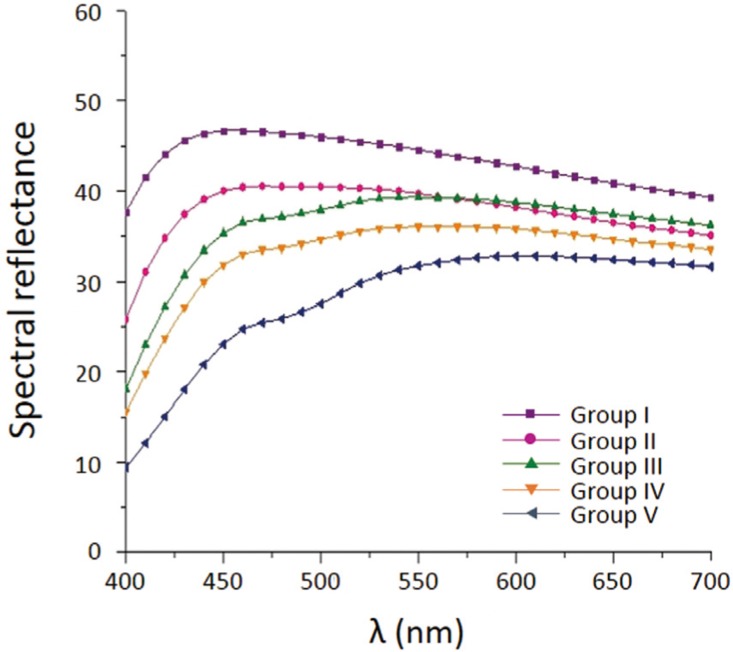
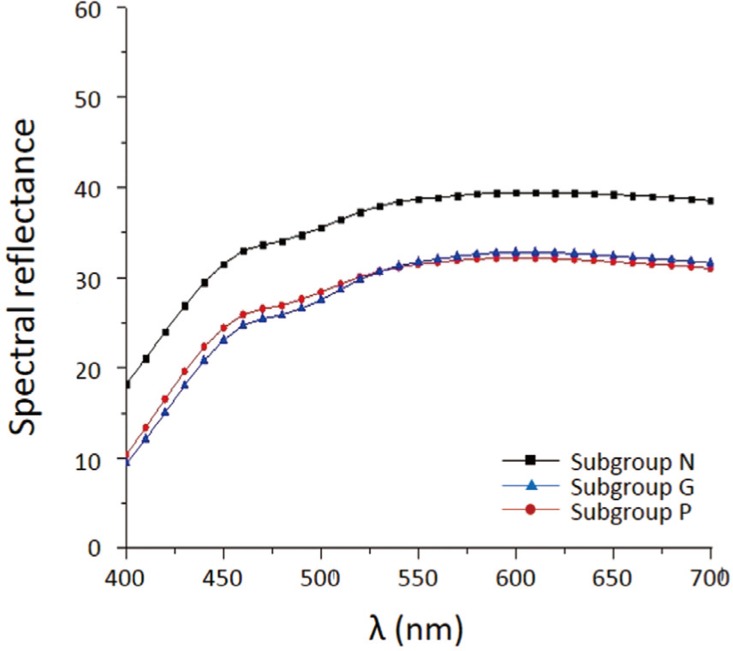
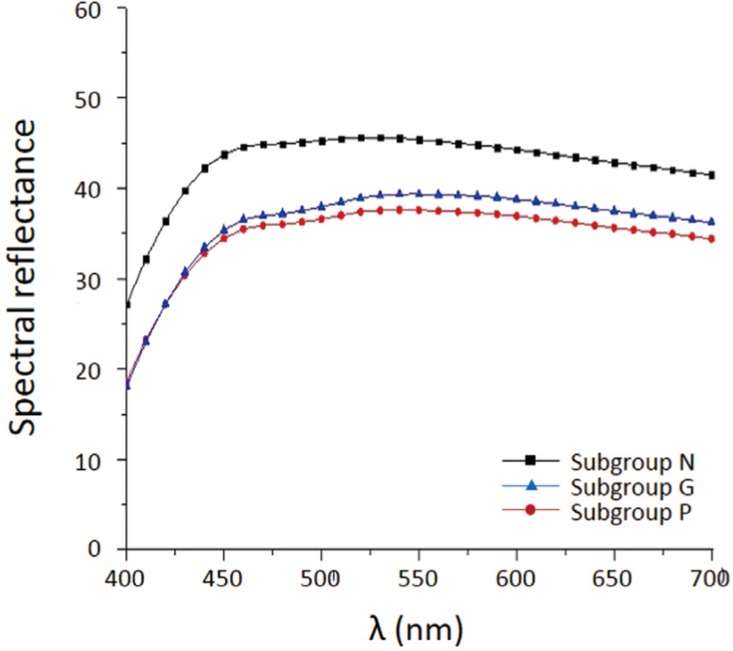
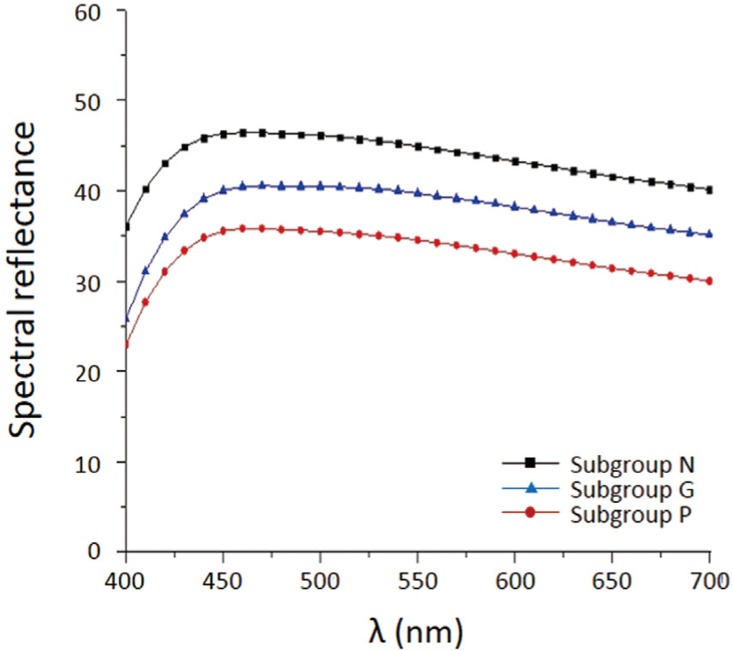
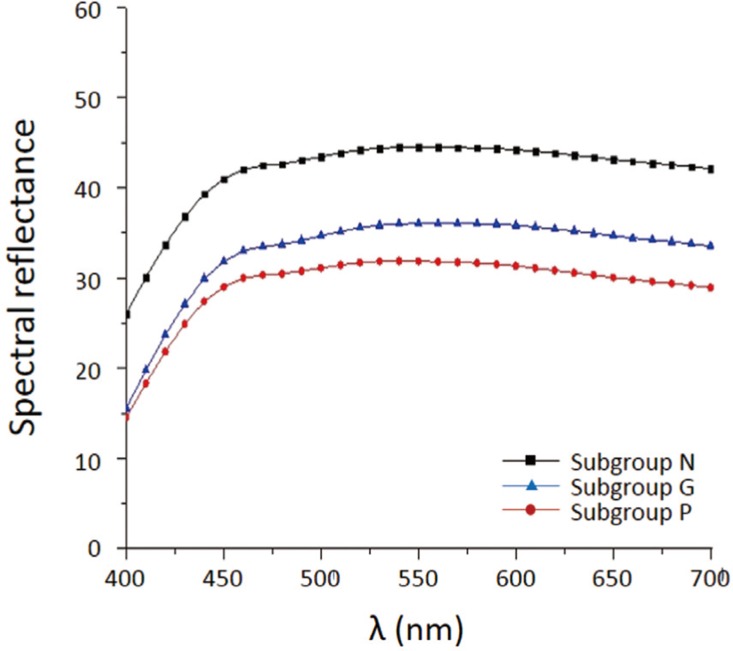
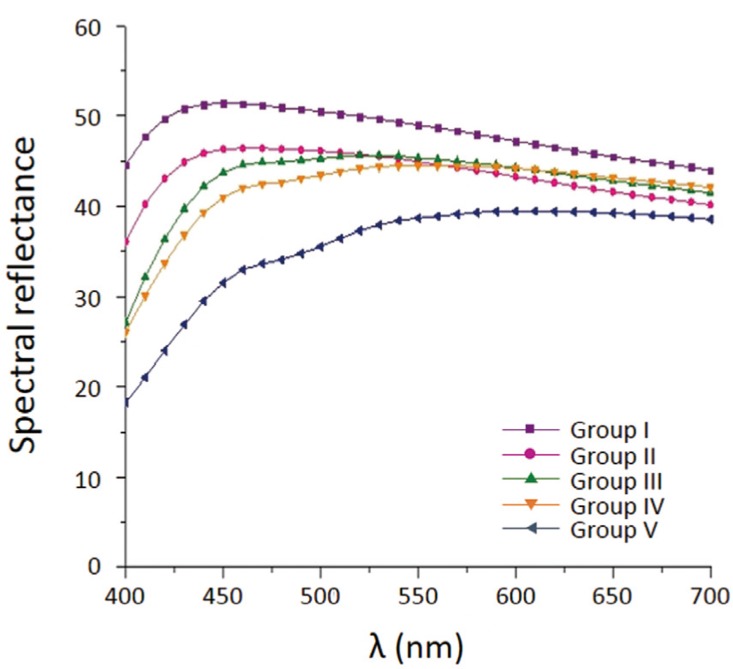
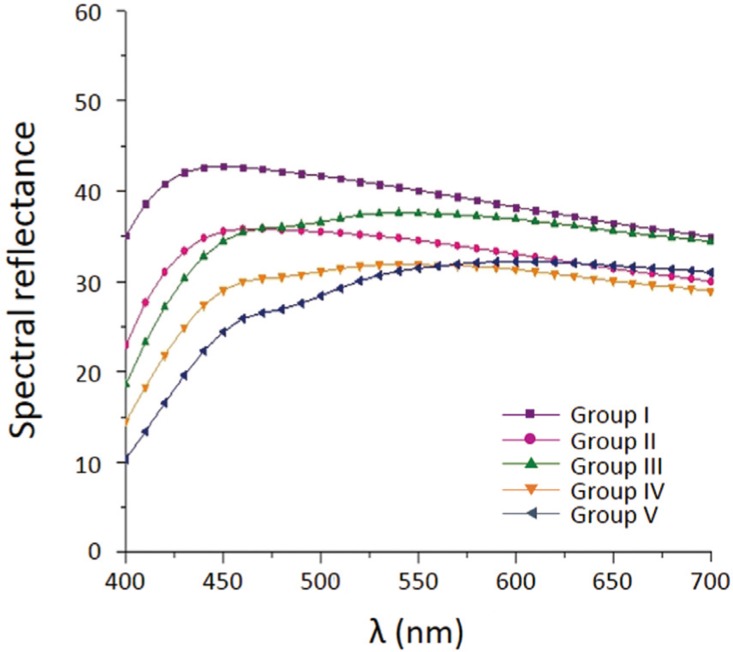
Fig. 1 to Fig. 8 show the spectral reflectance against the white background of specimens within groups. Each surface treatment exhibited similar spectral behavior through the entire spectrum in the range of 400 to 700 nm, but the values of spectral reflectance in Subgroup P and G were generally lower than those in Subgroup N (Fig. 1 to Fig. 5). There was no significant difference between Subgroup P and G in Group I, III and V (Fig. 1, Fig. 3 and Fig. 5). There was significant difference between each surface treatment in Group II and IV (Fig. 2 and Fig. 4), representing the highest value in Subgroup N and the lowest value in Subgroup P except for the short wavelengths of circa 400 nm (α=.05). Fig. 6 to Fig. 8 presented the spectral reflectance of each group within Subgroup N, P and G. There was tendency for gradual decrease of spectral reflectance as the number of coloring liquid applications increased in Subgroup N, P and G especially for the short wavelengths.
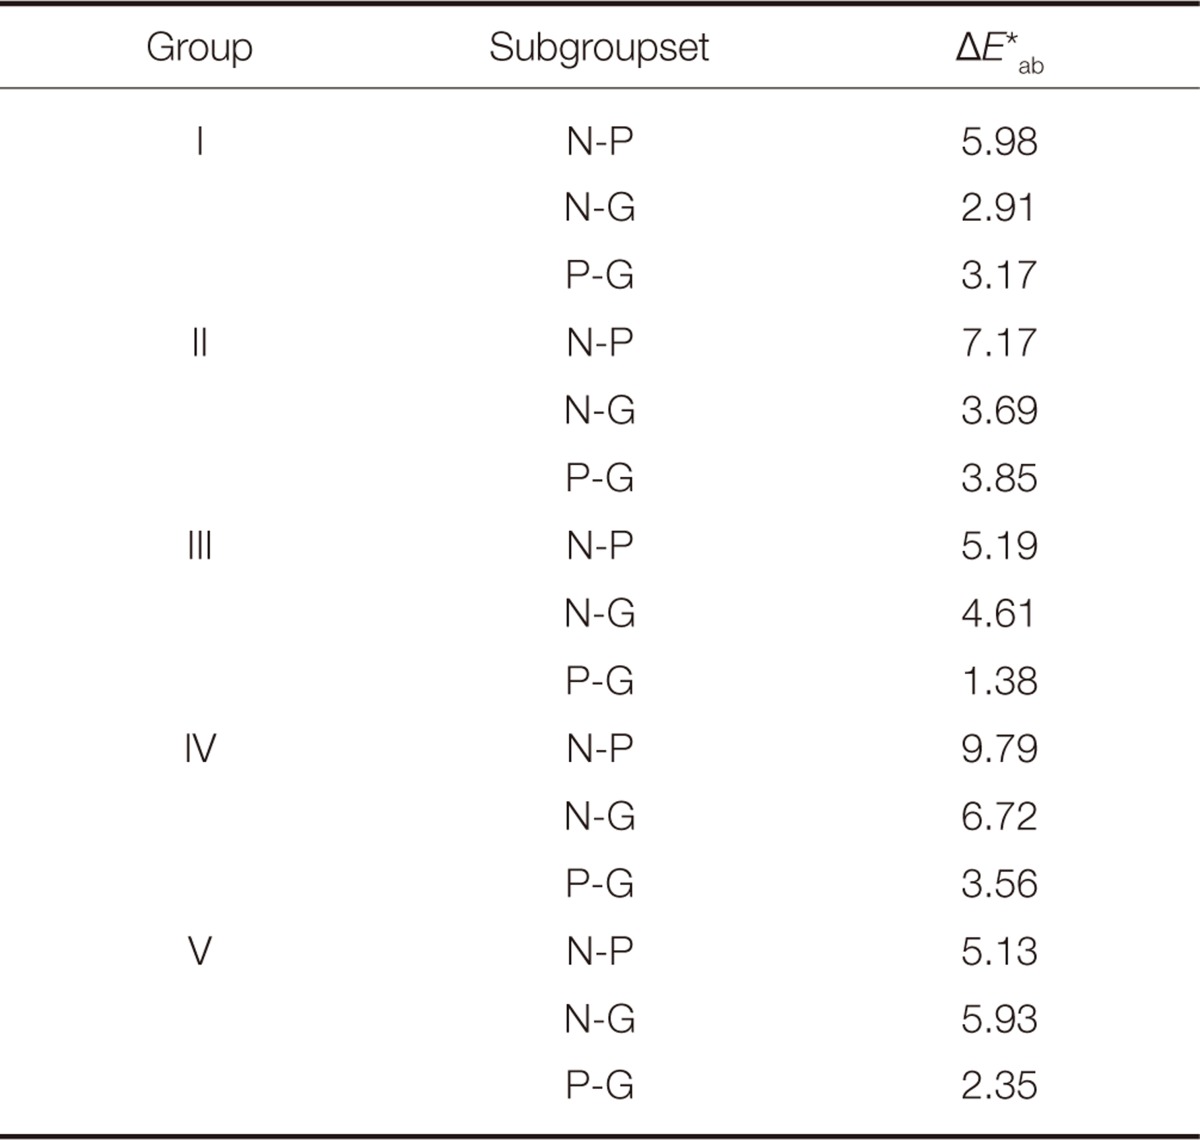
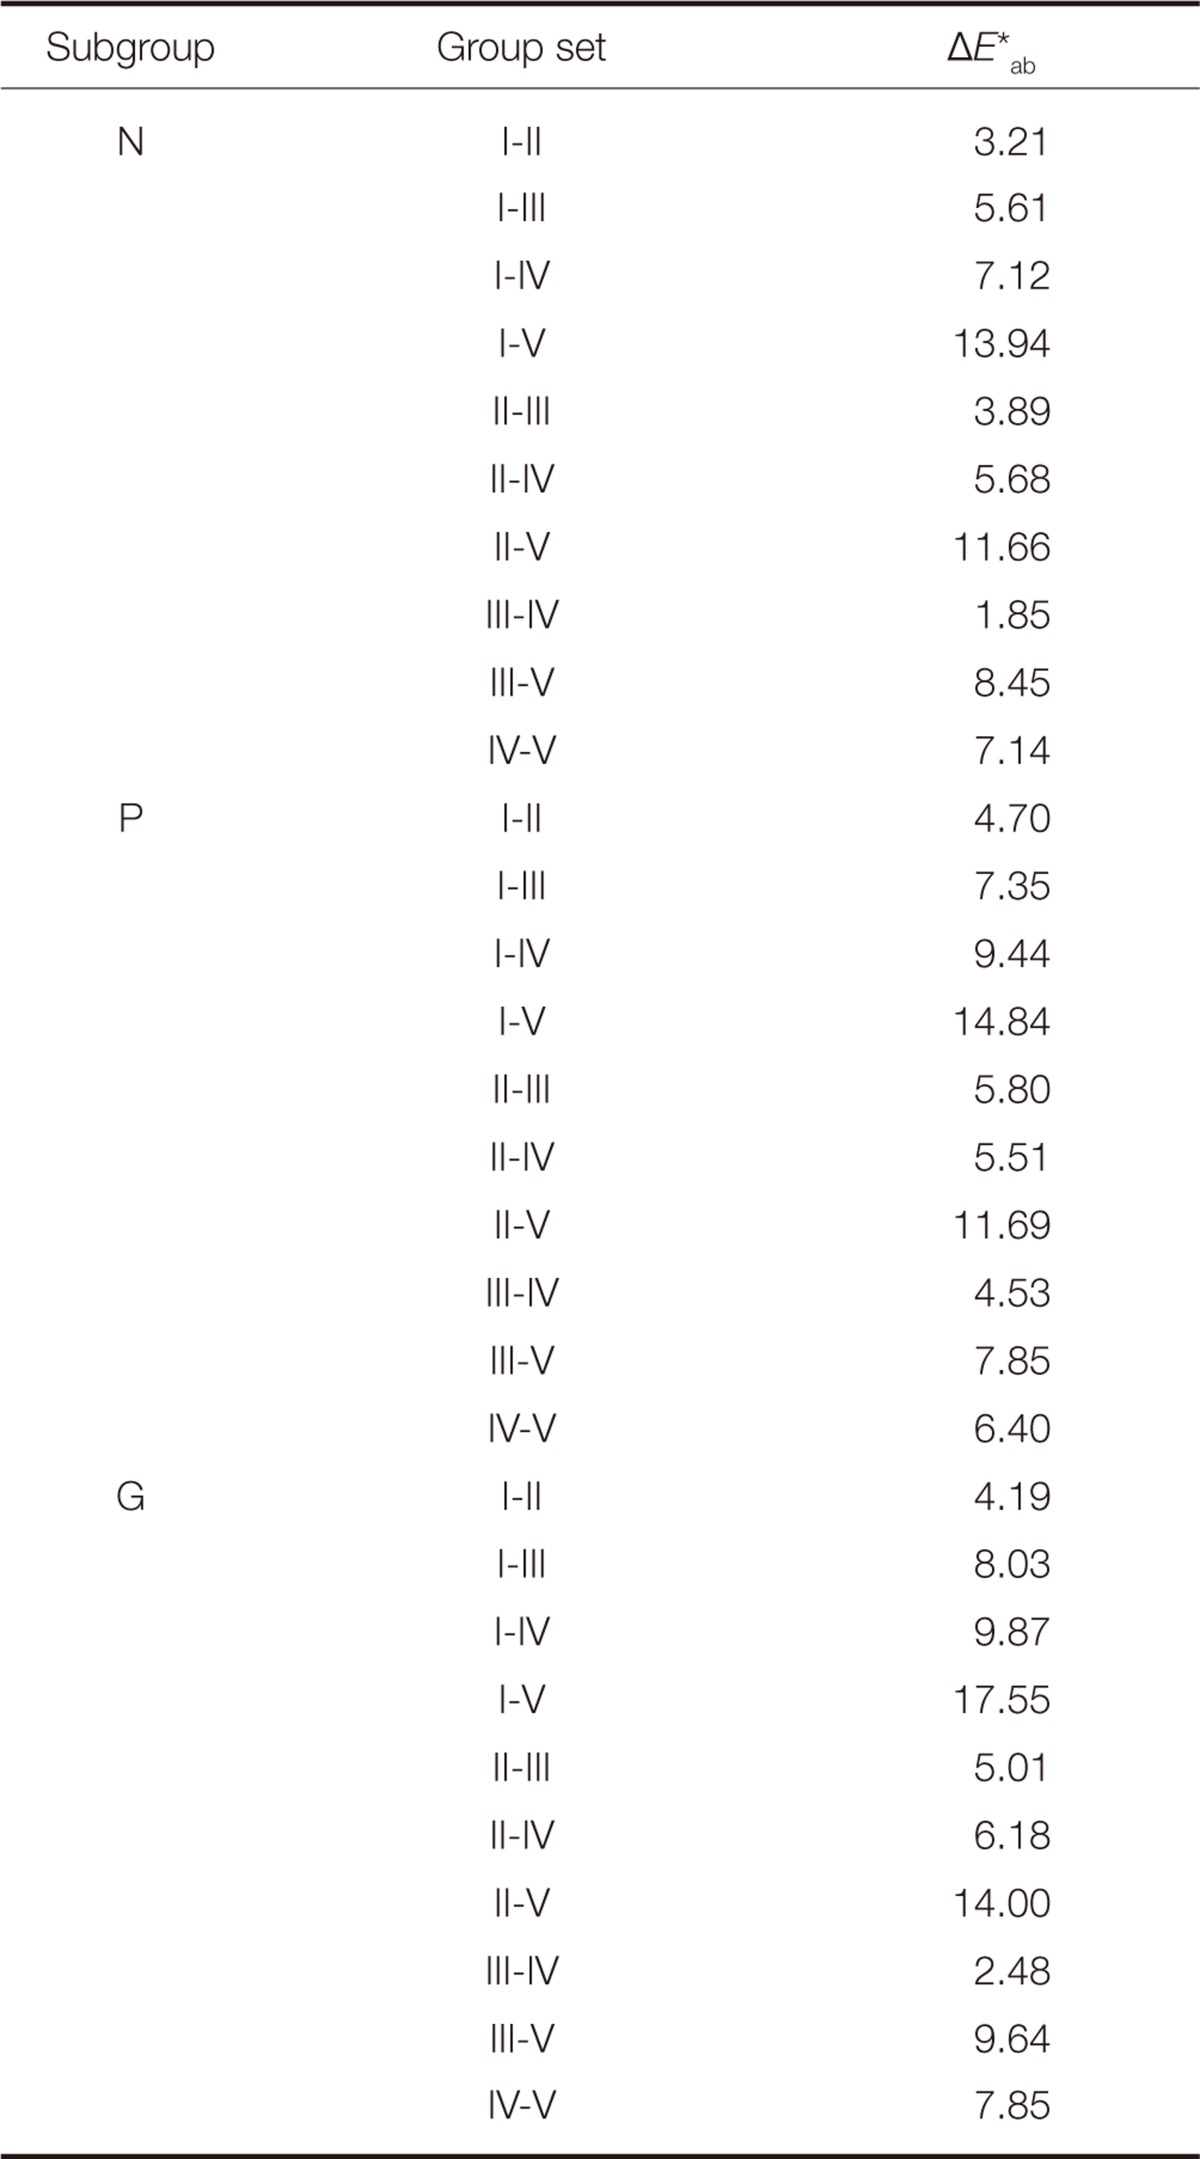
Color differences (ΔE*ab) between each pair of surface treatments within groups are shown in Table 5. Color difference between Subgroup N and P showed the highest values in comparison with the other pairs of surface treatments for the entire group ranged from 5.13 to 9.79 ΔE*ab units, which are clinically perceptible (ΔE*ab > 3.7). Color difference between Subgroup N and G was in the range from 2.91 to 6.72 ΔE*ab units. A perceptible color difference was obtained between Subgroup N and G in Group III, IV and V. Color differences between Subgroup P and G are within the range of perceptibility threshold except Group II. Color differences between each group set in Subgroup N, P and G were shown in Table 6. Color difference between each pair of groups was in the range from1.85 to 13.04 in Subgroup N, from 4.53 to 14.84 in Subgroup P, from 2.48 to 17.55 in Subgroup G, respectively. In general, a perceptible color difference was obtained in each group set.
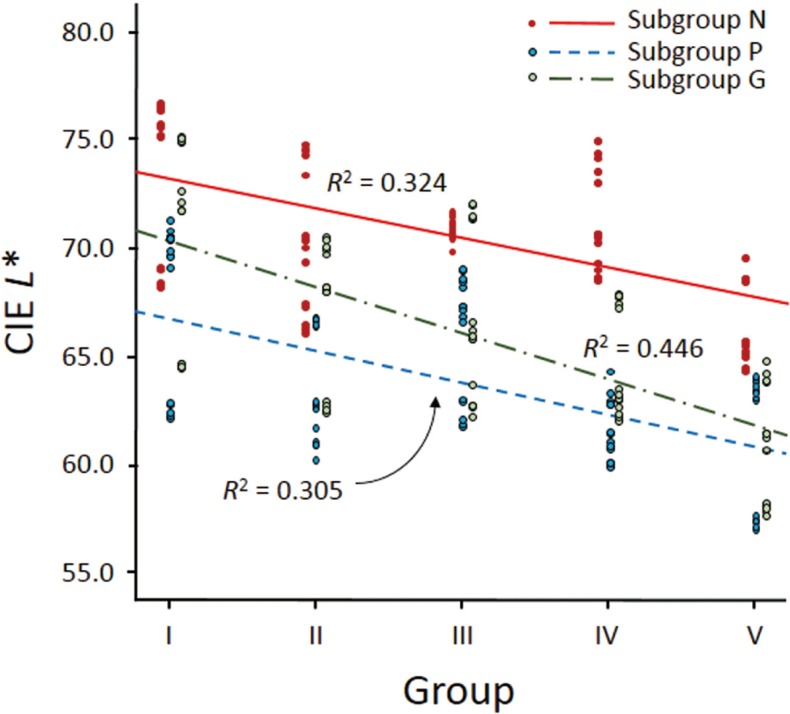
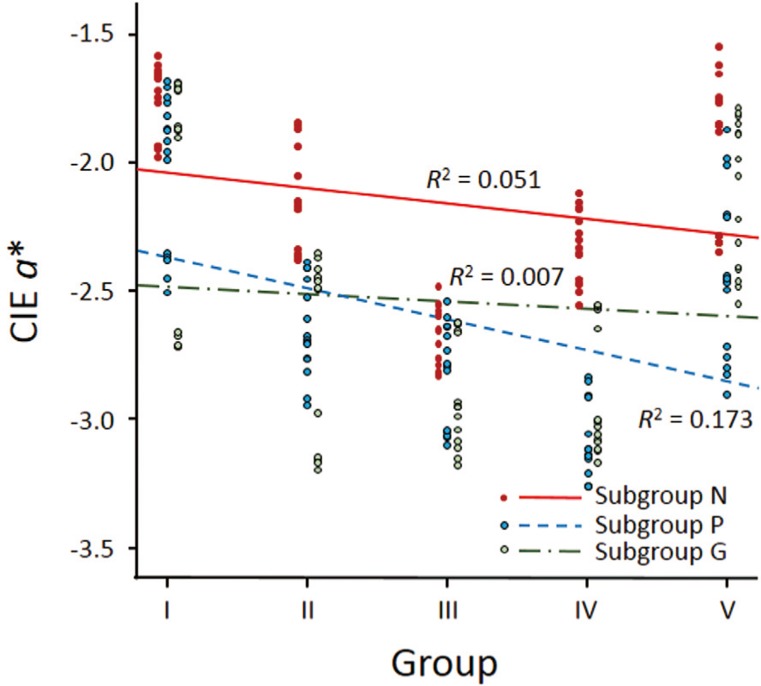
Correlations between the number of coloring liquid applications and CIE L*, a* or b* values in each surface treatment were identified. In all subgroups, CIE L* tended to be decreased and CIE b* value tended to be increased as the number of coloring liquid applications increased. There was a significant correlation between the number of coloring liquid applications and CIE b* value indicating r value to be 0.960 and R2 to be 0.922 in Subgroup N, r value to be 0.948 and R2 to be 0.899 in Subgroup P, and r value to be 0.962 and R2 to be 0.925 in Subgroup G, respectively (Fig. 9). There was a negative correlation between the number of coloring liquid applications and CIE L* value in each surface treatment (Fig. 10), whereas no significant correlation was found between the number of coloring liquid applications and CIE a* value (Fig. 11).
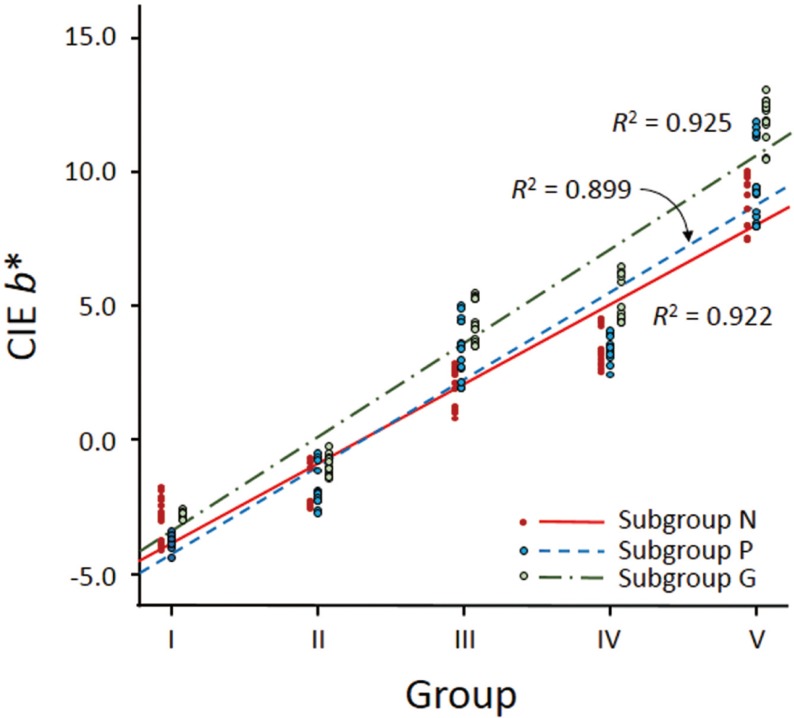 | Fig. 9Linear regression of CIE b* values of each subgroup over a zero calibration box in the reflectance mode as a function of the number of coloring liquid applications.
|
Go to :
DISCUSSION
This study was aimed to investigate the effect of polishing and glazing on the color and spectral distribution of monolithic zirconia. Color can be modified by various optical properties, such as scattering, transmission, absorption, reflection and refraction. Furthermore, surface gloss and fluorescence can also have an effect on color modifications.18 With regards to surface texture, smooth surface could induce more light reflection,18 whereas rough surface could cause the deviation of the reflection of specular component.19 Obregon et al.18 investigated the porcelain samples with different degrees of surface roughness on the color shift. They demonstrated that different surface textures produced significant differences in hue, chroma and value. Value represented the most significant changes following the modification of surface texture with the smooth surface increasing the value. In addition, there was a shift in hue toward the yellow-red scale with the highly glazed surface. Chung20 evaluated the effect of polishing procedures on the color and surface roughness of resin composite. In his study, polishing procedures produced a decrease in surface roughness and an increase in lightness value. Lee et al.19 evaluated the effect of surface conditions on the color of dental resin composites with two different measuring geometries, i.e., specular component included (SCI) and specular component exclude (SCE). They found that CIE L* values increased after polishing with the SCE. In the study of Kim et al.,14 surface topography influenced especially CIE L* value of porcelain specimens. CIE L* value of glazed surface was lower than that of polished surface whereas, CIE a* and b* values increased after glazing. Color differences between polished and glazed surfaces were clinically perceptible (ΔE*ab> 3.7). In the present study, CIE L* values decreased after polishing and glazing. CIE L* values showed the lowest values after polishing even though there were no statistically significant differences between polishing and glazing in some groups. For several studies with resin composites19,20 and feldspathic porcelains,14,18 polishing or glazing procedures resulted in smooth surfaces which could reflect a greater amount of light than a rough surface. As a result of reflection of incident light, lightness value increased.21 On the other hand, in the present study, polishing or glazing decreased lightness value. Light scattering could be an important factor in determining translucency of the material.22 Zirconia is polycrystalline structure which can induce maximum scattering effect.23 Thus, zirconia has an opaque appearance to visible light. Based on the results of the present study, surface treatments, such as polishing and glazing, seemed to reduce light scattering of zirconia surface. Therefore, spectral reflectance decreased after polishing or glazing and lightness value decreased accordingly. Further study should be required to determine whether polishing or glazing procedure affect translucency and opalescence of monolithic zirconia materials.
In the present study, polishing or glazing demonstrated a shift in CIE a* value toward green which is contrary to the previous reports.14,18 There was no statistical difference in CIE a* value between polishing and glazing in Group I, II and III, but polishing showed lower CIE a* value than glazing in Group IV and V. It seemed that there might be a difference in red-green color between glazing and polishing when the number of coloring liquid applications was beyond four times.
In the present study, glazing increased yellowness when the number of coloring liquid applications was beyond two times. Contrary to glazing, polishing exhibited relatively stable yellow-blue color axis. Glazing procedure demonstrated more color deviation which might be related with any chemical breakdown at elevated temperature.18 Additional firing might cause any structural changes of monolithic zirconia. This needs to be evaluated in further studies. Moreover, the degree of glossiness after glazing can be controlled either by firing time or by the furnace temperature.24 Modification of color after glazing might be different according to different glazing procedures.
Color differences between no treatment and polishing was higher than between no treatment and glazing. This would be caused by the higher difference of lightness value between no treatment and polishing. This is in accordance with Chung's study20 which demonstrated that color difference was mainly determined by the lightness rather than the hue and chroma. In the present study, based on the criterion of clinically perceptible color difference by Johnston and Kao,25 color differences between no treatment and polishing can be perceived in a clinical setting (ΔE*ab> 3.7). Color difference between no treatment and glazing can also be detectable in a clinical setting. Thus, surface treatment, whether glazing or polishing, could modify the color interpretation. However, there were no perceptible color differences between polishing and glazing in most groups, which means that human eye cannot detect the color difference between these two procedures.
In this study, there were highly significant correlations between CIE b* value and each subgroup as a function of the number of coloring liquid applications. There were negative correlations between CIE L* value and each subgroup, whereas there were no significant correlations between CIE a* value and Subgroup N and G. Hence, the lightness decreased and the yellowness increased as the number of coloring liquid applications increased, and this tendency was not changed even after polishing or glazing procedure.
According to the result of the present study, the null hypothesis could be rejected because there were significant differences in CIE L*, a* or b* value and spectral reflectance between different surface treatments.
There are several limitations of this study. Uniform degree of glazing on the specimen surface was difficult to achieve. Uniform application of glazing paste without any void would be a sensitive technique. There might be temperature fluctuation inside the furnace. In addition, the aperture diameter of spectrophotometer used in this study was 3 mm and possible edge loss would affect color measurement.
For a perfect color match of monolithic zirconia restorations, clinicians should take into account the possible color deviations after polishing or glazing at the time of shade selection. Furthermore, different shade guides considering any color changes following surface treatments can be helpful for monolithic zirconia restorations.
Go to :
CONCLUSION
Within the limitations of this study, the following conclusions can be drawn. A perceptible color difference can be detectable after polishing of monolithic zirconia. Polishing decreases the lightness, and glazing also decreases the lightness, but increases the yellowness of monolithic zirconia. The increased number of coloring liquid applications makes monolithic zirconia darker and more yellowish, which is also applied after polishing or glazing procedure.
Go to :
 XML Download