

 PDF
PDF ePub
ePub Citation
 Print
Print


INTRODUCTION
Recently, substantial improvement in dental materials enables wide use of a variety of new systems in clinical dentistry. There has been a growing interest in all-ceramic materials due to their favorable esthetics and outstanding biocompatibility. All-ceramic restorations have been routinely used in restorative dentistry, and favorable clinical performance has been reported especially when used to replace the anterior teeth.1 Although ceramics are superior in terms of biocompatibility and permeability to light, it is an essentially brittle material; thus when it is used in posterior crowns, which are subjected to stronger bite forces than anterior crowns, the likelihood of fracture becomes greater.2 Despite the improvement in the ceramic materials' strength, the failure rate of posterior all-ceramic crowns is reported as 3% to 4% each year.3-7 Veneer porcelain fractures of posterior zirconia restorations were either reported as minor or major chipping, leading to a main cause of failure, and the rate could be as high as 25%.8-17
Proper understanding of the mechanical behavior occurring in the zirconia crown during function might offer an essential tool for the assessment and reduction of veneer fracture risks, ensuring optimal performance in posterior teeth replacement. Due to the complex geometry, investigation of stress distribution within teeth is very complicated. The three dimensional finite element analysis (3D FEA) might be a powerful tool to visualize the problems due to its ability to vary material and specimen configurations, makes it possible to predict stress distributions and the mechanical behavior of complex structures that can hardly be measured in vivo. Structural analyses of the integral process of veneered zirconia crown through FEA may enable a study of the interaction of the many variables and provide valuable information concerning design parameters that favor lower stress patterns in veneer porcelain.
In FEA, geometric solid model is divided into a finite number of elements, and during simulation, computer calculates the stress and strain in each element resulting from thermal change, external force, and other factors.18 The numerical results obtained can then be analyzed with special visualization software program to view a variety of parameters and a critical site of interest.18
Anatomically idealized models representing clinical details of veneer-core-cement-tooth systems are rare in the dental biomechanics field due to time-consuming solid computer-aided design (CAD) and potential increases in meshing and computing time. Dental applications of FEA are already known in some fields of restoration.2,18-21 However, little information regarding variation of core designs in stress distribution of anatomically idealized model has been available.
The objective of this study was to evaluate the stress distribution and maximum principal stresses (MPS) within posterior zirconia crowns as a function of the core design under various loading conditions and position using three-dimensional finite element analysis.
Go to : 
MATERIALS AND METHODS
A 3D FEA consists in dividing a geometric solid model into a finite number of elements in which the variables of interest are approximated with some mathematical functions.
Full-coverage crown preparation was performed on the mandibular right first molar of the Nissin study model (D85DP-500B.1, Nissin Dental, Japan). The chamfer with a depth of 1.2 mm and 8 degree angle of convergence was formed with carbide bur, which has a 4 degree angle of incidence (Komet H 356 RGE 103.031, Gebr. Brasseler, Lemgo, Germany). Tooth preparation was made by using a surveyor (F1, DeguDent GmbH, Kanau, Germany) for the purpose of ensuring standardization of the preparation.
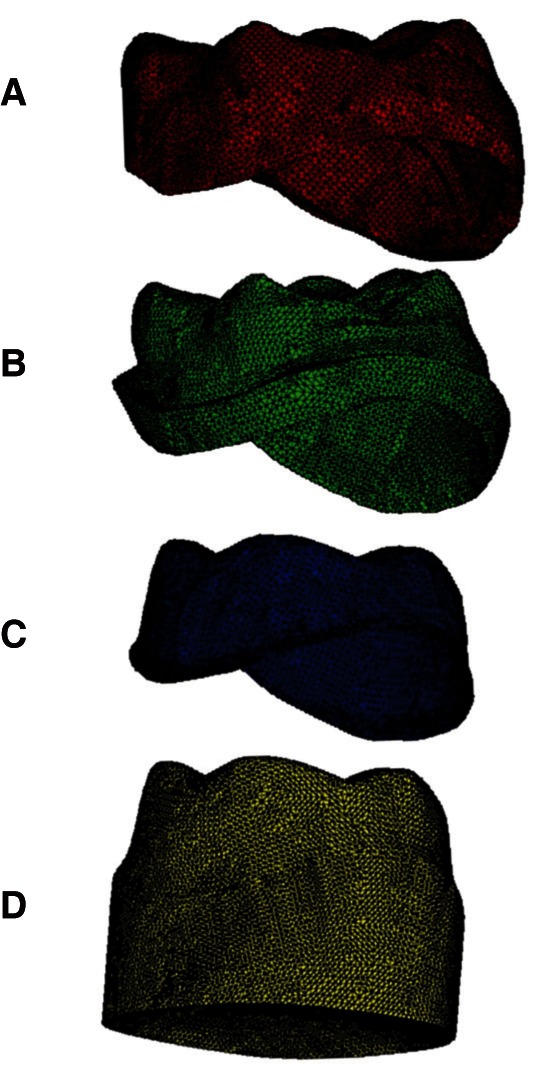
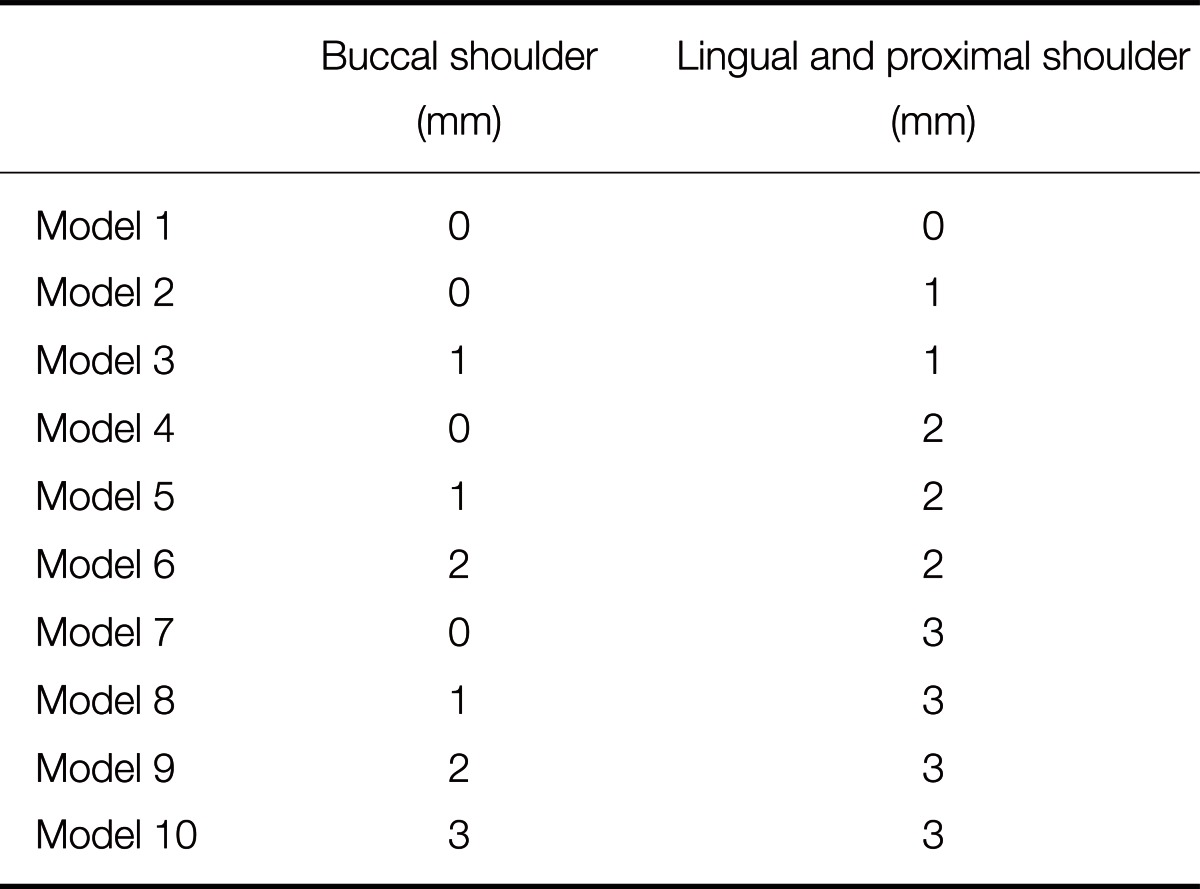
The crown was realized by digitizing the prepared and unprepared mandibular right first molar resin model with an optical scanner (Optical 3D Scanner Activity 101, smart optics Sensortechnik GmbH, Bochum, Germany). The core and veneer porcelain were then designed using unprepared tooth resin model for the external shape of crown by CAD (FreeForm modeling systems, Sensable-Geomagic, MA, USA) (Fig. 1), and STL files were exported. The shoulder (1 mm in width) variations in core used in this study were incremental increases of 1 mm, 2 mm and 3 mm in proximal and lingual height, and buccal height respectively and are listed in Table 1. In this process, ten different models were realized according to core designs. The solid models of a veneer layer (1 mm thick veneer porcelain), a core layer (0.5 mm thick zirconia), a cement layer (100 µm thick resin cement), and a tooth preparation (dentin) were then generated imitating the scanned images by CAD software (HyperWorks 10.0, Altair Engineering, Ontario, Canada) (Fig. 2). The veneered zirconia crown, the cement layer and the abutment tooth were assembled in the final model.
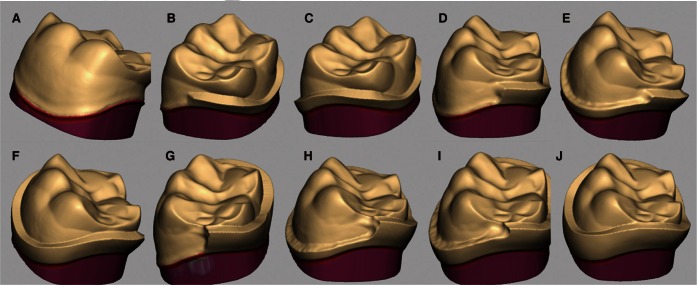 | Fig. 1Schematic representation of the shoulder variations in the zirconia core created in CAD software. The shoulder (1 mm in width) variations in core were incremental increases of 1 mm, 2 mm, and 3 mm in proximal and lingual (PL) height, and buccal (B) height respectively. A: no shoulder, B: PL 1mm, C: PL 1 mm and B 1 mm, D: PL 2 mm, E: PL 2 mm and B 1 mm, F: PL 2 mm and B 2 mm, G: PL 3 mm, H: PL 3 mm and B 1 mm, I: PL 3 mm and B 2 mm and J: PL 3 mm and B 3 mm.
|
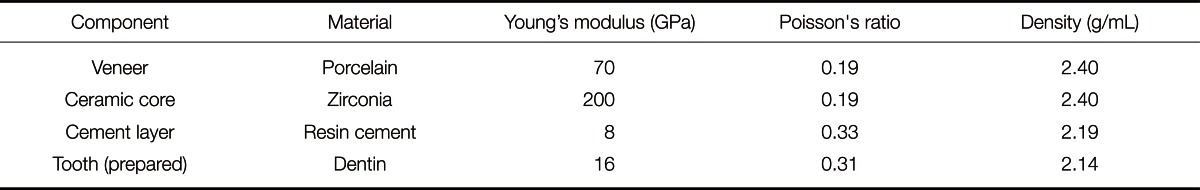
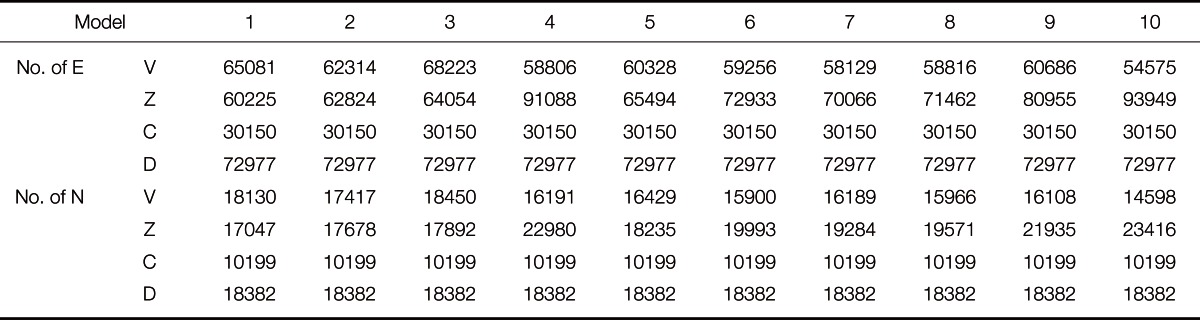
The assembled solid models were imported into an FEA software (ABAQUS/CAE 6.9, Dassault Syst èmes, Vélizy-Villacoublay, France) using the INP format. The solid model was then meshed with 4 node linear tetrahedral elements. Material properties of veneer, zirconia core, cement, and dentin were also assigned to each element and are listed in Table 2. Thus a 3D finite element model consisting of elements and nodes representing the veneered zirconia crown in mandibular right first molar was constructed. Elements and nodes consist in FEM are listed in Table 3.
The following assumptions were made with the aim of simplifying the calculations: (1) all solids were assumed homogeneous, isotropic, and linear elastic throughout the entire deformation, (2) there are no slip conditions among components (absolute bonding), (3) the cement layer is of uniform thickness (100 µm thick), (4) the core is of uniform thickness (0.5 mm thick) except shoulder, (5) there are absence of flaws in all components, (6) all degrees of freedom constrained at the root component surface.22
Two different situations were simulated: a vertical (axial) direction compression test simulating maximum bite force, and three directions compression test that simulated contact with the opposite tooth during function. In these simulations, the prepared tooth model had to be constrained apically to the finish line. A load of 700 N, simulating maximum bite force,23,24 was applied simultaneously at the following loading points in a vertical direction : three points on the outer inclines of each buccal cusp, three points on the inner inclines of each buccal cusp, and two points on the inner inclines of each lingual cusp (Fig. 3).2 A load of 280 N, in order to simulate masticatory force, was applied concurrently at the following loading points: three points on the outer inclines of the buccal cusps, and two points on the inner inclines of the lingual cusps. The load was applied from three directions: vertical direction (at 0° to the tooth axis), angular direction (at 45° to the tooth axis, towards the lingual margin), and horizontal direction (at 90° to the tooth axis, towards the lingual surface) (Fig. 3).
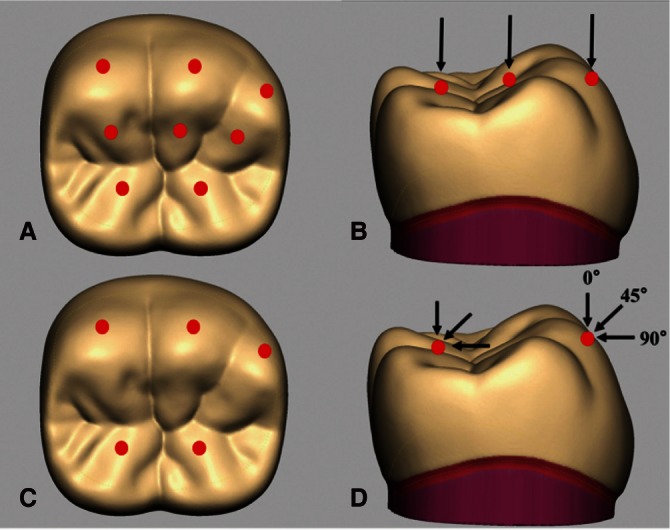 | Fig. 3Loading points and directions simulating maximum bite force (A and B) and masticatory force (C and D). A: Three points on the outer inclines of the buccal cusps, three points on the inner inclines of the buccal cusps, and two points on the inner inclines of the lingual cusps were loaded. B: A total load of 700 N was applied from the axial (vertical) direction. C: Three points on the outer inclines of the buccal cusps and two points on the inner inclines of the lingual cusps were loaded. D: A total load of 280 N was applied from three directions.
|
Numerical results were obtained for the two simulations.
Go to :
RESULTS
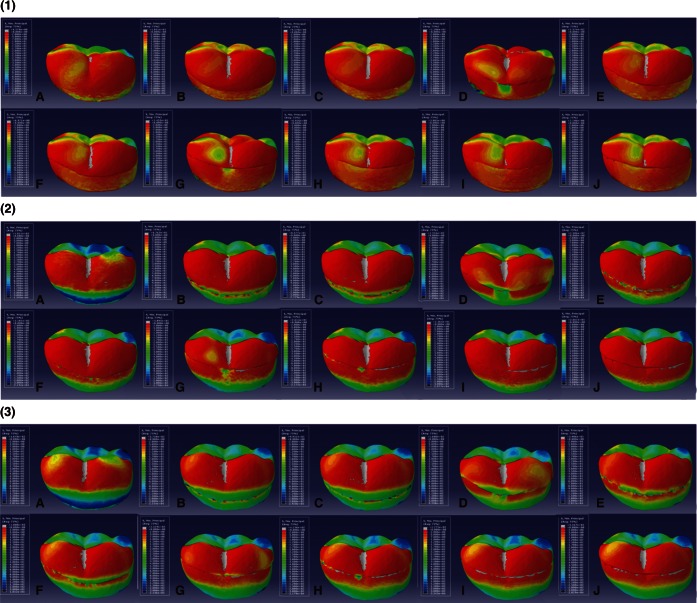
Fig. 4 and 5 show the maximum principal stress (MPS) which was evaluated for the ten models under maximum bite force. Ten models had different distribution of MPS. This depicts the relative decrease in MPS levels as a function of shoulder increase at the ceramic core cervical region. It was observed that the MPS area on the buccal shoulder increased and that on the buccal veneer decreased as the height of the buccal shoulder increased up to 3 mm from the margin. This phenomenon was dramatic in model 10 which had the highest buccal shoulder. However, the decrease of MPS on the veneer was small even the height of shoulder increased gradually except for model 10. As the height of the lingual shoulder increased, the MPS on the lingual shoulder increased and that on the lingual veneer decreased. Interestingly, the MPS on the proximal margin area was high in all models. The models those had 3 mm height lingual shoulder showed high MPS on the lingual shoulder.
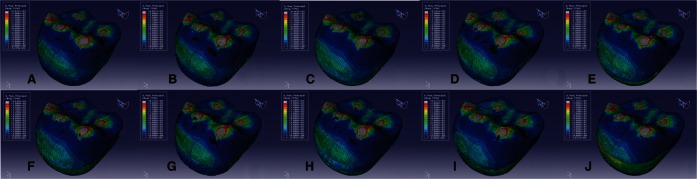 | Fig. 4Maximum principal stress distributions of 10 models subjected to maximum bite force. Maximum principal stress concentrated in the areas around loading points on the crown surface. A: Model 1, B: Model 2, C: Model 3, D: Model 4, E: Model 5, F: Model 6, G: Model 7, H: Model 8, I: Model 9 and J: Model 10.
|
The MPS distributions within ten models subjected to masticatory force at three directions are presented in Fig. 6 and 7. It was observed that the MPS on the buccal and lingual shoulder was high in the models those had 3 mm height shoulder and slightly high in the models those had 2 mm height shoulder, when the load was applied to vertical direction. When the load was applied to angularly, the MPS on the buccal margin was high regardless of existence of buccal shoulder, and that on the lingual margin was high in the models those had buccal shoulder. Angular loading resulted in a general increase of MPS compared to vertical loading in lingual shoulder. The supportive effect of lingual shoulder increased as the load direction changed from vertical to angularly. When the load was applied to horizontal direction, the MPS concentrated on the buccal cervical veneer in models without shoulder. No significant changes in stress area were observed at lingual shoulder except for 3 mm height shoulder.
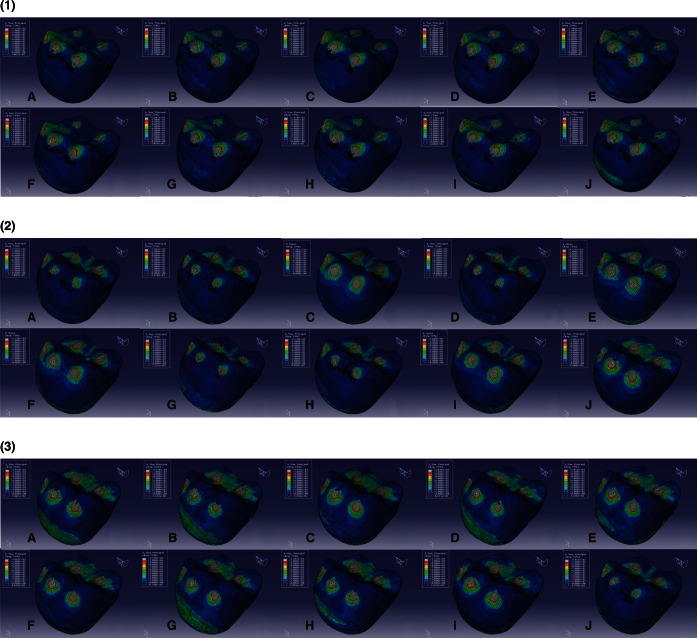 | Fig. 6Maximum principal stress distributions of 10 models subjected to masticatory force (under the application of loads from three directions). (1) load of 280 N at 0° to the to oth axis (vertical direction), (2) load of 280 N at 45° to the tooth axis, towards the lingual margin, and (3) load of 280 N at 90° to the tooth axis, towards the lingual surface (horizontal direction). A: Model 1, B: Model 2, C: Model 3, D: Model 4, E: Model 5, F: Model 6, G: Model 7, H: Model 8, I: Model 9 and J: Model 10.
|
 | Fig. 7Lingual side view of maximum principal stress distributions of 10 models subjected to masticatory force. (1) load of 280 N at 0° to the tooth axis (vertical direction), (2) load of 280 N at 45° to the tooth axis, towards the lingual margin, and (3) load of 280 N at 90° to the tooth axis, towards the lingual surface (horizontal direction). A: Model 1, B: Model 2, C: Model 3, B: Model 4, E: Model 5, F: Model 6, G: Model 7, H: Model 8, I: Model 9 and J: Model 10.
|
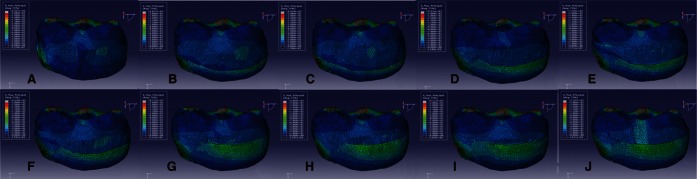
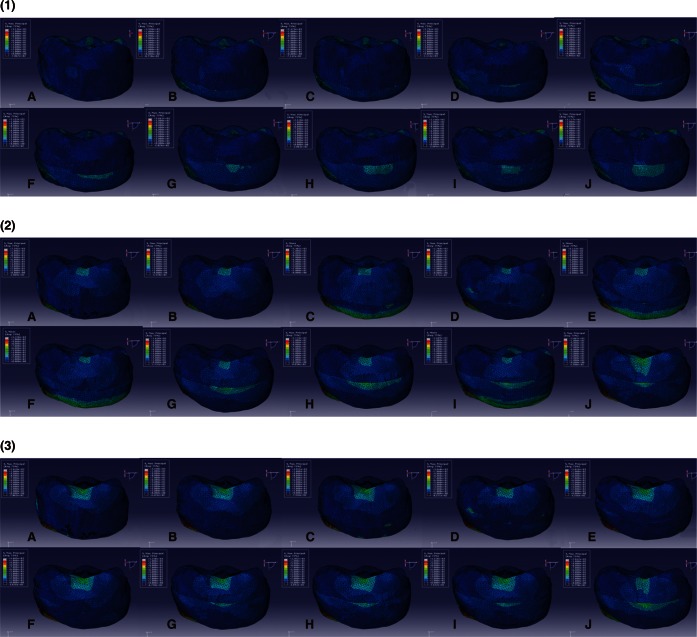
Fig. 8 shows the lingual side view of minimum principal stress distributions within the ten models under maximum bite force. The minimum principal stress distributions within ten models subjected to masticatory force at three directions are presented in Fig. 9. Overall, the compressive stress levels within the ceramic core were located in 2 different regions as a function of shoulder height and position on the core. These locations were cusp region around loading points and shoulder region, as the all shoulder height increased up to 3 mm from the margin. Also, it was observed that the tensile stress areas around loading points on the surface of veneer decreased as the all shoulder height increased from 0 to 3 mm. Under maximum bite force simulations, the highest compressive stresses were located at the occlusal region around loading points on the veneer surface. Tensile stresses also concentrated in the areas around the loading points on the crown surface. However, no particular concentration of tensile stresses was observed on the shoulder region. Compressive stresses were high in the cervical shoulder region of the ceramic core. As the height of shoulder increased, compressive stresses increased in the shoulder region, and tensile stresses decreased around loading points. This phenomenon was dramatic in Model 10. No significant changes in stress area were observed at buccal cusp area, as the height of lingual shoulder increased without buccal shoulder. In the shoulder region, the stresses were high in the top of shoulder and gradually decreased from top to the margin. Under masticatory force simulations, the compressive stresses were located at the loading points and shoulder region. Angular loading resulted in a general increase of compressive stresses at the shoulder region as the height of the lingual shoulder increased up to 3 mm from 2 mm. The supportive effect of lingual shoulder was small in the models those had 1 mm height lingual shoulder, and those had 2 mm height lingual shoulder without buccal shoulder. Horizontal loading showed the supportive effect of lingual shoulder in the models those had 3 mm height lingual shoulder regardless of buccal shoulder.
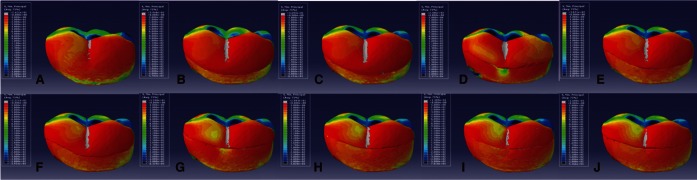 | Fig. 8Lingual side view of minimum principal stress distributions in the 10 models subjected to maximum bite force. A: Model 1, B: Model 2, C: Model 3, D: Model 4, E: Model 5, F: Model 6, G: Model 7, H: Model 8, I: Model 9 and J: Model 10.
|
 | Fig. 9Lingual side view of minimum principal stress distributions of 10 models subjected to masticatory force (under the application of loads from three directions). (1) load of 28 0 N at 0° to the tooth axis (vertical direction), (2) load of 280 N at 45° to the tooth axis, towards the lingual margin, and (3) load of 280 N at 90° to the tooth axis, towards the lingual surface (horizontal direction). A: Model 1, B: Model 2, C: Model 3, D: Model 4, E: Model 5, F: Model 6, G: Model 7, H: Model 8, I: Model 9 and J: Model 10.
|
Go to :
DISCUSSION
Conventional precious or non-precious metal crowns may exhibit acceptable longevity without fracture due to excellent mechanical properties. However, the demand for esthetically pleasing and biocompatible posterior restorations and the increase in the cost of precious metal, has led to the development of metal-free all-ceramic restorations and to escalate use of these restorations in replacement of damaged teeth. Veneer porcelain on the zirconia crown, especially when it is used in replacement of posterior tooth, is easily subject to fracture as a result of their natural brittleness and inherent stresses, generated by the laboratory procedures. The mechanical testing of the effects of core designs on fracture strength of veneer porcelain usually encounters obstacles associated with time-consuming specimen fabrication and potential increase in cost. In addition, there is only one chance to examine mechanical behavior of specimens before they are fractured, so investigations of larger numbers of combinations between specimen configurations and loading conditions are not practical. Mechanical simulation of restorations can be a powerful tool for researchers attempting to develop study designs. Interestingly, it is possible to simulate a lot of test combination without limit, since FEA allows the alteration of many variables, such as material and geometric configurations, by virtue of CAD and mechanical modeling software. For this reason, FEA is widely used in investigating the mechanical behavior of biomedical complex structures and the critical aspects related to stress distribution in that structures under various loads or geometric conditions. In the last three decades 2D FEA was often used in the stress distribution analysis because of its advantage of reducing working time, meshing and computing time. However, oral tissue is unlikely to the commercial products of relatively uniform and orderly configuration. A more detailed 3D FEA has come into wide use because of considerable advantage in the analyses of the complex and irregular morphology. Dental applications of FEA are already known in crowns and fixed partial dentures.2,18-22,25
There are studies evaluating the relative contribution of crown configuration, proximal wall height reduction, materials, core thickness, cement modulus, cement thickness, anatomic variables, load position, and a combination of variables on all-ceramic crown maximum principal stress levels by factorial analyses.20,25
Imanishi et al.2 examined the stress distribution within two types of single layer all-ceramic crowns (Dicor and Empress) and two types of double layer all-ceramic crowns (In-Ceram and Empress2) under various loading conditions by 3D FEA. They reported that the maximum tensile stresses concentrated around the loading points. In addition, this study showed that when the load was applied horizontally, the maximum tensile stress in single layer crown was observed around the loading points on the surface, and at the cervical area of the core in the double layer crowns. According to this study, the rationale of reinforcing allceramic crown with high-strength ceramic cores is supported, and bite forces applied from the horizontal direction are a critical factor for the integrity of posterior all-ceramic crowns.
Silva et al.26 evaluated the reliability of all-ceramic coreveneer system crown by modification of the core design in laboratory experiment with the 1.5 mm thickness veneer porcelain. They reported that modified (2.5 mm height lingual and proximal cervical areas) core designs showed significantly higher reliability than standard (0.5 mm uniform thickness) core design for molars. In addition, the result show that the fatigue fracture modes of standard core design were veneer chipping not exposing the core, but exposing the veneer core interface for the modified group.
These studies, however, would not provide information on fracture resistance with variation in shoulder position and height. Moreover, the literature concerning the influence of shoulder height and position on system biomechanics is rare. We focused our interest on the examination of the stress distribution in posterior zirconia crown, where subjected heavy occlusal loading, as a function of various core designs. Methods for geometric data acquisition, solid model creation and finite element model generation are presented and discussed. Many factors, such as the element type, meshing quality, and boundary condition of the finite element models critically affect the reliability and validity of the FEA. In order to minimize these effects, preliminary tests such as the convergence test were conducted in this study.
Masticatory force is usually reported to range from 37%27 to 40%28 of the maximum bite force of approximately 700 N.23,24 On the basis of this study, a load of 280 N, which is 40% of the maximum biting force of 700 N, was applied from three directions. Loading position plays a significant role in stress concentrations in complex structures such as full crown restorations. Magne and Belser29 conducted a 2D FEA evaluating the stress distribution in maxillary and mandibular molar teeth during function : working, non-working, and vertical closure of the jaw. Their study showed that high stresses were found on the lingual surface of the mandibular molar tooth during working movement and in the central groove of the maxillary molar tooth during balancing contact. Therefore, buccal inclination of lingual cusp was included in loading points simulating masticatory force in this study.
This study was designed to investigate the correlation between shoulder over the core and stress distribution within crown. Based upon our FEA results from both simulating maximum bite force and masticatory force on the veneer, high MPS levels were observed in 2 regions of the zirconia core. As expected, one region of high stress developed in the core was in the occlusal surface beneath the loading area (Fig. 4 and 5). A second region was in close proximity to the shoulder (Fig. 6 and 7).
When a vertical load was applied to veneer, the tensile stresses concentrated around the loading points of veneer surfaces. When the load was applied at 45° to the tooth axis, the resultant tensile stress was less than when it was applied vertically. When the load was applied horizontally, the tensile stress produced on the veneer surface was greater than when it was applied vertically. Morikawa30 reported that the masticatory force on the mandibular first molar is applied at 20-28° to the tooth axis, in healthy people. The resultant maximum tensile stress is substantially less than the tensile strength of veneer porcelain used, and thus the likelihood of veneer fractures would seem to be small. However, the large tensile stress fields observed in crowns may be further increased if stress-raising features such as flaws and inclusions are present in the material.
The entire stress level was almost same for the ten models but there was higher stress at the veneer-shoulder interface, in a zone where the veneer porcelain exhibited compressive stress rather than tensile stress. Findings indicated that more shoulder support lead to lower tensile stress in veneer porcelain under occlusal loading. In fact, shoulder-reinforced zirconia crown can reduce the possibility of veneer fracture by means of supporting the veneer porcelain. This effect is also shown in Fig. 6 where the compressive stress is dominant in shoulder area. The less supporting shoulder exhibits a greater tensile stress in the veneer that is likely fractured.
A good zirconia restoration has to balance the two opposite effects: esthetics and longevity. Exposure of posterior teeth during mastication, speech, and smile varies with different muscle activity and skeletal relationship of patient. In addition, shade of zirconia mimics natural tooth, cervical shoulder exposure makes no serious esthetic problems. In this way shoulder support on the core of veneered zirconia crown can be accepted in order to reach sufficient fracture resistance.
These preliminary considerations, however, do not take into account clinical situation. Obviously, the ideal occlusion is not always possible with variations in jaw relation and dentition of patient. Direction of occlusal loading depends also on the anatomy of occlusal surfaces during function. But this effect was not directly taken into account in this study. Simply, the direction of load input in simulations was significantly reduced compared to the oral cavity during dynamic occlusion.
Go to :
CONCLUSION
Within the limitation of this study, it was found that the support of veneer porcelain is important to the integrity of posterior zirconia crowns and that shoulder support is a critical factor. Increasing the height of shoulder acted as a stress absorber at regions near the crown margins, suggesting this area may be critical point to support of veneer porcelain during function.
Go to :
 XML Download