

 PDF
PDF ePub
ePub Citation
 Print
Print


INTRODUCTION
The stresses on the mandible and the maxilla caused by mastication are known to generate fatigue in the masticatory muscles and teeth, and even to provide mechanical stimulus to the skull base. To simulate of mastication and predict mechanical behaviors of mandible and the maxilla, finite element (FE) modeling technique has been developed.
Analytical studies have been performed to predict mechanical behaviors such as stress and strain distributions generated in the alveolar bone and the muscles that surround teeth, mainly for evaluation of applicability of implants.1-7 Therefore, most studies have presented finite element analysis with a single tooth model or a part of a molar and the alveolar bone model. Furthermore, Ban et al.8 and Lee et al.9 performed finite element analysis using a model with simplified shape of the mandible without teeth to determine stress distribution generated when inserting a prosthesis. In addition, Himmlova et al.10 determined stress distribution of the mandible through a simulation under static loads of 114.6 N, 17.1 N, and 23.4 N in an axial, a anterio-superior, and a anterio-posterior direction, respectively. Mechanical material properties of teeth and mandible required for finite element analysis can be found in Satis et al.11 From the study, it is observed that material behaviors are relatively linear for teeth and mandible, and elastic modulus is consistent under tensile and compressive zone. Furthermore, while it was shown that compressive strength of the teeth was approximately two times higher than compressive strength of the mandible, tensile strength of the mandible was 10% higher than tensile strength of teeth. Both teeth and mandible have higher compressive strength than tensile strength and the Poisson's ratio is similar for both of these structures (approximately 0.3). Considering that tooth is combined material of dentine and enamel, compressive strength of enamel is approximately 20% higher than the compressive strength of dentin. In addition, elasticity modulus of enamel is shown to be approximately five times higher than that of dentin, which indicates that enamel is more brittle. However, tensile and shear strengths have been found to be much lower in enamel than in dentin.11
Relatively few experimental studies have been published to study mechanical behaviors of mandible or teeth. Karl et al.12 tried to determine in vivo movements by observing changes in strains on an implant over time when applying implants to actual patients. Furthermore, some studies have assessed to find out stress distribution on implants after attachment to a fixture.13,14
Few analytical or experimental studies have been performed to find stress distribution or stress propagation on entire mandible including the teeth during mastication. Most of the studies have been performed by modeling a single tooth or a part of the mandible simplified the shapes or the materials, thereby resulting in a limited ability to determine accurate mechanical behaviors such as stress distributions and propagations. However, complex shape of the maxilla necessitates an extended period for modeling and computational time. Therefore, it is required to find out simulation technique that is accurate as well as efficient in terms of computational time.
In this study, an efficient analysis technique for predicting stress distribution that occurs during mastication is proposed. Toward that goal, actual shape of mandible and teeth without maxilla are modeled using computed tomography (CT) images. From the analysis, mechanical behaviors are analyzed according to various restraint conditions and load conditions. In addition, the proposed modeling technique is validated with experimental data.
MATERIALS AND METHODS
The subject of this study was a normal adult skull without malformation in which the maxilla and the mandible were in normal occlusion. A skull without a metal prosthesis was selected in order to obtain clearer CT images.
3-dimensional (3D) modeling of the CT images
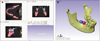
To generate 3D model, 500 dicom files of skull obtained by CT (Computed Tomography, SOMATOMTM SENSATION, Siemens AG, Germery, 120kVp, 200 ms, 0.5 mm thickness) were constructed to a 3D model by using commercial software, Scan IP (Simpleware Ltd, exeter, United Kingdom) as illustrated in Fig. 1. After removing maxilla from the skull, finite elements were generated through an editing process that removes the noises. In order to reduce unnecessary computational time, microscopic protrusions and holes were removed during the CT image editing process. However, holes in jaw and left and right wisdom teeth that are buried in the periodontal ligament were remained in the model. Furthermore, the effect of periodontal muscle was included in the model by adding friction formulations at contact area between the periodontal muscle and mandible without generating 3D models for periodontal muscle. The muscles related to mastication are included in FE model in forms of loading and restraint conditions instead of being generated as 3D elements.
Finite element modeling
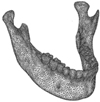
This section describes the process of generating finite element model. For both the teeth and the mandible, 4-node tetrahedral elements are used and total 150,000 finite elements are generated as seen in Fig. 2. The 4-node tetrahedral element has a degree of freedom in a anterio-superior, axial, and anterio-posterior direction at each node, and the stress and strain at each direction are calculated at a single integration point per element.15 In the generated finite element model, linear material properties and interfacial properties between the teeth and the mandible are included. As variables, different loading and restraint conditions are prescribed in the FE models. Non-linear geometrical analyses are performed using commercial software, ABAQUS version 6.10-3 (Dassault Systèmes, Vélizy-Villacoublay, France), for finite element analysis.
Material properties
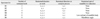
For material properties of teeth and mandible, elastic modulus and Poisson's ratio are provided from previously reported data11 as shown in Table 1. Linear and homogeneous material behaviors are assumed for teeth and mandible model, since the study focuses on macroscopic mechanical behaviors. Contact formulation is included between teeth and mandible to take account of periodontal muscle with friction coefficient of 0.2, referred to Wierszycki et al.16
Restraint conditions
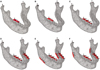
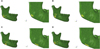
In this study, condylar process area with top surfaces of molar and premolar were restrained in order to simulate behaviors of occlusion without modeling complex maxilla. Regarding the restraint conditions, the number of molar and premolar and the restraint directions of condylar process and molars (or premolars) were chosen as variables, and differences in mechanical behaviors according to various restraint conditions were compared. The variables are listed in Table 2 and the FE models with various restraint conditions are shown in Fig. 3. The teeth that are red in this figure indicate the restraint area and the direction of the arrow indicates the restraint direction.
Loading conditions
The location and direction of load prescription were determined according to masseter muscle, which is often used during occlusion. Therefore, the load is applied at the location where masseter muscle is attached to mandible, and direction of the load is based on direction of the muscle obtained by anatomical chart.17 Therefore, total load of 300 N was applied statically in the direction of masseter muscle. However, there was a discrepancy between direction of masseter muscle from the anatomical chart17 and the direction analyzed from CT images. Also, it was necessary to find out effect of loading directions on mechanical behaviors of teeth and mandible during mastication. Therefore, additional variables such as loaded areas and directions of load were applied to the FE models with selective restraint conditions. The details of the variables are described in Table 3 and the corresponding FE models with loaded areas and direction of load are illustrated in Fig. 4.
Stress and strain measurements
From the FE analyses, strains on teeth in the axial direction were obtained. Because axial direction is the main direction during mastication, this study focused on strains in axial direction only. Also, von Mises stress contour of mandible was observed from the FE analyses. The von Mises stress, which is called the "effective stress", has been widely used to determine maximum stress value regardless of the stress direction and the yield characteristics of materials. This value is calculated using Eq. (1) below.
Validation
In order to validate the proposed FE modeling technique in the study, strains on teeth obtained from experiments were compared with analytical results. For the experiments, CT images of adult male skull with normal skeleton and occlusion were used to fabricate epoxy (TSR-821, CMET Inc., Japan) based replica skull. The replica skull was then fixed in Instron material test machine as shown in Fig. 5 and mandible was pulled with 300 N in direction of masseter muscle to simulate mastication movement. Several studies reported methods to quantify mechanical behaviors of teeth under occlusion18,19 and attaching strain gages on teeth allowed quantified measures of mechanical behaviors. Therefore, in the study, applied load was measured through a load cell mounted in the Instron material test machine and strain distributions were measured through strain gauges attached on surfaces of the teeth.
RESULTS
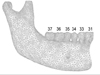
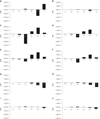
In this section, analytical studies of strain distributions of molars and premolars are presented according to the various loading and restraint conditions. The teeth was labeled with numbers as shown in Fig. 6 and strain distributions on teeth according to the variables can be found from Figs. 7A to J.
Strain distributions according to various restraint directions of condylar process and teeth
The effect of restraint directions on strain distributions of the teeth can be found from Figs. 7A and B. From Fig. 7A, it is observed that tooth 37 shows positive strain value. The reason of positive strain value on tooth 37 is because torsional force occurs in mandible due to the prescribed restraint condition resulting elongation of tooth 37 in anterio-superior direction. In L1B2 model, teeth are allowed to move in anterio-posterior direction and condylar process is restrained in all directions to see the effect of different restraint condition. Although strain on tooth 37 is negative value as a result of reduced torsion in mandible in L1B2 model, the results are not still acceptable because strain magnitudes on the teeth are too small and strain differences between the teeth are minimal as shown in Fig. 7B. In the other FE models of L2B5 and L2B6, posterior or lower parts of the mandible are restrained in anterio-superior direction to prevent torsion in the mandible and to include effect of medial pterygoid muscle. The analytical results from L2B5 and L2B6 models are shown in Figs. 7I and J. Restraining the posterior part of the mandible (L2B5 model) results no significant differences compared to results of L2B6 model, in which the lower part of the mandible are restrained, except that the lower strain on tooth number 36 is observed.
Strain distributions according to various loading conditions
In order to investigate effect of loading conditions on strain distributions, analytical results from L1B3, L2B3, L3B3, and L4B3 models are presented from Figs. 7C to F. In the cases of model L1B3, L2B3, L3B3, and L4B3, tensile strain values are obtained on molar teeth, while compressive strains are expected on the molar teeth. In order to reduce torsion that causes elongation of the molar teeth, the number of restraint teeth is doubled. The increased number of restraint teeth indicates that the number of teeth used for chewing food is increased and shows significant influence on strain distributions on teeth. The models with the increased number of restraint teeth are L1B4 and L2B4. The analytical results from L1B4 and L2B4 are illustrated in Figs. 7G and H, respectively. These results show compressive strains on molar teeth. As shown in Fig. 7G, L2B4 shows larger compressive strains on teeth 35, 36, and 37 compared to L1B4. Also, slightly larger tensile strain is obtained on tooth 34 from L2B4 model compared to L1B4 model.
Strain distributions according to number of restraint teeth
There are cases where 1) two molar teeth on one side of mandible are in contact with food during mastication (L1B2), 2) molar and premolar teeth on one side of mandible are in contact with food during mastication (L1B3), and 3) both left and right molars and premolars are in contact with food during mastication (L1B4). Analytical studies from L1B2, L1B3, and L1B4 models are presented in Figs. 7B, C, and G respectively. The largest strain distributions are obtained when eight teeth on both left and right sides are restrained as shown in Fig. 7G, while strains predicted from L1B2 model are minimal in Fig. 7B. In particular, closer to posterior part of mandible, larger strains are obtained on molar teeth in L1B4 model. However, when four teeth were restrained, tensile strains are obtained on molar teeth as shown in Fig. 7C, thus L1B3 model cannot be used as proper modeling method.
DISCUSSION
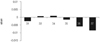
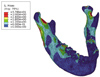
The FE model was validated based on tendencies of strain distributions between the teeth rather than strain magnitudes because it was not possible to perform direction comparison between the experiment and the analysis due to discrepancy of configuration and materials between the skull model used in the experiment and the FE model used in the analyses. From the experiments, it was observed that teeth 31, 35, 36, and 37 showed compressive strains, while teeth 33 and 34 showed tensile strains as seen in Fig. 8. Also, magnitudes of compressive strains were larger than tensile strains on teeth 33 and 34, and the largest compressive strain occurred in tooth number 37. The strain distributions of mandibular teeth obtained from the experiments showed similar tendencies as the FE models L1B2, L1B4, L2B4, L2B5, and L2B6. In addition, the models with loading condition of L2 showed more similar results of strain distributions with the experimental results than the model with loading condition of L1. Between the models L2B5 and L2B6, there were no significant differences of strain distributions in terms of tendencies between the teeth. However, in terms of magnitudes, L2B6 model showed slightly closer values to the experimental results than L2B5 model. Therefore, L2B6 model could be used as the most optimized FE modeling technique to evaluate mechanical behaviors of mandible and mandibular teeth under mastication. In other words, when mandible under mastication is simulated, all molar and premolar teeth are restrained and the load is applied in a direction of masseter muscle according to the anatomy chart.17 In addition, condylar process is restrained in all directions except for anterio-posterior direction and mandibular posterior area is restrained in anterio-superior direction to prevent torsion of mandible during mastication. From the analysis of L2B6 model, not only strain distributions can be predicted, but 3D Von Mises stress contour is obtained as shown in Fig. 9. From the 3D Von Mises stress contour, it is observed that tooth 37, mandibular posterior area, and mandibular notch are under relatively high stresses during mastication.
CONCLUSION
In the study, it is shown that the proposed FE model is able to predict mechanical behaviors of mandible and mandibular teeth during mastication with high accuracy without suffering from long period of computation time due to complex maxillary structure. In addition, the proposed FE model can be used to evaluate structural and mechanical behaviors of mandible and mandibular teeth with prosthesis and to determine durability of prosthesis.


 XML Download