

 PDF
PDF ePub
ePub Citation
 Print
Print


INTRODUCTION
Accurate and precise replicas of the teeth are essential for producing prosthetic restorations with accurate internal and marginal adaptation. A three-dimensional (3D) digital model forms the basis for designing prostheses suitable for patients. It is self-evident that the accuracy and reproducibility of 3D digital models are critical, which otherwise may affect the longevity of the prostheses due to their poor fit.12
Digitalization of model surface can be done in contact or non-contact manners. Contact digitalization applies a predetermined force on the sample surface to record the morphological characteristics, but this can cause wear at the sample surface3 and is now rarely used. In contrast to this, non-contact digitalization does not require contact to the sample surface, and thus can overcome the drawback of wearing or deforming sample surfaces, etc. Contact or optical profilometers can be used to profile the surfaces of teeth or materials, in which the sequential profiles form a digitalized cloud of points that represent the surface topography. However, optical profilometers cannot directly scan teeth in vivo, so scans are made of casts obtained from impressions45 in gypsum6 or epoxy resin.78 Most noncontact digitizers use either lasers or structured white light. Its optical system can detect the laser spot on a charge coupled device (CCD) camera using a triangulation principle, which is based on the laser sensor measurement, or complying with confocal principle to use white light or laser sensor to record the surface topography.9 Some studies1011 found that the laser profilometer emits light at specific wavelengths that may be absorbed or reflected by the object in dissimilar ways, which are due to the color of the surface materials. If the material absorbs the same wavelength of light as that emitted by the laser, then it is considered that the object cannot be digitalized.101112 Thus, the color of the surface might serve as an important factor influencing the digitized results of tooth preparations.
In 2001, DeLong et al.10 adopted the early Comet 100 white light digitizer to study the digitizing performance of vinyl polysiloxane materials, and found that although the digitizing performance of the impression materials was highly variable, it was not subject to influence of the color. In 2009, Rodriguez et al.13 utilized the methodology described by DeLong et al. to study the surface roughness of differently colored gypsum materials using non-contacting laser profilometry and speculated that digitization of dental materials was affected by color. In 2015, Kim et al.14 used laser scanner (Lava Scanner) to assess the influence of various gypsum materials on the precision of fit of CAD/CAM-fabricated zirconia copings. This confirmed that the type of gypsum material used did not determine the precision of fit of a prosthesis. However, all these studies on the color of gypsum materials present deficiencies and shortcomings. First, the poorly consistent results and conclusions were obtained using the same type of scanners. Second, the adopted methodologies had certain limitations, such as adopting sample segmentation, indirect data acquisition, and selecting limited measurement points.14 Finally, some results were acquired using the early scanners and were unlikely to reflect the results obtained by the latest structural light 3-dimensional scanners, which are the high-precision scanners developed in recent years.15 As compared to the laser scanners, the structural light scanners are used to scan surfaces and are applicable to almost all objects, which can be characterized by undemanding environmental requirements, simple installation, and easy maintenance.
Compared to the previous methods of assessing suitability or accuracy, some investigators16 introduced a novel threedimensional procedure that may generate more clinically relevant information than the previously used approaches, without data loss due to specimen sectioning or other mode of loss. In addition, RGB-color space-based DS is also a method of imaging interpretation. Some researchers17 utilized RMSD three-dimensional analysis and DS semi-quantification method to study the influence of CNC-milling on the marginal and internal fit of dental ceramics. However, the effects of gypsum color on accuracy and reproducibility of digital tooth preparations using DS method have not yet been reported.
The aim of this study, therefore, was to investigate the accuracy and reproducibility of preparations made by gypsum materials of various colors that can be attributed to the digitalizing procedure. This was accomplished using a structured light scanner that allowed the non-destructive three-dimensional assessment of the surface of a prepared molar using quantitative and semi-quantitative 3D approach according to the data characteristics. The null hypothesis is that color of gypsum materials does not affect accuracy and reproducibility of digitalized optical scans.
Go to : 
MATERIALS AND METHODS
A maxillary left first molar prepared tooth was scanned using a structured-light scanner (Freedom HD, DOF Inc., Seoul, Korea), and the data that is produced in the STL format (Surface Tessellation Language, standard for CAD/CAM data exchange) were imported into the NX Imageware 13.2 software. A prepared tooth model was reconstructed, which featured a 5° convergent degree, chamfer shoulder, and a 4.5 mm height separately in the software. Subsequently, the data exported in the STL format were defined as the reference dataset (REF) for the prepared tooth.
Then, the REF was imported into a 5-axis milling combined machining equipment (408MT, Willemin-Macodel SA, Delémont, Switzerland): X, Y, Z positioning precision of 5 µm, X, Y, Z repeatability of 3 µm, roughness of 0.6 µm, and coaxiality of 4 µm. Titanium alloy bar (Baoji Titanium Industry Co., Ltd., Baoji, China) was selected to mill according to the manufacturer's instructions to obtain a defect-free metal prepared tooth.
The metal preparation was used to take impressions and fabricate gypsum preparations according to the following steps: in a vacuum mixer (AX-2000 C+, Tianjin Share Import and Export Co., Ltd., Tianjin, China), silicone rubber (accuracy of repetition 2 µm) (EliteDouble22, Zhermack, Spa, Italy) was mixed automatically for 30 seconds, according to the manufacturer's instructions, and then was injected into the metal prepared tooth mold. Ultimately, 48 defect-free impressions were obtained and were randomized into 6 groups (samples in each group were labeled from 1 to 8). Shape and size of the molds must insure that the impression and prepared tooth had a thickness of at least 3 mm (all impressions were made by the same laboratory assistant under the standard laboratory conditions (23℃)).17 All the impressions were placed for a duration that was 3 times longer than that recommended by the manufacturer to ensure adequate polymerization at room temperature.18 A headset magnifier (3.5×magnification, NO.9892B, Ying Tan AoXiang Photoelectric Instrument Co., Ltd., Jiangxi, China) was used to examine the presence of defects on the impressions, and those with absence of defects were placed for 2 hours to recover. Then the impressions were placed in alcoholic surfactant solution (Zhermack Tensilab., Zhermack Span, Badia Polesine, Italy) for 30 s until the excess liquid was naturally dried (this was applied to decrease the surface tension and improve perfusion quality of the impression).19 Subsequently, dental gypsum materials (HARD STONE THS-S, Tzu She Tang Gypsum Co., Ltd., Taipei, Taiwan) in white, yellow, pink, blue, green, and peach colors were separately mixed (AX-2000 Vacuum Mixer, Tianjin Share Import and Export Co., Ltd., Tianjin, China) for 30 seconds under vacuum condition according to the water powder ratio (distilled water 21 mL, gypsum power 100 g) as established by the manufacturer. They were then poured into the impressions by a constant frequency oscillator (AX-2000 Vacuum Mixer, Tianjin Share Import and Export Co., Ltd., Tianjin, China). 8 preparations in each group were made using gypsum material of the same color. The fabricated gypsum preparations were stored at room temperature (23℃) for 40 minutes and were stripped from impressions.
Then, the gypsum preparations with different colors were digitized using a self-calibrating structured light scanner (Smart (Big), Open Technologies Srl, Brescia, Italy) and obtained tooth prepared datasets (PRE). The instrument with 5-axis scanning system featured a measurement accuracy of the system < 5 µm, repeatability of 2 µm, and resolution of 5 µm, comparing the results with coordinate measuring industrial machines. Furthermore, there were no orientation restrictions of the object inside the scanner and its optic set-up provided good calibration stability in the course of time (manufacturer data).
Regarding accuracy, 8 preparations in each group were scanned according to their colors. During scanning, one prepared tooth in each group was randomly selected and scanned 5 times, and these repeated data were used to assess the reproducibility of each group. Finally, the clear and complete STL datasets as the output format were imported into the Quality 12 software (Geomagic GmbH, Stuttgart, Germany) for alignment. The schematic of the procedure is illustrated in Fig. 1.
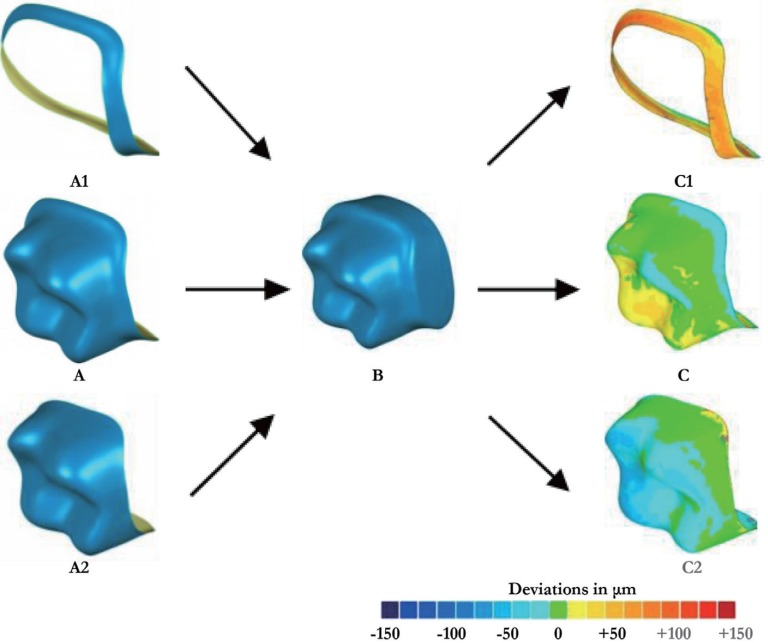 | Fig. 1Experimental procedure for marginal, internal and overall discrepancy analysis. The reference dataset (REF) for the prepared tooth (A) were divided into marginal (A1) and internal (A2) area, which were separately performed with a best-fit virtual alignment and with the tooth prepared dataset (PRE) obtained by gypsum materials of various colors (B). Ultimately, marginal (C1), internal (C2), and overall (C) color-coded difference images of the prepared tooth were obtained. The color-coded difference images had 19 colored segments, where green or blue shades indicated a negative deviation, while yellow and red indicated a positive deviation.
|
In terms of accuracy, 8 sets of PRE data and REF data (marginal, internal, and overall) in each group were subjected to pairwise best-fit alignment, in order to obtain RMSD values and color-coded difference images(marginal, internal, and overall). The RMSD values were used for three-dimensional quantitative analysis; the color-coded difference images with same number were conducted for paired comparison among the 6 colors groups and then used for DS semi-quantitative analysis.
Regarding reproducibility, 5 sets of PRE data in each group initially underwent intragroup pairwise best-fit alignment (the samples that were scanned forward were considered as reference, and 10 RMSD values were obtained in each group for three-dimensional quantitative analysis). Based on these, the color-coded difference images were acquired, and intragroup pairwise comparison was performed (reference was set using the aforementioned method, and 10 DS values were obtained in each group), followed by DS semi-quantitative analysis.
Results of each alignment were automatically shown with the output in root mean square deviations (RMSD) format for quantitative analyses, where the RMS is given by:
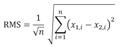
where x1 refers to the measurement point on the reference model i, x2 refers to the measurement point on the test model i, and n is the total number of measurement point pairs for each sample. The measurements were done in marginal, internal, and overall regions of prepared tooth (accuracy) or whole specimen (reproducibility). The variation amplitude was displayed by color-coded difference images.
DS semi-quantitative analysis of color-coded difference images of the 6 color groups was performed using MATLAB R2008a (MathWorks, Inc., Natick, MA, USA). Prior to the DS analysis, the color-coded difference images in the Quality 12 software were stored in .obj format, and then transformed into .txt format in Notepad++ editor. Finally, the RGB pixel-based program was utilized to calculate DS. Images were compared in the same color space, which contained red, green, and blue with each color having 28 (256) elements (elements interval, RGB).17 Two corresponding pixels were considered similar if their red, green, and blue distances were smaller than 25 elements of the RGB-color space (Fig. 2).
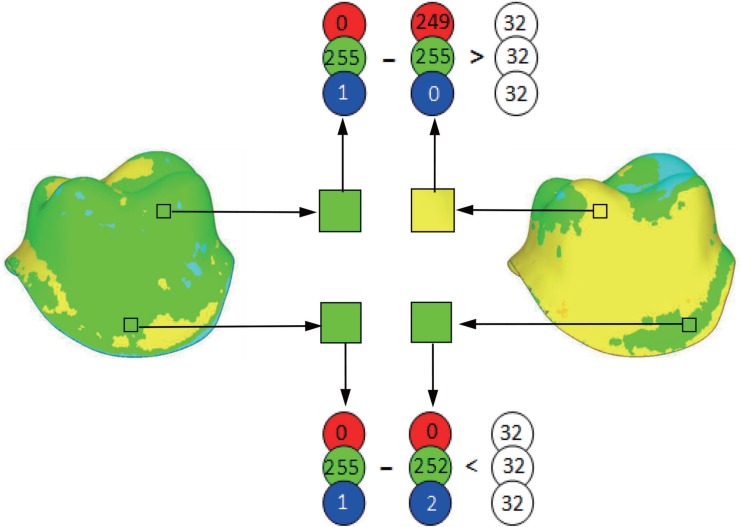 | Fig. 2Degree of similarity (DS) calculated for color-coded difference images. Corresponding pixels were considered similar when their red, green, and blue distances were < 32 (25) elements of the RGB-color-space. The number of similar pixels in relation to the total image size in pixels estimated the degree of similarity.
|
Statistical computations were made using IBM SPSS Statistics 20.0 software package (IBM SPSS Inc., Chicago, IL, USA). Means (RMSD, DS), standard deviation (SD) (RMSD, DS), and upper and lower 95% confidence intervals were used for expression of data. The Saphiro-Wilk's and Levene tests were adopted for normality and homogeneity of variance tests, respectively. The normality and the variance data were analyzed by ANOVA, and LSD was used to perform multiple comparisons if there were differences among the groups. Furthermore, if abnormality or heterogeneity of variance was shown, the independent sample of Kruskal-Wallis was used for comparison and multiple comparisons. Significant level was set as α = .05, which was adjusted when multiple comparisons were made.
Go to :
RESULTS
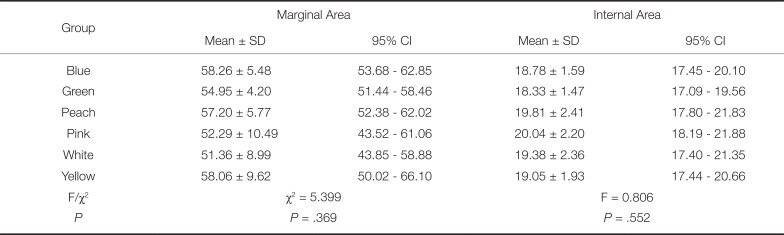
Discrepancies in internal and marginal regions of prepared teeth from 6 color groups were listed in Table 1. Regardless of marginal or internal regions, the deviations showed no statistically significant differences among these 6 color groups (P > .05). Meanwhile, the RMSD value in the marginal region was about 3 times that of in the internal region of the preparation (P = .000). These results were also verified by the deviation distribution results in Fig. 3.
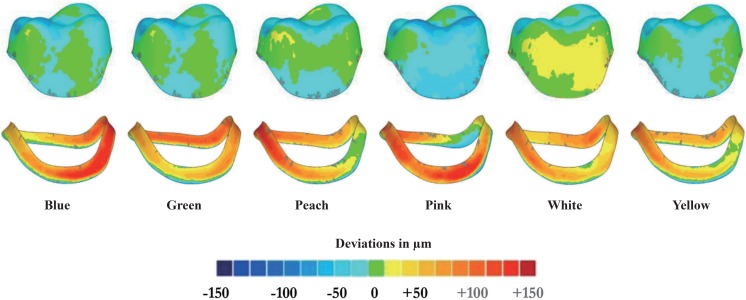 | Fig. 3Deviation analysis of color-coded difference images in internal (upper column) and marginal (lower column) surfaces of prepared tooth.
|
Table 1
Mean RMSD values (in µm) and 95% CIs for internal and marginal (n = 8 per group) area deviations of preparations with various colors
![]()
Deviations of the prepared teeth were presented as color-encoded segments. Sample images that contribute best to the authors' findings were selected for each color group.
Fig. 3 depicted color-coded difference images of marginal and internal prepared teeth from the 6 color groups, where a negative deviation (light blue to deep blue) represented a smaller value than PRE, while a positive deviation (yellow to red) represented a larger value than PRE. In internal region of the prepared tooth, color was not evenly distributed in each sample; the light blue area was most widely distributed (RMSD ranged from 0 µm to −50 µm), while deep blue was found in buccal cusps area. Green areas were close to the lingual edge as well as pit and fissure area (which were incompletely displayed due to the view angle). Meanwhile, light red was most widely distributed in the marginal area of the prepared tooth (RMSD ranged from 0 µm to +100 µm), but the whole marginal area was presented with an uneven deviation pattern accompanied by alternate regions with excessively large or small dramatic changes.
Table 2 listed the accuracy and reproducibility results in digitalizing prepared teeth from 6 color groups.
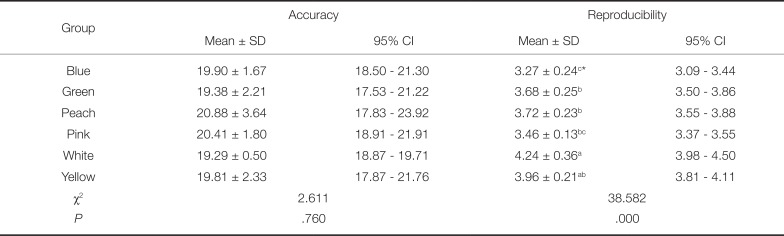
Table 2
Mean RMSD values (in µm) and 95% CIs for accuracy (n = 8 per group) and reproducibility (n = 10 per group) of preparations with various colors
![]()
Compared with the REF, PRE in each color groups were enlarged in 3D preparations (ranging from 19.38 to 20.88 µm) in terms of accuracy. The data did not show any significant differences among these 6 groups (P > .05). The RMSD values of the 6 color groups' reproducibility were less than 5 µm (ranging from 3.27 to 4.24 µm), but showed a statistically significant differences among these groups (P < .01).
The deviation of the white color group was largest (4.24 ± 0.36 µm), which showed significant differences compared with the blue, green, pink, and peach color groups (P < .05), but showed no significant differences compared with the yellow color group (P > .05). On the other hand, the deviation of the blue color group was the smallest (3.27 ± 0.24 µm), which showed statistically significant differences compared with white, yellow, peach, and green color groups (P < .05), but showed no significant difference when compared with the pink color group (P > .05)(Table 2).
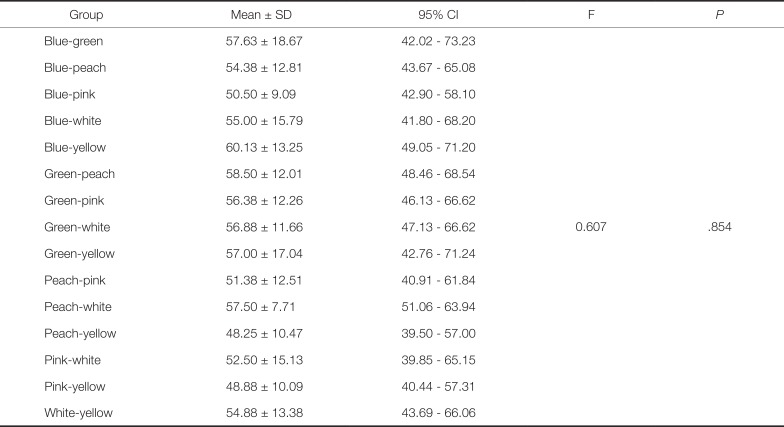
The prepared part of the specimen in terms of accuracy were digitized with 138,779 data points in RGB space, and found some differences among the color codes of the specimen with the same number from the 6 color groups (Fig. 4). The mean (± standard deviation) DS values and 95% CIs for accuracy from the 6 color groups were listed in Table 3. The result was verified by DS calculation, which showed insignificant differences among different colors groups (P > .05).
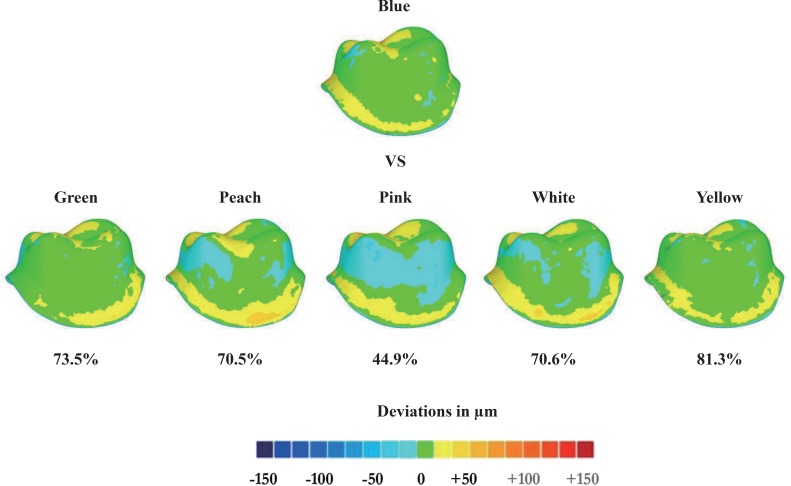 | Fig. 4Semi-quantitative deviation analyses for color variations between the blue color group and other color groups.
|
Table 3
Mean DS values (in %) and 95% CIs for accuracy (n = 8 per group) between 6 color groups with paired comparison
![]()
Images were color-encoded according to the RMSD range. The DS results were obtained by multiple comparisons between No. 1 of the blue color group (upper column) with No. 1 of the green, pink, peach, white, and yellow color groups (lower column), respectively. There were a total of 8 paired samples for each group.
Furthermore, 138,779 data points from the prepared part of per specimen in RGB space were obtained for assessing the reproducibility of 6 color groups. Table 4 listed the mean (± standard deviation) DS values and 95% CIs for reproducibility from 6 color groups. The results demonstrated a significant difference in reproducibility among the 6 color groups (P < .01). Of these, the DS value of the blue group was the highest (72.83 ± 7.14%), which showed significant differences compared with the green, peach, pink, white, and yellow color groups (P < .05). Other color groups showed no significant difference when compared with each other (P > .05).
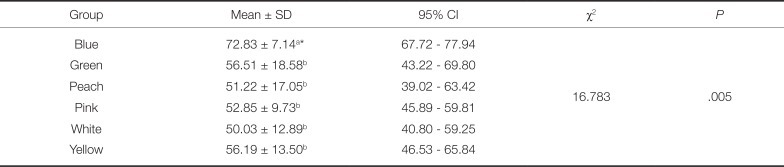
Table 4
Mean DS values (in %) and 95% CIs for reproducibility (n = 10 per group) between groups of preparations with various colors
![]()
Go to :
DISCUSSION
According to recent studies, it is possible to evaluate the spatial relationship between restoration and abutment interface without destroying samples.2021 Due to lack of reference objects, we constructed a reference dataset in this study and obtained the accuracy and reproducibility information in digitalizing prepared teeth by gypsum materials of 6 colors using a structured-light scanner. In this study, we found that the 3D volume of the gypsum preparations was likely to increase during the digitizing process. However, it was unlikely to be affected by the color. Also, the reproducibility of the digitizing scan of the gypsum preparations differed due to different colors, albeit only slightly (within 5 µm), especially when compared to typical fit discrepancies observed clinically. Therefore, the hypothesis was acceptable.
Compared with previous reports, a novel 3D analysis method was adopted in this study and evaluated the datasets captured from each specimen obtained by gypsum materials of various colors using superimposing method. In fact, this superimposing method can achieve the best-fit alignment with the reference dataset. The large number of spots per specimen was digitalized, where a large amount of ‘cloud’ of points or pixels were enabled to comprehensively and spatially analyze the experimental object at high precision.172022 For example, approximately 1,38,779 data points from each specimen were obtained in this study, which surpassed the number of 50–230 measuring points or 2–150 different measuring locations according to the previous suggestion.1819 In contrast, a new method was adopted in this study, which was unlikely to destroy samples and cause loss of relevant experimental information. Thus, the data obtained in this study were accurate and the results were reliable.
The RMSD values calculated using the analysis software could be positive or negative. With respect to the 3D order, a positive value indicated that the test sample was larger than the reference, while a negative value indicated the contrary phenomenon. The result revealed that PREs obtained by gypsum materials of different colors were increased in 3D directions, and therefore indicated a clinically significance for successful prosthesis allocation. The results showed that the mean variation at margin of prepared tooth was 51.36 – 58.26 µm and the internal deviations among the groups with different colors ranged between 19.38 and 20.88 µm. However, in view of the fact that the experimental procedure was the only part of all the production process for actual restoration, these resultant data only reflected the degree of deviation between virtual reference object and prepared tooth test datasets in this study. Thus, the methodology of this study was different from many previous literatures,232425262728 which described the adaptation of prostheses was the gaps between the real restoration and the abutment tooth.
The quantitative analysis revealed that internal regions of PRE showed significantly better fit than marginal regions in each color group, which might be due to the geometrical morphology of titanium cast preparation by computer numerical control (CNC)-milling equipment. Some scholars2930 believed that the marginal region and internal intersections were located at areas with strong curvature, such as the preparation finish line that omit sharp line angles, were proposed. Therefore, machining these areas requires the radius of the milling tool itself to be smaller than the radius to be milled. Otherwise, the milling procedure may introduce an error that can lead to oversized restorations.17 In addition, the marginal regions displayed uneven deviations that were accompanied by alternate areas of dramatic changes, which were either excessively large or excessively small. This might be due to the occurrence of a lower density at the scanning points in the marginal regions, and thus resulted in inaccuracy. Finally, inaccurate marginal line, such as high points or continuous low regions, may also affect the best-fit alignment.
DS results revealed that gypsum materials with different colors were unlikely to affect the accuracy but had very small influence on the reproducibility of PRE, which was consistent with the results of RMSD three-dimensional analysis. In fact, DS analysis only derived the semi-quantitative results so that the reliability of DS-scores analysis was not as good as that of the RMSD three-dimensional analysis results. DS of 100% meant that duplications had the same accuracy in digitalizing various colors of gypsum materials, while a DS of 0% meant that the digitalizing process thoroughly changed the situation designed by reference data and observed no equivalence between different groups. Although such a change is not necessarily referred to larger difference among the digitalized preparations and poor adaption was out of clinical acceptation, the risk of misfit still is very high. Therefore, we should be cautious to apply the PRE datasets with low DS-scores before further processes for restoring the design.
In a strictly controlled laboratory environment, replica models are normally made using impression materials because these materials are very accurate and stable.31 Some scholars32 believed that the accuracy in gypsum model casting could be improved to 11 µm and the duplication accuracy of silicone rubber could be up to 2 µm in this study according to manufacturer's instruction. However, each phase of the multi-step digitalizing workflows still may strengthen or weaken the accuracy of the final restoration. There are several limitations to this study. First, only one titanium preparation model was casted, which might adversely affect the overall accuracy of the experiment. In addition, although a digitalizing scanner with a repeatability up to 2 µm was selected in our study and the system-related variations incurred by the software during digital capturing was < 10−5 µm,1633 other scanning systems with higher accuracy and precision still need to be evaluated carefully. Finally, the in vitro experimental conditions may differ significantly from oral cavity, which lead to difference in impression duplication and clinical tray impression taking.3435
In the 3D analysis procedure, the color-coded different images changed with the variation in the number of colored segments. However, the regulatory significance of this modification to the three-dimensional analysis and similarity comparison is yet unclear. Therefore, the influence of colored segments on the three-dimensional analysis is subject to further studies.
Go to :
CONCLUSION
Within the limitations of this laboratory study, it can be concluded that the PREs of gypsum materials with different colors are disposed to increase in three dimensions, and the deviations of internal regions of PRE were significantly larger than those of marginal regions. The accuracy of PREs is not affected by the gypsum color and the differences in reproducibility are negligibly small (within 5 µm) in each color group, especially when compared to typical discrepancies observed clinically.
Go to :
 XML Download