

 PDF
PDF ePub
ePub Citation
 Print
Print


Coenzyme Q10 (CoQ10) is known to be responsible for the generation of ATP via the oxidative phosphorylation by transferring electrons of the respiratory chain, which exists in the mitochondrial membrane of organisms [1]. It is also revealed as a redox-active, antioxidant lipoprotein compound that is found in the phospholipid bilayer of cell membranes of tissues [2]. The biosynthesis of CoQ10 takes place in the mitochondria of the liver, heart, kidneys and muscles, where they require a greater amount of energy for their multiple biological functions [3]. Because of its essential function in cellular tissues, CoQ10 deficiency is a common disorder in certain pathological conditions due to the process of cellular aging [4]. The beneficial effects of dietary CoQ10 on clinical applications have been reported to ameliorate cardiovascular disease such as congestive heart failure, cardiomyopathy and mitochondrial disorder in humans [345]. Thus, it has been demonstrated that the supplementation with CoQ10 effectively ameliorates degenerative disease via enhancing antioxidant properties in the elderly and patients [35].
The free radical scavenging properties of CoQ10 have been known to serve as a crucial antioxidant activity to prevent lipid and membrane oxidation against pro-oxidative damage in tissues [78]. Hence, dietary supplementation with CoQ10 has an effective tool of scavenging reactive oxygen species (ROS) due to its ability to quench singlet oxygen and peroxy radicals [9]. According to the reports of several literatures [1011], the antioxidant capacity of CoQ10 was much higher than vitamin C or vitamin E in human studies.
On the contrary, it has been reported that an intracellular deficiency of CoQ10 can only happen under aging and certain pathological conditions, although the major biological function of CoQ10 is directly associated with antioxidant properties under normal metabolic processes [12]. Thus, some studies reported that biological functions in response to dietary supplementation with CoQ10 were only effective under abnormal physiological status, since an endogenous level of CoQ10 was sufficient for maintaining metabolic process under normal conditions [3513]. By way of example, it was reported that hepatic damage caused by endotoxin was ameliorated by supplementation with CoQ10 [14]. This result might be attributed to the high antioxidant efficacy of CoQ10 to protect cell integrity against ROS and lipid peroxidation induced by toxic agents [15]. However, the effectiveness of CoQ10 as a protective role against oxidative injury varies greatly according to the physiological status of animals, health and disease of animals, concentration and period of dietary CoQ10 supplementation, interaction with other nutrients, etc. [31116]. Thus, there is still a lack of evidence about whether the administration of CoQ10 to young animals during oxidative stress can affect the antioxidant system, despite the rather well-recognized antioxidant effects of CoQ10
in vitro.
In the above context, the aim of this study was designed to examine the effects of dietary CoQ10 on blood biochemical profiles, the mRNA expression and activity of antioxidant enzymes and antioxidant status in young rats exposed to early lipopolysaccharide-induced toxicity.
Materials and Methods
Experimental animals and procedures
Male Sprague Dawley (SD) rats aged 5-weeks were obtained from Samtako (Osan, Korea). After an acclimation of 2-weeks, all rats were kept in an environmentally controlled room (22±2℃) with a 12 h light/dark cycle. A total of twenty-four rats having a similar body weight were assigned to four treatments with free access to lab chow and sterilized water ad libitum. Rats in group 1 (CON) were orally administrated soybean oil daily basis with saline injection; rats in group 2 (LPS) were orally given soybean oil with the intraperitoneal (i.p.) injection of lipopolysaccharide (LPS, 1 mg/BW on day 0, 3 and 6); rats in group 3 (LCQI) and 4 (LCQII) were orally given 100 mg and 300 mg of CoQ10 (kg BW) dissolved into soybean oil daily basis, respectively with i.p. injection of LPS (1 mg/BW on day 0, 3 and 6). After that, body weight was measured on a weekly basis for a 4-week experimental period. A commercial CoQ10 was purchased from Inter Monglia Kingdomway Pharmaceutical Limited (CoQ10 99.3%, Xiamen, China). The CoQ10 supplement was dissolved in soybean oil carrier, and LPS (Sigma-Aldrich, St. Louis, MO, USA) was diluted in sterile saline. The animal experiment was approved by the Institutional Animal Care and Use Committee (IACUC) at the Gyeongnam National University of Science and Technology in Korea.
Tissue harvesting
At the end of 4-week treatment with CoQ10, all animals were deprived of diet for 12 h and then the rats (n=6) were sacrificed with ether. Immediately after opening the abdominal cavity, blood was collected in tubes coated with sodium heparin and organs was harvested and weighed. The plasma and liver tissues were then rapidly frozen in liquid nitrogen and stored at −70℃ until further assay.
Plasma biochemical composition analyses
Plasma aspartate aminotransferase (AST), alanine aminotransferase (ALT), blood urea nitrogen (BUN), glucose, and triglyceride were assayed using a clinical biochemical analyzer (Mindray, BS-120, Mindry Bio Medical Electronics co., Shnzhen, China). All analyses were conducted in duplicate.
mRNA expression of antioxidant enzymes by real time-PCR
The mRNA expression of antioxidant enzymes including superoxide dismutase (SOD), glutathione peroxidase (GPX) and catalase (CAT) was quantified by real-time PCR (Bio-rad, CA, USA). The cDNA primers used to amplify antioxidant genes are presented in Table 1. Total RNA of liver tissues was extracted using RNAzol TM B (Tel-Test Inc, TX, USA). In brief, 2 mL of RNAzol solution was added to 100 mg of hepatic tissues and then the tissues were homogenized using liquid nitrogen. After that, 100 µL of chloroform was added to an Eppendorf-tube and incubated for 5 min on ice. Next, the aqueous phase was separated by centrifugation (15 min at 15,000×g), after which the isolated RNA was precipitated with the same volume of isopropanol and then centrifuged (15 min at 15,000×g). The isolated total RNA was then washed with 75% ethyl alcohol, dried, and diluted with diethylpyrocarbonate (DEPC)-treated H2O, after which the optical density at 260 nm was applied to quantify the concentration of RNA (GeneQuant pro spectrophotometer, Amersham, Piscataway, NJ. USA). After that, 5 µg of total RNA were incubated with 1.0 mg of oligo dT (Invitrogen Co., Carlsbad, CA, USA) at 70℃ for 5 min and 4℃ for 5 min to produce the first strand cDNA. The reaction mixture was incubated at 42℃ for 50 min, 90℃ for 10 min and 42℃ for 50 min in a reaction cocktail containing 5× first strand buffer, 2.5 mM dNTP, 0.1M DTT, superscript III and RT-mixture. Quantification of the antioxidant enzymes was conducted by real-time quantitative PCR with SYBR green supermix (BioRad, CA, USA) under the following conditions: 5 min at 95℃, followed by 40 cycles of denaturation at 95℃ for 15 s and annealing at 60℃ for 30 sec and then extension at 72℃ for 30 sec. The PCR amplification cycle at which dye fluorescence passed the selected baseline (Ct) was determined by real-time monitoring. The expression of all mRNAs was calculated by the 2[ΔΔ] method [17] to see relative changes in gene expression using GADPH as an internal control.
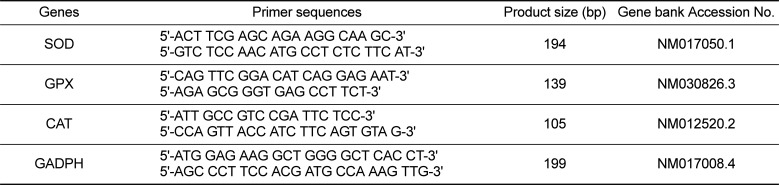
Table 1
Primers used for the quantification of mRNA using real time-PCR
![]()
Antioxidant enzyme activity, lipid peroxidation and total antioxidant capacity
All of the isolation procedure was performed according to the method of Kupfer and Levin [18] to harvest cytosol and microsome fractions from the liver. Liver tissues (1 g) were homogenized with a solution containing 0.25 M sucrose, 0.05 M Tris-HCl (pH 7.4), 0.005 M MgCl2, 0.025 M KCl and 0.008 M CaCl2 using a grass-grass homogenizer. The hepatic homogenate was centrifuged at 10,000×g for 15 min, after which time the resulting supernatant was diluted 1: 6 volume with a solution composed of 0.0125 M sucrose, 0.005M MgCl2, 0.025 M KCl and 0.008 M CaCl2. And then diluted supernatant was centrifuged at 1,500×g for 10 min, after which time the resulting supernatant was harvested as cytosol fraction. The pellet was dispersed in 0.25 M sucrose was centrifuged at 1,500×g for 10 min. After that the remnant pellet was suspended in a cold 1.15% KCl solution to harvest a microsomal fraction. The harvested supernatant (cytosol) and a suspended pellet (microsomes) were frozen in liquid nitrogen and stored at −70℃ until further assay. In brief, SOD activity in the cytosol fraction was measured using a commercial SOD assay kit (Sigma-Aldrich, St. Louis, MO, USA) based on an indirect assay method of xanthine oxidase as described in the manufacture's protocol. The activity of SOD is presented as units/mg of proteins, where 1 unit of activity was the amount of enzyme required to inhibit 50% of the SOD or SOD like substances. GPX was determined at 37℃ in the cytosol with cumene hydroperoxide as a substrate [19]. The GPX coupled the reduction of cumene hydroperoxide to the oxidation of NADPH by glutathione reductase, and the subsequent oxidation rate was monitored with a UV-spectrophotometer based on the decrease in absorbance at 340 nm. One unit of GPX is presented as the amount of GPX required to oxidize 1 mmol of NADPH per minute. Catalase (CAT) activity was measured by the amount of hydrogen peroxide (H2O2), which is produced by CAT. The decomposition of the substrate was measured using a spectrophotometer at 240 nm, and one unit activity was expressed as moles of H2O2 consumed per minute per mg protein [20]. The lipid peroxidation concentration in the microsomes was assessed by measuring thiobarbituric acid (TBA) substances [21]. Absorbance was determined using spectrophotometer at 532 nm, and TBA substances are expressed as nmol of malondialdehyde (MDA) per mg of protein. The plasma level of total antioxidant power was assayed using a commercially available assay kit with an ELISA reader (Oxford Biomedical Research, Inc., MI, USA). Assay procedures were carried out according to the manufacturer's protocols. Trolox was used to generate a standard curve, and data were presented as mM Trolox equivalents or in µM copper reducing equivalents. Protein concentration was analyzed by the BCA method (Pierce Assay) using ELISA reader (VMax, Molecular Devices, CA, USA).
Statistical analysis
All values are expressed as means±standard deviation (SD). Statistical analyses were performed using Proc GLM (SAS Institute Inc.). When the treatment effect was significant at P<0.05, Duncan multiple range test was performed to assess significant differences among groups. A P value of <0.05 was considered statistically significant.
Go to : 
Results
Body and organ weights and plasma biochemical profiles
The effects of oral administration of CoQ10 on body and immune organ weights and plasma biochemical profiles in LPS-injected rats are presented in Table 2 and 3, respectively. There were no significant effects of LPS challenge and CoQ10 administration on body weight, gain and the relative liver weight among groups (Table 2). However, the relative spleen weight in the LPS and LCQI groups significantly (P<0.05) increased compared with that in the CON group.
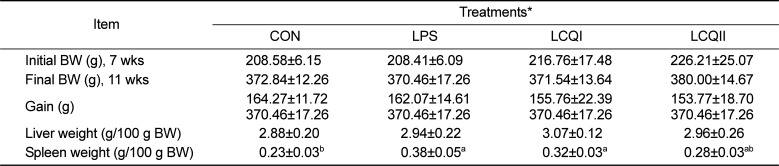
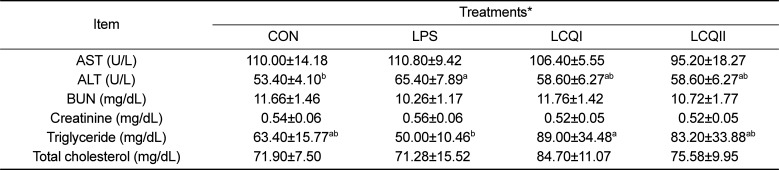
Table 2
Effect of coenzyme Q10 on the weights of the body, liver and spleen of SD rats challenged with LPS
![]()
Table 3
Effect of coenzyme Q10 on the plasma biochemical components of SD rats challenged with LPS
![]()
The plasma ALT level in the LPS group was significantly (P<0.05) higher than that in the CON group, while oral administration of 100 mg (LCQI) and 300 mg CoQ10 (LCQII) to LPS-injected rats did not increase in ALT level compared with the CON group. The blood triglyceride level in the LPS group was significantly (P<0.05) lower than that in LCQI group. However, the level of other biochemical parameters including AST, BUN, creatinine and total cholesterol did not differ among treatment groups (Table 3).
mRNA expression and activity of antioxidant enzymes in the liver
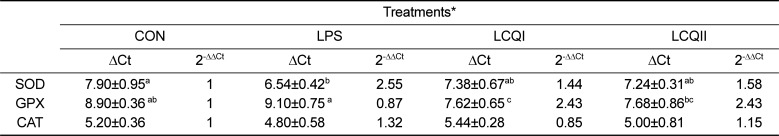
The effects of orally given CoQ10 on the mRNA expression and activities of SOD, GPX and CAT is shown in Table 4 and Figure 1, respectively. The LPS group showed a significantly (P<0.05) higher mRNA expression of SOD than the CON group. However, the oral supplementation with CoQ10 to rats challenged with LPS significantly (P<0.05) alleviated SOD mRNA expression level, which was comparable to the CON group (Table 4). The specific activity of SOD showed the same pattern of mRNA expression of SOD as depicted in Figure 1(A). The supplementation with CoQ10 to the LPS-treated group normalized the SOD expression, showing that the LCQI and the LCQII groups showed a similar SOD expression in comparison with the CON group. The mRNA expression of GPX in the LPS group resulted in a significant (P<0.05) decrease compared with that in the LCQI and LCQII groups (Table 4). Similar to the mRNA expression of GPX, the specific activity of GPX in the LCQI and LCQII groups was also significantly greater (P<0.05) than that of the LPS group (Figure 2). However, the mRNA expression and activity of CAT were not affected by the administration of LPS or CoQ10 in the liver of SD rats (Table 4, Figure 1).
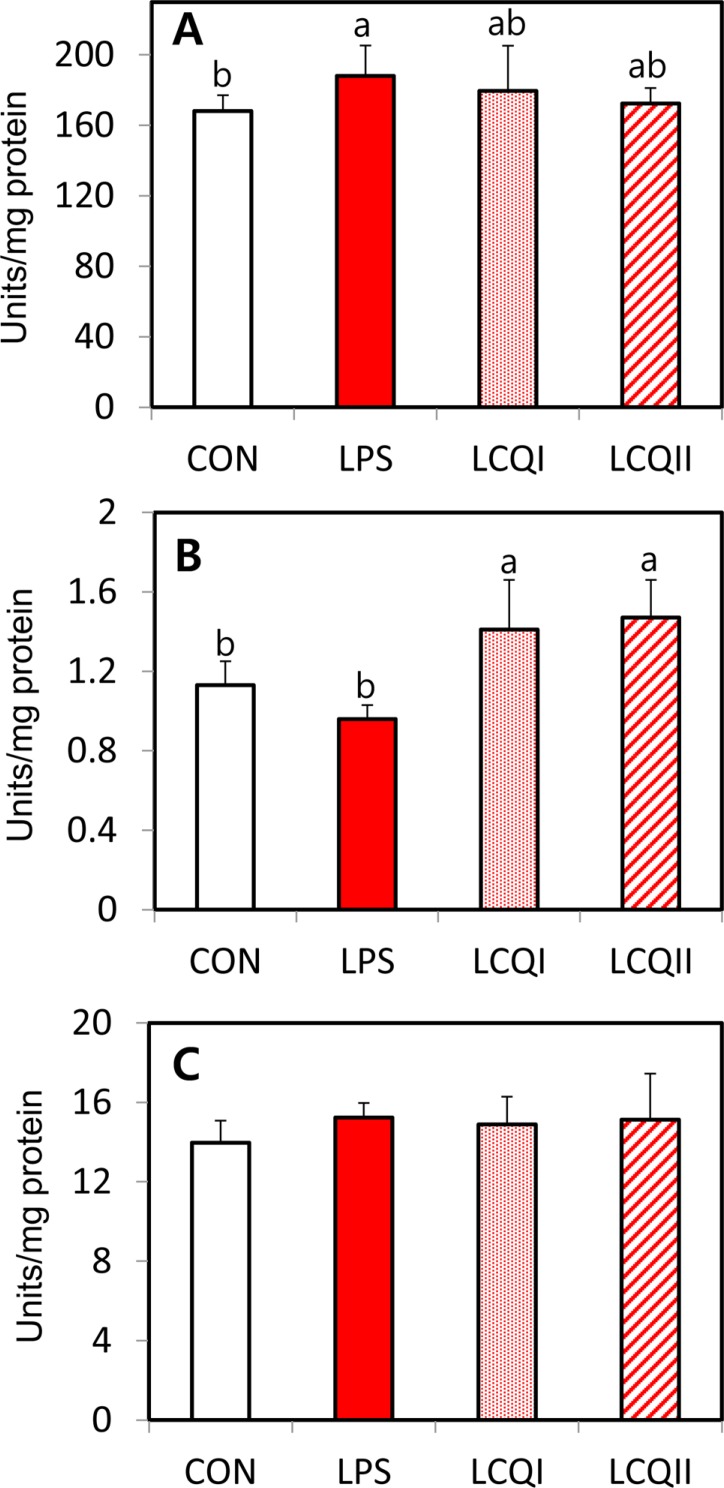 | Figure 1Specific activity of antioxidant enzymes (A: SOD, B: GPX and C: CAT) in the liver of SD rats administrated saline (CON), LPS injection (LPS), 100 mg of CoQ10/kg BW with injection of LPS (LCQI) and 300 mg of CoQ10/kg BW with injection of LPS (LCQII). Means (Mean±SD, n=6) with different superscript differ among groups (P<0.05).
|
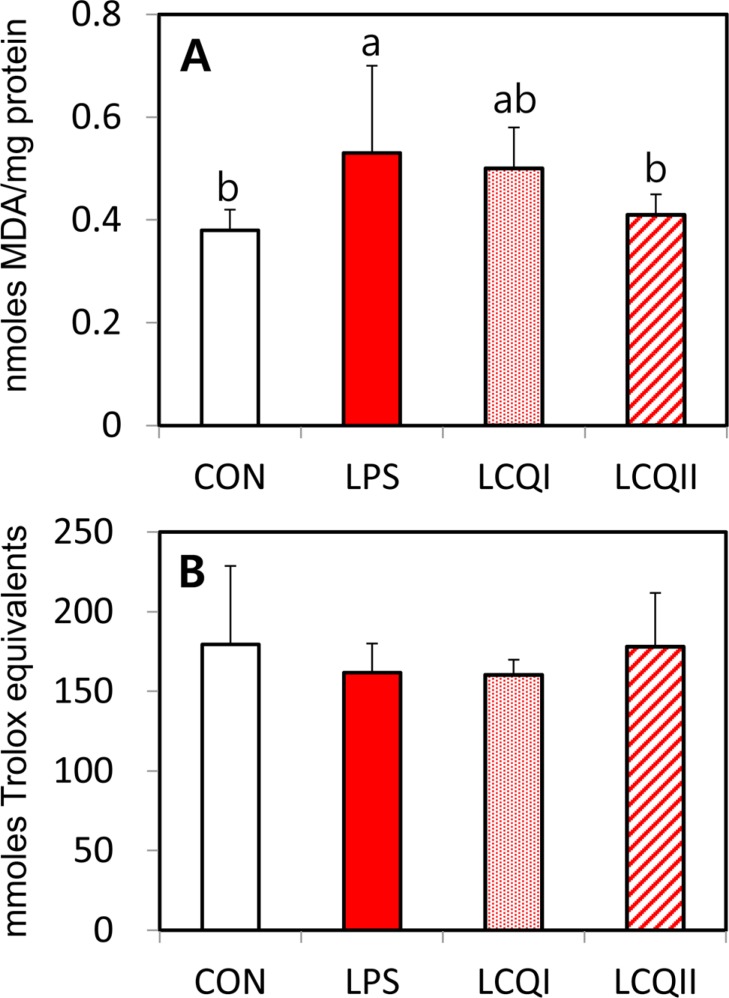 | Figure 2The levels of MDA (A) in microsomal fraction of the liver and total antioxidant power (B) in plasma of SD rats administrated saline (CON), LPS injection (LPS), 100 mg of CoQ10/kg BW with injection of LPS (LCQI) and 300 mg of CoQ10/kg BW with injection of LPS (LCQII). Means (Mean±SD, n=6) with different superscript differ among groups (P<0.05).
|
Table 4
Effect of coenzyme Q10 on the mRNA expression of antioxidant enzymes (SOD, GPX and CAT) in the liver of SD rats challenged with LPS
*CON (saline), LPS (1 mg LPS/kg BW), LCQI (1 mg LPS/kg BW+100 mg CoQ10) and LCQII (1 mg LPS/kg BW+300 mg CoQ10).
The values are ΔCt, which is represented as the Ct of each target gene corrected by Ct of the control gene (GADPH).
The fold difference in the relative expression of the target gene was calculated as the 2-ΔΔCt.
Means (Mean±SD, n=6) with different superscript differ among groups (P<0.05).
![]()
Total antioxidant power and lipid peroxidation in the blood and liver
The influence of a dietary CoQ10 on the level of lipid peroxidation and total antioxidant power (TAP) are presented in Figure 2. The concentration of lipid peroxidation as indicated by MDA level in the LCQII group was significantly (P<0.05) lower than that in the LPS group. Thus, the hepatic lipid peroxidation level was significantly (P<0.05) ameliorated by a dietary supplementation of 300 mg of CoQ10 to the LPS-treated rats (Figure 2A), although there was no significant difference in MDA level between the LPS-treated rats and the LPS-treated rats that were given 100 mg of CoQ10 supplements.
Plasma TAP in the LPS group numerically decreased compared with that in the other groups without statistical significance. Thus, the administration of CoQ10 to rats challenged with LPS did not affect the level of TAS in this study (Figure 2B).
Go to :
Discussion
CoQ10, a natural ubiquinone synthesized in the membrane of the liver, heart, kidneys and muscles, is known to be a redox-active lipophilic antioxidant, scavenging ROS and inhibiting lipid peroxidation in the body [310]. The ability of CoQ10 to scavenge ROS is much greater than vitamin E and it was also known to facilitate the absorption of lipid soluble antioxidant vitamins such as vitamin A and E [1011].
In this study, the possible protective effect of CoQ10 against hepatic oxidative damage in young rats challenged with LPS was investigated. As expected, the LPS challenge significantly increased the levels of blood ALT and spleen weight in rats. The leakage of hepatic enzymes including ALT and AST into the blood stream was directly associated with marked liver injury [22]. Our results were in agreement with earlier studies that LPS challenge resulted in a significant increase in blood AST and ALT in pigs and rodents [2324]. Interestingly, CoQ10 administration to rats challenged with LPS in this study significantly normalized LPS-induced increases in ALT activity and the relative spleen weight of rats. In accordance with this study, CoQ10 significantly normalized the levels of serum AST and ALT activities in several studies, indicating that dietary CoQ10 might be associated with alleviating liver damage induced by toxic agents [2526].
In general, it was reported that hepatic oxidative stress induced by LPS was closely associated with the generation of ROS in the liver [27]. Therefore, the mRNA expression and activity of antioxidant enzymes, lipid peroxidation and total antioxidant capacity were analyzed to investigate the effects of CoQ10 against the oxidative liver damage of rats challenged with LPS in the study. From our observation, the level of hepatic SOD mRNA and activity in rats challenged with LPS resulted in a marked increase in comparison with the CON rats. However, the administration of CoQ10 to LPS-treated rats showed a similar level of mRNA and activity of SOD compared with the CON rats, indicating that supplementation with CoQ10 normalized an increased level of SOD expression in the LPS group. Furthermore, the administration of CoQ10 to LPS-treated rats markedly increased GPX mRNA expression and activity compared with the LPS treated rats. However, the administration of CoQ10 did not affect hepatic lipid peroxidation and total antioxidant capacity in LPS or CoQ10 treated rats. Thus, it is postulated that that CoQ10 has protective or alleviative effects against LPS-induced oxidative stress in the hepatic tissue of rats by a free radical scavenging capacity through antioxidant defense mechanism.
It has been well recognized that excess ROS are eliminated by antioxidant enzymes, which are represented by SOD, GPX and CAT in the body. SOD directly converts superoxide anion to hydrogen peroxide [28], thereafter both GPX and CAT, the two main enzymes, are involved in the detoxification of H2O2 in a cellular antioxidant defense system [29]. Numerous studies have demonstrated that CuZn-SOD level is up-regulated in patients suffering from hepatitis, renal failure, diabetes and uremia [3031]. LPS, a cell wall components of gram negative bacteria, seems to induce oxidative stress in the liver, which was involved in the hepatic injury of laboratory animals. A study [32] reported that LPS activated macrophages to induce numerous inflammatory ROS including superoxide anion, which was responsible for the activation of SOD expression to eliminate these radicals in the liver of rats exposed to enterotoxin [33]. In accordance with the result of our study, a study [34] demonstrated that hepatic SOD mRNA expression and activity were much greater from the LPS-treated rats than that from the control rats.
According to a recent report [8], dietary supplementation with CoQ10 resulted in a significant decrease in LPS-induced ROS production and a significant improvement of mitochondrial functions in vitro study. There are numerous reports that the application of CoQ10 to laboratory animals, which were treated with toxic substances such as LPS, could help to maintain a normal level of antioxidant enzymes and antioxidant status in the liver [21035]. In addition, CoQ10 supplementation in young mice significantly increased the endogenous level of vitamin E in the plasma, heart and liver [7], suggesting that the elevated antioxidant potential of CoQ10 is partially associated with increasing level of vitamin E. In partial agreement with the results of this study, alloxan-induced diabetes rats orally administered CoQ10 (15 mg/kg of BW, i.p) showed significantly increased the serum level of glutathione and activities of SOD and CAT compared with diabetic rats [36]. Our findings also indicate that the administration of CoQ10 at the level of above 100 mg/kg BW has a potent alleviating effect against LPS-induced oxidative stress in rats.
On the other hand, contradictory studies concerning the effects of CoQ10 on antioxidant defense system have been reported [1637]. Dietary CoQ10 did not directly affect the changes in antioxidant enzymes including SOD, GPX and CAT as well as in the life span of laboratory rats [1637]. However, the antioxidant properties of CoQ10 may be was attributed to potentiating electron transport chain where it plays a crucial role in electron donor and acceptor in the mitochondria of the liver [15]. This discrepancy might be due to differences in factors such as age of laboratory animals, dosage and duration of CoQ10 level and dietary formulation [716].
In general, however, it is clear that dietary supplementation with CoQ10 attenuates hepatic oxidative injury via the modulation of antioxidant enzymes and their antioxidant capacities under severe oxidative stress circumstance [836], although the detailed antioxidant mechanisms of CoQ10 were not fully elucidated. In agreement with this hypothesis, our study also demonstrated that supplementation with CoQ10 in rats challenged with LPS maintained the same level of SOD, GPX and lipid peroxidation in comparison with the control rats. Therefore, supplementation with CoQ10 appeared to have potentiating effects on the antioxidant defense mechanism by directly scavenging ROS through the induction of antioxidant enzymes.
Overall, it could be proposed that CoQ10 may exert its favorable effect against liver damage by the modulation of antioxidant enzymes in LPS-treated rats. Therefore, this study suggests that dietary CoQ10 has beneficial effects on antioxidant defense system in laboratory animals under severe oxidative stress conditions.
Go to :
 XML Download